Al-Noaman, Ahmed
For additional information about this publication click this link. http://qmro.qmul.ac.uk/jspui/handle/123456789/3342
Information about this research object was correct at the time of download; we occasionally make corrections to records, please therefore check the published record when citing. For more information contact scholarlycommunications@qmul.ac.uk
0
Novel Bioactive Glass Coating for Dental Implant
By
Ahmed Al-Noaman
A thesis submitted in fulfilment of the requirement for the degree of Doctor of Philosophy in Institute of Dentistry, Queen Mary University of London
Institute of Dentistry, Bart’s and the London School of Medicine and Dentistry, Queen Mary University of London
1
Abstract:
With an increasingly ageing population the requirement for titanium implants will grow. A major challenge is to speed up the rate and strength of osseo-integration. Bioactive glass coated titanium is postulated to improve bone-bonding ability of titanium. However, bioactive glasses have a higher thermal expansion coefficient (TEC) than titanium and are more prone to crystallization during coating process. Therefore, the aim was to develop a bioactive glass coating that matches the TEC of titanium does not crystallize during coating process and forms surface apatite in vivo and in vitro. To achieve these qualities certain compounds (MgO, CaF2 and MgF2 and
fluorapatite (FA) crystals) were substituted or added to the glass composition. The glasses were prepared using melt-derived route. The ground glasses were sieved to obtain less than 45 µm diameter glass particles and this powder characterised using X-ray diffraction (XRD), differential scanning calorimetry (DSC) and Fourier transform infrared spectroscopy (FTIR). Glass rods were cast to measure TEC, glass transition temperature (Tg) and
softening temperature (Ts) using Dilatometry. Glass structure was
investigated by measuring glass density and oxygen density. The apatite-forming ability of the glass powder was assessed in both Tris-buffer and simulated body fluid (SBF). Filtrates were analysed by inductively coupled plasma spectroscopy (ICP). Titanium disks were coated with bioactive glass/composites using the enamelling technique. Coated samples were characterised by (XRD, FTIR) and scanning electron microscopy (SEM-EDS). Bioactivity of coating samples was studied after 1 month immersion in Tris-buffer solution or SBF. Biocompatibility assays of glass coatings were assessed using UMR106 osteoblast-like cells and a fibroblast cell line.
The results generated some interesting findings – firstly it is possible to produce glasses with comparable TEC of titanium and wide sintering windows. Although most preparations were more bioactive compared with those of Saiz and Tomsia–not all preparations were bioactive. Some coatings were biocompatible with fibroblasts, but not osteoblast-like cells. Whilst some glasses might not be suitable for a coating, they may have use as structural scaffolds for skeletal reconstruction.
2
Acknowledgment:
I would like to express my sincere appreciation to my supervisors Prof. R. Hill and Dr. S. Rawlinson for their inspiration, encouregment, patience and guidance throughout the duration of this project. They showed me a great generosity of time and spirit in teaching and training me during my PhD course, for which I am very grateful.
Most cordial thanks go to Dr N. Karpukhina for her scientific and moral support and advice. I would like to thank Dr A. Waseem and Dr I. Mckay for their cooperation and advice on cell culture techniques. I am grateful for academic and technical staff in the following departments: Engineering and material department (Dr. R. Wilson, Dr Z.Luklinska, Dr N. Roohpour and Mr. V. Ford), Geography department ( Dr K. Peel and Dr L. Shotbolt) and the Chemistry department (Mr. J. Hamdan).
I would like to thank Prof. Hill’s group (Dr D. Brauer, Dr A. Theocaropoulus and Dr X. Chen) in the department of dental physical sciences who demonstrated kinedly certain experimental techniques during my laboratory work. My special thanks to the staff and PhD students in the clinical and diagnostic oral sciences department for their cooperation during the cell culture works. I am grateful to Dr S. Shahdad for his clinical advice on dental implantology.
Finally I would like to express my thanks to my family for their support and inspiration during my study.
3
Table of contents
Abstract:... 1
Table of contents ... 3
1. Introduction and background ...22
1.1 Introduction ...22
1.2 Attempts of coating titanium implant thermally with bioactive materials: Back ground.. ... ………...………..23
1.3 Structure of the thesis: ...25
1.4 Hypothesis: ...25
1.5 Aims and objectives of the study: ...26
2. Literature review ...27
2.1Dental implant: ...27
2.1.1 Overview: ... 27
2.1.2 Failure of dental implants: ... 30
2.1.3 Outcome of dental implant in medically compromised patients: ... 32
2.1.4 Biomaterial of dental implant: ... 34
2.1.5 Types of dental implant surfaces: ... 36
2.1.6 Methods of surface modifications: ... 37
2.1.6.1. Ablative methods: ... 37 2.1.6.2. Additive methods: ... 38 2.1.6.2.1 Plasma spraying ... 38 2.1.6.2.2 Enamelling technique ... 39 2.2 Bone tissue: ...42 2.2.1 Bone cells: ... 42 2.2.2 Bone structure: ... 43 2.2.3 Bone matrix: ... 45 2.2.4 Biomineralization process: ... 46
2.2.5 Soft tissue around dental implant: ... 48
2.2.6 Bone-implant interface: ... 50
2.3 Biological role of additional elements ...51
2.3.1 Biological role of magnesium: ... 51
2.3.2 Biological role of fluoride: ... 52
2.4 Glass and glass structure...54
2.4.1 History of Glass: ... 54
2.4.2 Definition of glass: ... 54
2.4.3 Glass formation: ... 56
2.4.4 Structural theories of glass: ... 57
2.4.4.1 Goldschmidt’s theory: ... 58
2.4.4.2 Zachariasen’s rules: ... 58
2.4.5 Other glass formation theories: ... 62
2.5 Bioactive material ...65
4
2.5.2 Bioactive glasses: ... 68
2.5.3 Surface reaction of bioactive glasses: ... 71
2.5.4 Compositional effect: ... 73
2.5.5 The effect of network connectivity on glass bioactivity: ... 76
2.5.6 Structural role of phosphorus: ... 78
2.5.7 Structural role of magnesium: ... 78
2.5.8 Structural role of Zinc: ... 79
2.5.9 Structural role of fluorine: ... 80
2.5.10 Split network model: ... 81
2.5.11 Shortcomings of network connectivity: ... 82
2.5.12 Criteria for successful coating of dental implant:... 82
3. Materials and methods ...84
3.1 Rational: ...84
3.2 Glass composition design: ...85
3.3 Glass synthesis: ...87
3.3.1 MgO series ... 87
3.3.2 CaF2 series ... 87
3.3.3 MgF2 series ... 88
3.4 Synthesis of fluorapatite(FA): ...88
3.4.1 MgF2 glass-FA composite preparation: ... 88
3.5 Glass characterization:...90
3.5.1 X-ray diffraction (XRD): ... 90
3.5.2 Differential scanning calorimetry (DSC): ... 90
3.5.3 Glass casting: ... 91
3.5.4 Dilatometry analysis: ... 91
3.6 Glass structure ...92
3.6.1 Bulk Density:... 92
3.6.2 Oxygen density: ... 93
3.7 Fourier transforms Infrared spectroscopy (FTIR): ...93
3.8 Coating process: ...93
3.9 Conditions of coating process: ...94
3.11 Bioactivity test: ...96
3.11.1 Glass powder: ... 96
3.11.2 Coated disks: ... 97
3.11.3 Characterization of treated samples: ... 97
3.11.3.1 Inductively coupled plasma-optical emission spectroscopy (ICP-OES): .... 97
3.11.3.2 Fluoride-selective electrode: ... 97
3.11.3.3 X-ray diffraction and Fourier transform infra-red spectroscopy: ... 98
3.11.3.3 Scanning electron microscopy (SEM-EDS): ... 98
3.12 Cell culture studies: ...98
3.12.1 Cell spreading and morphology: ... 99
3.12.2 Mineralization assay: ... 99
3.12.3 Qualitative assay of ALP activity: ... 99
3.12.4 Quantitative assay of ALP activity: ... 100
5
4.1 Results- MgO series ...101
4.1.1 X-ray diffraction (XRD): ... 101
4.1.2 DSC of glass powder: ... 101
4.1.2.1 Effect of MgO on glass transition temperature (Tg): ... 101
4.1.2.2 Effect of MgO on crystallization temperature (Tp): ... 102
4.1.2.3 Effect of different heating rates: ... 102
4.1.2.4 Extrapolated values at thermal and isothermal conditions: ... 106
4.1.2.5 Effect of particle size on peak crystallization: ... 107
4.1.3 Dilatometry analysis: ... 109
4.1.3.1 Glass transition temperature (Tg): ... 109
4.1.3.2 Softening temperature (Ts): ... 110
4.1.3.3 Thermal expansion coefficient (TEC): ... 110
4.1.4 Structure of MgO glass series: ... 113
4.1.4.1 Bulk glass density: ... 113
4.1.4.2 Oxygen density: ... 113
4.1.5 Bioactivity test:... 114
4.1.5.1Tris-Buffer study/ 2 weeks, 1 month: ... 115
4.1.5.1.1 pH changes: ... 115
4.1.5.1.2 ICP-OES analysis: ... 116
4.1.5.1.3 XRD: ... 120
4.1.5.1.4 FTIR: ... 121
4.1.5.2 SBF studies: 3 days, 1 week, 2 weeks & 1 month ... 122
4.1.5.2.1 pH changes: ... 122
4.1.5.2.2 ICP-OES analysis: ... 124
4.1.5.2.3 Ionic dissolution with time: ... 126
4.1.5.2.4 XRD: ... 128
4.1.5.2.5 FTIR: ... 129
4.1.6 Coating of MgO series ... 131
4.1.6.1 Characterization of Initial glass coating: ... 131
4.1.6.1.1 XRD: ... 131
4.1.6.1.2 FTIR: ... 133
4.1.6.1.3 Scanning electron microscopy (SEM-EDS): ... 133
4.1.6.2 Glass- metal adhesion: ... 137
4.1.6.3 Bioactivity tests of MgO glass coatings: ... 138
4.1.6.3.1 pH changes: ... 138
4.1.6.3.2 ICP-OES analysis: ... 139
4.1.6.3.3 XRD: ... 141
4.1.6.3.4 FTIR: ... 142
4.1.6.3.5 SEM-EDS of glass-metal interface: ... 143
4.2 Discussion-MgO series ...146
4.2.1 DSC of glass powder: ... 146
4.2.1.1 Effect of MgO on glass transition temperature (Tg): ... 146
6
4.2.1.3 Effect of different heating rates: ... 147
4.2.1.4 Extrapolated values at thermal and isothermal conditions: ... 147
4.2.1.5 Effect of particle size on peak crystallization: ... 148
4.2.3 Dilatometry analysis: ... 149
4.2.3.1 Glass transition temperature (Tg): ... 149
4.2.3.2 Softening temperature (Ts): ... 150
4.2.3.3 Thermal expansion coefficient (TEC): ... 150
4.2.4 Structure of MgO glass series: ... 152
4.2.4.1 Bulk glass density: ... 152
4.2.4.2 Oxygen density: ... 152
4.2.5 Bioactivity test:... 153
4.2.5.1Tris-Buffer study/2 weeks, 1 month: ... 153
4.2.5.1.1 pH changes: ... 153
4.2.5.1.2 ICP-OES analysis: ... 153
4.2.5.1.3 XRD ... 155
4.2.5.1.4 FTIR: ... 155
4.2.5.2 SBF studies: 3 days, 1 week, 2 weeks& 1 month ... 156
4.2.5.2.1 pH changes: ... 156
4.2.5.2.2 ICP-OES analysis: ... 156
4.2.5.2.3 Ionic dissolution with time: ... 158
4.2.5.2.4 XRD: ... 158
4.2.5.2.5 FTIR: ... 159
4.2.6 Coating of MgO series ... 159
4.2.6.1 Characterization of Initial glass coating: ... 159
4.2.6.1.1 XRD: ... 159
4.2.6.1.2 FTIR: ... 160
4.2.6.1.3 Scanning electron microscopy (SEM-EDS): ... 161
4.2.6.2 Glass- metal adhesion: ... 162
4.2.6.3 Bioactivity tests of MgO glass coatings: ... 162
4.2.6.3.1 pH changes: ... 162
4.2.6.3.2 ICP-OES analysis: ... 163
4.2.6.3.3 XRD: ... 165
4.2.6.3.4 FTIR: ... 166
4.2.6.3.5 SEM-EDS of glass-metal interface: ... 166
5. CaF2 series ...168
5.1 Results - CaF2 series ...168
5.1.1 X-ray diffraction (XRD): ... 168
5.1.2. Differential scanning Calorimetry (DSC) ... 168
5.1.2.1 Effect of CaF2 on glass transition temperature (Tg): ... 168
5.1.2.2 Effect of CaF2 on peak crystallization (Tp) and sintering window: ... 169
5.1.2.3 Effect of different heating rates: ... 171
5.1.2.3 The effect of particle size on peak crystallization: ... 174
7
5.1.3.1. Glass transition temperature and softening point: ... 175
5.1.3.2. Thermal expansion coefficient (TEC): ... 177
5.1.4. Glass density: ... 177
5.1.5. Bioactivity test:... 178
5.1.5.1. pH changes: ... 178
5.1.5.2. Fluoride-analysis ... 179
5.1.5.2.1 As a function of CaF2 content: ... 179
5.1.5.2.2 Fluoride measurement with soaking time: ... 181
5.1.5.3 ICP-OES analysis ... 181
5.1.5.4 XRD: ... 186
5.1.5.5 FTIR: ... 188
5.1.6. Coating of CaF2 series: ... 189
5.1.6.1 Characterization of Initial glass coating: ... 190
5.1.6.1.1 XRD: ... 190
5.1.6.1.2 XRD of failed coatings: ... 191
5.1.6.1.3 FTIR: ... 193
5.1.6.1.4 FTIR of failed coating: ... 194
5.1.6.1.5 Scanning electron microscopy (SEM-EDS): ... 195
5.1.6.1.7 Glass-metal interface: ... 196
5.1.6.2 Glass – metal interface: ... 198
5.1.6.3 Bioactivity tests of CaF2 glass coatings: ... 199
5.1.6.3.1 pH changes: ... 199
5.1.6.3.2 Fluoride analysis: ... 201
5.1.6.3.3 ICP-OES of glass coatings: ... 201
5.1.6.3.4 XRD: ... 203
5.1.6.3.5 FTIR: ... 204
5.1.6.3.6 SEM-EDS: ... 206
5.2 Discussion-CaF2 series ...210
5.2.1 Differential scanning Calorimetry (DSC) ... 210
5.2.1.1 Effect of CaF2 on glass transition temperature (Tg): ... 210
5.2.1.2 Effect of CaF2 on peak crystallization (Tp) and sintering window: ... 210
5.2.1.3 Effect of different heating rates: ... 211
5.2.1.4 The effect of particle size on peak crystallization: ... 211
5.2.2. Dilatometry results ... 213
5.2.2.1. Glass transition temperature and softening point: ... 213
5.2.2.2. Thermal expansion coefficient (TEC): ... 213
5.2.3 Glass density: ... 213
5.2.4 Bioactivity test:... 213
5.2.4.1. pH changes: ... 213
5.2.4.2. Fluoride-analysis ... 214
5.2.4.2.1 As a function of CaF2 content: ... 214
5.2.4.2.2 Fluoride measurement with soaking time: ... 215
8
5.2.4.4 XRD: ... 216
5.2.4.5 FTIR: ... 217
5.2.5. Coating of CaF2 series: ... 217
5.2.5.1 Characterization of Initial glass coating: ... 217
5.2.5.1.1 XRD: ... 217
5.2.5.1.2 XRD of failed coatings: ... 218
5.2.5.1.3 FTIR: ... 218
5.2.5.1.4 FTIR of failed coating: ... 218
5. 2.5.1.5 Scanning electron microscopy(SEM-EDS): ... 219
B- Glass-metal interface:... 219
5.2.5.2 Glass – metal interface: ... 219
5.2.5.3 Bioactivity tests of CaF2 glass coatings: ... 220
5.2.5.3.1 pH changes: ... 220
5.2.5.3.2 Fluoride analysis: ... 221
5.2.5.3.3 ICP-OES of glass coatings: ... 221
5.2.5.3.4 XRD: ... 222
5.2.5.3.5 FTIR: ... 222
5.2.5.3.6 SEM-EDS: Tris buffer& SBF ... 223
6. MgF2 series...224
6.1 Results- MgF2 series ...224
6.1.1 Introduction: ... 224
6.1.2 X-ray diffraction (XRD): ... 224
6.1.3 Differential scanning calorimetry (DSC): ... 225
6.1.3.1 Effect of MgO on glass transition temperature (Tg): ... 225
6.1.3.2 Effect of MgO on peak crystallization and the sintering window: ... 225
6.1.3.3 Effect of heating rates on peak crystallization: ... 227
6.1.3.4 Effect of particle size on peak crystallization: ... 230
6.1.4 Dilatometry ... 231
6.1.4.1 Glass transition temperature (Tg): ... 231
6.1.4.2 Effect of MgO on softening point (Ts): ... 233
6.1.4.3 Thermal expansion coefficient (TEC): ... 233
6.1.5 Density of glass: ... 234
6.1.6 Bioactivity test:... 235
6.1.6.1 pH changes: ... 235
6.1.6.2 Fluoride analysis: ... 238
6.1.6.2.1 As a function of MgO content: ... 238
6.1.6.2.2 Fluoride measurement with time: ... 240
6.1.6.3 ICP- OES analysis: ... 242
6.1.6.3.1 As a function of MgO content: ... 242
6.1.6.3.2 As a function of immersion time: ... 243
6.1.6.4 XRD: ... 245
6.1.6.5 FTIR: ... 247
9
6.1.7.1 Characterization of Initial glass coating: ... 249
6.1.7.1.1 XRD: ... 249
6.1.7.1.2 FTIR: ... 250
6.1.7.1.3 Scanning electron microscopy (SEM-EDS): ... 251
6.1.7.2 Glass- metal interface: ... 254
6.1.7.3 Bioactivity tests of MgF2 glass coatings: ... 256
6.1.7.3.1 pH changes: ... 256 6.1.7.3.2 Fluoride analysis: ... 257 6.1.7.3.3 ICP analysis: ... 258 6.1.7.3.4 XRD: ... 259 6.1.7.3.5 FTIR: ... 260 6.1.7.3.6 SEM-EDS analysis: ... 262 6.2 Discussion- MgF2 series ...266
6.2.1 Differential scanning calorimetry (DSC): ... 266
6.2.1.1 Effect of MgO on glass transition temperature (Tg): ... 266
6.2.1.2 Effect of MgO on peak crystallization and the sintering window: ... 266
6.2.1.3 Effect of heating rates on peak crystallization: ... 267
6.2.1.4 Effect of particle size on peak crystallization:... 267
6.2.3 Dilatometry ... 268
6.2.3.1 Glass transition temperature (Tg): ... 268
6.2.3.2 Effect of MgO on softening point (Ts): ... 268
6.2.3.3 Thermal expansion coefficient (TEC): ... 268
6.2.4 Density of glass: ... 269
6.2.5 Bioactivity test:... 269
6.2.5.1 pH changes: ... 269
6.2.5.2 Fluoride analysis: ... 270
A- As a function of MgO content: ... 270
B- Fluoride measurement with time: ... 271
6.2.5.3 ICP- OES analysis: ... 271
A- As a function of MgO content: ... 271
B- As a function of immersion time: ... 272
6.2.5.4 XRD: ... 273
6.2.5.5 FTIR: ... 274
6.2.6 Coating of MgF2 series: ... 274
6.2.6.1 Characterization of Initial glass coating: ... 274
6.2.6.1.1 XRD: ... 274
6.2.6.1.2 FTIR: ... 274
6.2.6.1.3 Scanning electron microscopy (SEM-EDS): ... 275
6.2.6.2 Glass- metal interface: ... 276
6.2.6.3 Bioactivity tests of MgF2 glass coatings: ... 277
6.2.6.3.1 pH changes: ... 277
6.2.6.3.2 Fluoride analysis: ... 277
10
6.2.6.3.4 XRD: ... 278
6.2.6.3.5 FTIR: ... 279
6.2.6.3.6 SEM-EDS analysis:Tris-study and SBF ... 280
7. MgF2-FA series ...281
7.1 Results - MgF2-FA series ...281
7.1.2 Characterization of the composite powder: ... 281
7.1.2.1 X-Ray diffraction (XRD): ... 281
7.1.2.2 Fourier transform infra-red spectroscopy (FTIR): ... 281
7.1.3 Bioactivity of the composite-powder: ... 282
7.1.3.1 pH of Tris-buffer solution: ... 282
A- pH (with immersion time): ... 282
B- pH (as a function of MgO content): ... 284
7.1.3.2 Fluoride analysis: ... 285
A- Fluoride released as a function of MgO content: ... 285
B- Fluoride released with immersion time: ... 286
7.1.3.3 ICP analysis: ... 287
A- Ionic dissolution as a function of MgO content: ... 287
B- Ionic dissolution with soaking time: ... 288
7.1.3.4 XRD: ... 289
7.1.3.4 FTIR: ... 293
7.1.4 Coating of MgF2-FA series ... 295
7.1.4.1Characterization of Initial glass coating: ... 295
7.1.4.1.1 XRD: ... 295
7.1.4.1.2 FTIR: ... 297
7.1.4.1.3 SEM-EDS of glass coating: ... 299
7.1.4.2 The composite- metal interface: ... 307
7.1.4.3 Bioactivity test of composite coatings: ... 308
7.1.4.3.1 pH changes: ... 308 7.1.4.3.2 Fluoride analysis: ... 310 7.1.4.3.3 ICP analysis: ... 311 7.1.4.3.4 XRD: ... 314 7.1.4.3.5 FTIR: ... 317 7.1.4.3.6 SEM-EDS: ... 319
7.2. Discussion- MgF2-FA series ...328
7.2.1 Introduction: ... 328
7.2.2 Characterization of the composite powder: ... 329
7.2.2.1 X-Ray diffraction(XRD): ... 329
7.2.2.2 Fourier transform infra-red spectroscopy (FTIR): ... 329
7.2.3 Bioactivity of the composite-powder: ... 329
7.2.3.1 Role of silica-gel layer in apatite formation: ... 329
7.2.3.2 Epitaxial growth: ... 330
7.2.3.3 Apatite as a seeding nucleation: ... 331
11
7.2.3.4.1 pH (with immersion time): ... 332
7.2.3.4.2 pH (as a function of MgO content):... 333
7.2.3.5 Fluoride analysis: ... 333
7.2.3.5.1 Fluoride released as a function of MgO content: ... 333
7.2.3.5.2 Fluoride released with immersion time: ... 334
7.2.3.6 ICP analysis: ... 334
7.2.3.6.1 Ionic dissolution as a function of MgO content: ... 334
7.2.3.6.2 Ionic dissolution with soaking time: ... 335
7.2.3.7 XRD: ... 336
7.2.3.8 FTIR: ... 337
7.2. 4 Coating of MgF2-FA series ... 337
7.2.4.1Characterization of Initial glass coating: ... 337
7.2.4.1.1 XRD: ... 337
7.2.4.1.2 FTIR: ... 338
7.2.4.1.3 SEM-EDS of glass coating: ... 338
7.2.4.2 The composite- metal interface: ... 340
7.2.4.3 Bioactivity test of composite coatings: ... 342
7.2.4.3.1 pH changes: ... 342 7.2.4.3.2 Fluoride analysis: ... 342 7.2.4.3.3 ICPanalysis: ... 343 7.2.4.3.4 XRD: ... 345 7.2.4.3.5 FTIR: ... 345 7.2.4.3.6 SEM-EDS: ... 346 8. Cell culture ...349
8.1. Results of cell culture ...349
8.1.1 Cell attachment and cell morphology: ... 349
8.1.2 Mineralization assay: ... 355
8.1.3 Alkalin phosphatase (ALP) activity-Qualitative assay: ... 357
8.1.4 ALP activity-quantitative assay:... 358
8.2 Discussion-Cell culture studies ...360
8.2.1 Introduction ... 360
8.2.2 Cell attachment and cell morphology: ... 361
8.2.3 Mineralization assay: ... 365
... 367
8.2.4 ALP activity-Qualitative assay: ... 367
8.2.5 ALP activity-quantitative assay:... 367
9. Conclusion ...369
10. Suggestion of Future work ...374
12
List of Figures
Figure 1: Dental implant (endosteal type). ... 27
Figure 2: Subperiosteal type. ... 28
Figure 3: Transosteal (transmandibular) type. ... 29
Figure 4: Schematic representation of bone cells. . ... 42
Figure 5: Bone structure. ... 44
Figure 6: Soft tissues around dental implant and natural tooth. ... 48
Figure 7: Illustration of bone-implant interaction.. ... 50
Figure 8: Temperature - enthalpy (or volume) correlation of a glass forming melt. ... 57
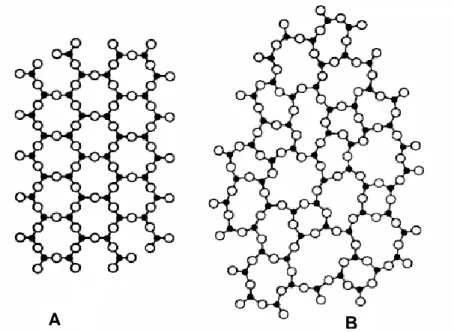
Figure 9: Illustrations of the molecular differences between: A- crystalline and B- glass structure. ... 59
Figure 10: 2-dimensional network of glass structure. . ... 61
Figure 11: Ternary phase diagram expressed in weight percentage. . ... 74
Figure 12: The role of Mg (A) network modifier and (B) an intermediate oxide. ... 79
Figure 13: Effect of CaF2 on network connectivity (glass structure). ... 81
Figure 14: DSC plot showing the glass transition temperature (Tg), the onset of peak crystallization (Tpcon) and crystallization temperature (Tp). ... 91
Figure 15: Dilatomatry trace showing thermal expansion coefficient (TEC), glass transition temperature (Tg) and softening temperature (Ts). ... 92
Figure 16: Precipitation and coating procedure by enamelling technique. ... 94
Figure 17: XRD patterns of MgO glasses with different MgO concentrations (mol%). ... 101
Figure 18: Effect of MgO on glass transition temperature. ... 102
Figure 19: Effect of MgO on peak crystallization temperature (Tp). ... 102
Figure 20: Effect of different heating rates on peak crystallization-QM10(18 mol%)... 103
Figure 21: Ea plot (activation energy for Tg and Tpcon -QM5- 7.8 mol%)... 105
Figure 22: Effect of particle sizes on peak crystallization temperature (Tp)-QM9 (9 mol%). 107 Figure 23: Surface crystallization. Taken from (Arstila et al., 2008). ... 108
Figure 24: Effect of particle size on peak crystallization temperature of MgO glasses. ... 109
Figure 25: Effect of MgO on glass transition temperature () and softening point (). ... 109
Figure 26: Effect of MgO on Tg obtained from dilatometry () and DSC (). ... 110
Figure 27: Effect of MgO concentration on experimental TEC measured at (100-500oC). . 111
Figure 28: Calculated () and experimental () TEC as a function of MgO content ... 112
Figure 29: Effect of substituted MgO on bulk density of MgO glass series. ... 113
Figure 30: Effect of substituted MgO on oxygen density of MgO glasses. ... 114
Figure 31: Effect of MgO content on oxygen density of Watts (-high Na series and Δ -low Na series), Kwon () and MgO glasses (●). ... 114
Figure 32: pH variation of Tris-buffer solution with time after 2-weeks immersion. ... 115
Figure 33A: Ionic dissolution of MgO glasses in Tris-buffer as a function of MgO content/ 2 weeks. ... 116
13
Figure 33B: Ionic dissolution of MgO glasses in Tris-buffer solution based on normalised
values-2 weeks. ... 117
Figure 34A: Ionic dissolution of MgO glasses as a function of MgO content in Tris-buffer solution-1 month. ... 118
Figure 34B: Ionic dissolution of MgO glasses in Tris-buffer solution based on normalised values- 1 month. ... 119
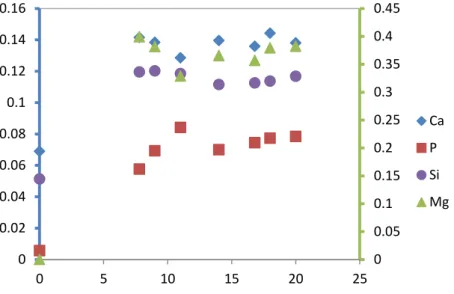
Figure 35: Ionic dissolution of Ca, P, Mg and Si in Tris-buffer solution with immersion time. ... 120
Figure 36A: XRD patterns of QM8 (14 mol%) before and after immersion in Tris-buffer. ... 121
Figure 36B: FTIR spectrum of QM8 (14 mol%) before and after immersion in Tris-buffer. . 122
Figure 37: pH variation of SBF with time after 2-weeks immersion. ... 123
Figure 38A: Ionic dissolution with MgO content after 3 days immersion in SBF. ... 124
Figure 38B: Ionic dissolution with MgO content after 7 days immersion in SBF. ... 125
Figure 38C: Ionic dissolution with MgO content after 14 days immersion in SBF. ... 125
Figure 39: Ionic dissolution of MgO glasses after 1 month immersion in SBF. ... 126
Figure 40: Ionic dissolution of MgO glasses in SBF with time 1-week. (QM5-7.8 mol%) (QM7-11 mol%) (QM6-16.8 mol%). ... 127
Figure 41: XRD patterns of QM8 (14 mol%) before and after immersion in SBF. ... 128
Figure 42: XRD patterns of QM9 (9 mol%) before and after immersion in SBF. ... 129
Figure 43: FTIR spectra of QM8 (14 mol%) before and after immersion in SBF. ... 130
Figure 44: FTIR spectra of QM9 (9 mol %) before and after immersion in SBF. ... 130
Figure 45: XRD patterns of glass powder and coating QM8 (14 mol%) and HA. ... 132
Figure 46: Optical views of QM8 (14 mol %) glass coating. ... 132
Figure 47: FTIR spectra of the initial glass powder and glass coating-QM8 (14 mol %). .... 133
Figure 48: SEM image of the coating surface-QM8 (14 mol%). . ... 134
Figure 49: SEM micrograph and associated line scan analysis across the coating surface-QM8(14 mol%). ... 135
Figure 50: SEM micrograph of the glass-metal interface (IF)-(QM8-14%),G: (glass). ... 136
Figure 51: SEM micrograph and associated line scan analysis of the glass-metal interface (IF)-(QM8-14 mol%). ... 137
Figure 52: XRD patterns of pure Ti disk and detached glass coating sample-QM8(14 mol %). ... 138
Figure 53: pH variation of (A) Tris-buffer and (B) SBF with soaking time ... 139
Figure 54: Ionic dissolution of glass coatings with MgO content in Tris-buffer solution. ... 140
Figure 55: Ionic dissolution of glass coatings with MgO content in SBF. ... 141
Figure 56: XRD patterns of QM8 (14 mol%) glass coating before and after immersion... 141
Figure 57: FTIR spectra of QM8(14 mol%) before and after 1 month immersion. ... 142
Figure 58: Backscattered and associated line scan across the glass-metal interface after immersion in Tris-buffer solution- QM8(14 mol%). ... 143
Figure 59: Backscattered images of glass-metal interface before (A) and after (B) immersion in SBF. ... 144
14
Figure 60: Backscattered and associated line scan across the glass-metal interface after 1
month immersion in SBF showing Ca-P rich layer. ... 145
Figure 61: XRD patterns of CaF2 glass series for different mol % CaF2 contents. ... 168
Figure 62: Effect of CaF2 on glass transition temperature (Tg). ... 169
Figure 63A: Effect of CaF2 on peak crystallization temperature (Tp). ... 169
Figure 63B: Effect of CaF2 on sintering window. ... 170
Figure 64: DSC plots of (A) QM8 (0 mol %) and (B) MQM8 (9.11 mol %). ... 171
Figure 65: Effect of different heating rates on peak crystallization-MQM8 (9.11 mol%). .... 172
Figure 66: Samples of activation energy plot as determined by Marotta method for Tg(A) and Tpcon (B) of MQM8 (9.11 mol%). ... 173
Figure 67: Effect of particle size on peak crystallization (A) QM8 (0 mol%) and (B) MQM8 (4.7 mol%). ... 175
Figure 68: Effect of particle sizes on peak crystallization of CaF2 glasses. ... 175
Figure 69: Effect of CaF2 content on glass transition temperature (Tg)( ) and softening temperature (Ts)( ). ... 176
Figure 70: Effect of CaF2 on Tg obtained from DSC () and dilatometry (). ... 176
Figure 71: Effect of CaF2 on thermal expansion coefficient (TEC). ... 177
Figure 72: Effect of CaF2 on bulk glass density. ... 177
Figure 73 : pH variation of (A) Tris-buffer solution and (B)SBF with soaking time. ... 178
Figure 75: Fluoride release in (A) Tris-buffer solution and (B) SBF with CaF2 content-1 week. ... 180
Figure 76: Fluoride release in () Tris-buffer and () SBF with CaF2 content-1 month. .... 180
Figure 77: Ionic dissolution of fluoride in SBF with immersion time (7&30 days). ... 181
Figure 78: Ionic dissolution of CaF2 glasses in Tris-buffer solution with CaF2 content-1 week.. ... 182
Figure 79: Ionic dissolution of CaF2 glasses in Tris-buffer solution with CaF2 content based on normalised values-1 week... 183
Figure 80: Ionic dissolution of CaF2 glass series in SBF with CaF2 content (A) 1-week and (B) 1 month. . ... 184
Figure 81: Ionic dissolution of CaF2 glasses in Tris-buffer solution based on normalised values-1 month. . ... 185
Figure 82: Ionic dissolution of CaF2 glasses in Tris-buffer solution with soaking time. ... 186
Figure 83: XRD patterns of MQM8 (9.11 mol%) before and after immersion in (A)Tris-buffer solution and (B)SBF. ... 187
Figure 84: FTIR spectra of MQM8 (9.11 mol%) before and after immersion in (A)Tris-buffer solution and (B)SBF. ... 189
Figure 85: XRD patterns of glass powder and glass coating of (A) MQM8 (2.4 mol%) and (B) MQM8 (9.11 mol%) compared with diffraction peaks of FA. ... 191
Figure 86: XRD patterns of the glass powder and coating fabricated at different firing parameters. (A) MQM8(11.5 mol%) and(B) MQM8(13 mol%) coatings compared with FA. 192 Figure 87: FTIR spectra of the glass powder and coating of (A) MQM8 (2.44 mol%) and (B) MQM8(9.11 mol%). ... 194
15
Figure 88: FTIR spectra of MQM8 (13 mol%) glass coating at different firing parameters. 195 Figure 89: SEM micrograph of glass coating surface-MQM8 (2.4)%. C- Cracks, P- Pores 195 Figure 90: SEM micrograph and associated line scan analysis of glass coating
surface-MQM8 (2.4 mol%). ... 196
Figure 91: Backscattered images of the glass-metal interface-MQM8 (2.4 mol%). ... 197
Figure 92: Cross section and associated line scan analysis of glass-metal interface-MQM8 (2.4% mol). ... 198
Figure 93: XRD patterns of pure titanium disk and detached glass coating-MQM8 (9.11 mol%). ... 199
Figure 94: pH variation of (A) Tris-buffer solution and (B) SBF of MQM8 (-2.4 mol%) & ( -11.9 mol%) with soaking time. ... 200
Figure 95: The effect of CaF2 on fluoride released in () Tris-buffer solution and () SBF. ... 201
Figure 96: Ionic dissolution of CaF2 glass coatings with CaF2 content in (A)Tris-buffer solution and(B) SBF. ... 202
Figure 97: XRD patterns of glass coatings (A) MQM8 (2.4 mol%) and (B) MQM8 (9.11 mol%) before and after immersion in Tris-buffer and SBF. ... 204
Figure 98: FTIR spectra of glass coatings (A) MQM8 (2.4 mol%) and (B) MQM8 (9.11 mol%) before and after immersion in Tris-buffer solution and SBF. ... 205
Figure 99: Backscattered images of glass-metal interface before (A) and after (B) immersion in SBF- MQM8(2.4 mol%). ... 206
Figure 100: Cross section and associated line profile analysis of glass coating-MQM8 (2.4 mol%) after 1 month immersion in SBF showing SiO2-gel layer. ... 207
Figure 101: Backscattered images of glass-metal interface before (A) and after (B) immersion in SBF- MQM8 (9.11 mol%). ... 208
Figure 102: Cross section and associated line scan analyses of glass-metal interface of glass coating MQM8 (9.11 mol%) showing a Ca-P layer after 1 month immersion in SBF. 209 Figure 103: XRD diffraction patterns of MgF2 glasses with different MgO content (mol%). 224 Figure 104: EfFigure 104: Effect of MgO content on Tg of MgF2 glasses () and MgO series (). ... 225
Figure 105: Effect of MgO content on peak crystallization of MgF2 () and MgO () series. ... 226
Figure 106: DSC plots of QM7 (11 mol%) and QMF7(13.13 mol%). ... 227
FFigure 107: Effect of different heating rates on peak crystallization-QMF9 (11.13 mol%). 228 Figure 108: Samples of activation energy (Ea) plot for Tg and Tpcon –QMF7- (13.13 mol%). 229 Figure 109: Effect of particle sizes on peak crystallization-QMF5 (9.93 mol%). ... 230
Figure 110: Effect of particle sizes on peak crystallization of MgF2 glasses. ... 231
Figure 111: Effect of MgO on Tg() and Ts(). ... 232
Figure 112: Effect of MgO on the Tg obtained from dilatometry () and DSC (). ... 232
Figure 113: Effect of MgO on the dilatometry Tg of MgF2 () and MgO series (). ... 233
Figure 114: Experimental TEC of MgF2 () and MgO glasses () as a function of MgO content (100-500 oC). ... 234
16
Figure 115: Effect of MgO on the glass density of MgF2 () and MgO () series. ... 234 Figure 116: pH changes with immersion time (A)Tris-buffer solution and (B)SBF- 1 week. 236 Figure 117: pH changes of SBF as a function of MgO content /1 week. ... 237 Figure 118: pH changes of SBF with soaking time-1 month. ... 238 Figure 119: Ionic dissolution of fluoride with MgO content in (A) Tris-buffer solution and (B) SBF/1 week. ... 239 Figure 120: Ionic dissolution of fluoride with MgO content in Tris-buffer solution () and SBF ()/ 1 month. ... 240 Figure 121: Fluoride dissolution in (A) Tris-buffer solution and (B) SBF with soaking time (7 & 30). ... 241 Figure 122: Fluoride dissolution in SBF with soaking time (3 & 7) days. ... 241 Figure 123: Ionic dissolution of MgF2 glasses in Tris-buffer solution with MgO content-1 week. ... 242 Figure 124: Ionic dissolution of MgF2 glasses with MgO content after 1 week immersion in Tris-buffer solution based on normalised values. ... 243 Figure 125: Changes in elemental concentrations of SBF due to soaking of MgF2 glass series after 3&7 days. ... 244 Figure 126: Changes in elemental concentrations of SBF due to soaking of MgF2 series after 7&30 days. ... 245 Figure 127: XRD patters of QMF8 (16.13 mol%) before and after immersion in SBF at different time points. ... 246 Figure 128: XRD patterns of QMF6 (18.93 mol%) before and after 7&30 days immersion in SBF. ... 247 Figure 129: FTIR spectra of QMF8 (16.13 mol%) before and after immersion in SBF at different time points. ... 248 Figure 130: FTIR spectra of QMF6 (18.93 mol%) before and after 7&30 days immersion in SBF. ... 249 Figure 131: XRD patterns of the initial glass powder, glass coating (QMF7-13.13 mol%) and FA crystals... 250 Figure 132: Optical appearance of QMF7 (13.13 mol%) glass coating at high magnification. ... 250 Figure 133: FTIR spectra of the initial glass powder and glass coating QMF7-(13.13 mol%). ... 251 Figure 134: SEM micrograph of glass coating surface-QMF7(13.13 mol%). ... 252 Figure 135: Backscattered images of the glass-metal interface-(QMF7-13.13 mol%). ... 253 Figure 136: Cross section and associated EDS line scan analysis of a glass-metal interface of glass coating QMF7(13.13 mol%) . ... 254 Figure 137: XRD patterns of pure titanium disk and detached coating QMF8 (16.13 mol%). ... 255 Figure 138: XRD patterns of the inner surface of the glass coating QMF8 (16.13 mol%) showing TiO2 diffraction peaks. ... 255 Figure 139: pH changes of (A)Tris-buffer solution and (B)SBF with immersion time. ... 257
17
Figure 140: Fluoride dissolution of glass coating in Tris-buffer solution () and SBF() with MgO content-1 month. ... 258 Figure 141: Ionic dissolution of MgF2 glass coatings in Tris-buffer solution (A) and SBF(B) after 1 month immersion as a function of MgO content. ... 259 Figure 142A: XRD patterns of QMF7(13.13 mol%) before and after immersion in Tris-buffer solution and SBF- 1 month... 260 Figure 142B: XRD patterns of QMF11 (22.13 mol%) before and after immersion in Tris-buffer solution and SBF-1 month... 260 Figure 143A: FTIR spectra of QMF7-13.13 mol% before and after immersion in Tris-buffer and SBF- 1 month. ... 261 Figure 143B: FTIR spectra of QMF11-22.13 mol% before and after immersion in Tris-buffer and SBF- 1 month. ... 262 Figure 144: Backscattered images of the glass-metal interface of glass coating QMF7(13.13 mol%) before(A) and after(B) immersion in Tris-buffer solution. ... 263 Figure145: Cross section and associated EDS line profile analysis for a glass QMF7(13.13 mol%) coating after 1 month immersion in Tris-buffer solution... 264 Figure 146: Cross section and associated EDS line profile analysis for a glass QMF7(13.13 mol%) coating after 1 month immersion in SBF... 265 Figure 147: XRD patterns of the initial glass, QMF5 (9.93 mol%)-FA composite with different FA ratios and pure FA. ... 281 Figure 148: FTIR spectra of the initial glass, QMF5 (9.93 mol%)-FA composite and pure FA. ... 282 Figure 149: pH changes of Tris-buffer solution with time-1 week immersion- (4:1) series. . 283 Figure 150: pH changes of Tris-buffer solution with time-3 days: A)4:1 series and B)14:1 series. ... 284 Figure 151: Ionic released of fluoride after 1 week immersion with MgO content (4:1). ... 285 Figure 152: Ionic released of fluoride after 3 days immersion with MgO content (14:1). .... 286 Figure 153: Ionic released of fluoride after 3 and 7 days immersion with time-(4:1). ... 286 Figure 154: Ionic dissolution of FA(4:1) containing composites with MgO content after 7 days immersion in Tris-buffer solution. ... 287 Figure 155: Ionic dissolution of FA(14:1) containing composites with MgO content after 3 days immersion in Tris-buffer solution. ... 288 Figure 156: Ionic dissolution of the high FA(4:1) containing composites with time after 3 & 7 days immersion in Tris-buffer solution. ... 289 Figure157: XRD patterns of the initial and immersed composite powder at different time points, A) QMF5 (9.93%)-FA; B) QMF11 (22.13%)-FA(4:1). ... 290 Figure 158: XRD patterns of QMF5 (9.93 mol%) and composite QMF5-FA(4:1) before and after 7 days immersion in Tris-buffer solution. ... 291 Figure 159: XRD patterns of QMF11 (22.13 mol%) and composite QMF11-FA(4:1) before and after 7 days immersion in Tris-buffer solution. ... 291
18
Figure 160: XRD patterns of the initial and immersed composite powder after 3 days immersion in Tris-buffer solution (A) QMF5 (9.93%)-FA(14:1) and(B) QMF(22.13%)-FA(14:1). ... 292 Figure 161: FTIR spectra of the initial and immersed composite powder at different time points, A)QMF5 (9.93%)-FA and B) QMF11(22.13%)-FA(4:1). ... 294 Figure 162: FTIR spectra of the initial and immersed composite powder after 3 days immersion in Tris-buffer solution (A) QMF5(9.93%)-FA(14:1) and (B)QMF11(22.13%)-FA(14:1). ... 295 Figure 163: XRD patterns of the initial composite powder and coating of the QMF8(16.13 mol%)-FA(4:1). ... 296 Figure 164: XRD patterns of the initial composite powder and coating of the QMF8(16.13 mol%)-FA(14:1). ... 296 Figure 165: FTIR spectra of the initial composite powder and coating-QMF8(16.13 mol%)-FA(4:1). ... 297 Figure 166: FTIR spectra of the initial composite powder and glass coating-QMF8(16.13 mol%)-FA(14:1). ... 298 Figure 167: Optical appearance of composite coating-QMF11(22.13 mol%)-FA(4:1)-left and QMF8 (16.13 mol%)-FA (14:1)-right. ... 298 Figure 168: SEM micrograph of the composite coating surface-QMF11-FA(22.13%)-FA(4:1). ... 299 Figure 169: SEM of the coating surface and associated EDS line profile analysis for a composite coating QMF11(22.13%)-FA(4:1). ... 300 Figure 170: SEM micrograph of the coating surface-QMF8-FA(16.13%)-FA(14:1). ... 301 Figure 171: SEM micrograph of the coating surface and associated EDS line profile analysis for a composite coating QMF8(16.13 mol%)-FA(14:1). ... 302 Figure 172: Backscattered images of the glass-metal interface-QMF11(22.13%)-FA(4:1). 303 Figure 173: Cross section and associated EDS line profile analysis for composite coating QMF11 (22.13%)-FA(4:1). . ... 304 Figure 174: Backscattered images of the composite-metal interface-QMF8(16.13 mol%)-FA(14:1). ... 305 Figure 175: Cross section and associated EDS line profile analysis for composite coating QMF8(16.13%)-FA(14:1). ... 306 Figure 176: XRD patterns of pure titanium disk and detached composite coating QMF8 (16.135%)-FA showing diffraction peaks of TiSi layer ... 307 Figure 177: XRD patterns of composite coatings QMF11-FA(4:1) and QMF8-FA(14:1) /inner surface showing diffraction peaks of TiO2 layer... 308 Figure 178: pH changes of Tris-buffer solution with time of the low FA (14:1) containing composite coating- 1 month immersion. ... 309 Figure 179: pH changes of SBF with time of the high FA (4:1) containing composite coating- 1 month immersion. ... 310 Figure 180: Ionic released of fluoride in Tris-buffer solution with MgO content of the high(4:1) FA containing composite coating. ... 310
19
Figure 181: Ionic released of fluoride in SBF with MgO content of the low(14:1) FA containing composite coating. ... 311 Figure 182: Ionic dissolution of high FA(4:1) containing composite coatings in Tris-buffer solution with MgO content. ... 312 Figure 183: Ionic dissolution of low FA (14:1) containing composite coatings in Tris-buffer solution with MgO content. ... 312 Figure 184: Ionic dissolution of high FA(4:1) containing composite coatings in SBF with MgO content... 313 Figure185: Ionic dissolution of low FA (14:1) containing composite coatings in SBF with MgO content... 314 Figure 186: XRD diffraction patterns of the initial and immersed composite coating A) QMF8 (16.13%)-FA and B) QMF11 (22.13%)-FA(4:1). ... 315 Figure 187: XRD diffraction patterns of the initial and immersed composite coating A)QMF8 (16.13%)-FA(14:1) and B) QMF11(22.13%)-FA(14:1). ... 316 Figure 188: FTIR spectra of the initial and immersed composite coating A) QMF8 (16.13%)-FA- and B) QMF11 (22.13%)-FA(4:1). ... 318 Figure 189: FTIR spectra of the initial and immersed composite coating A) QMF8 (16.13%)-FA and B) QMF11 (22.13%)-(16.13%)-FA(14:1). ... 319 Figure 190: SEM micrographs of the composite coating QMF8(16.13%)-FA(4:1) before(A) and after (B) immersion in Tris-buffer solution. ... 320 Figure 191: Cross section and associated EDS line profile analysis for a glass QMF8(16.13%)-FA(4:1) coating after 1 month immersion in Tris-buffer solution. ... 321 Figure 192: SEM micrographs of the composite coating QMF11(22.13%)-FA(14:1) before and after immersion in Tris-buffer solution. ... 322 Figure 193: Cross section and associated EDS line profile analysis for a composite QMF11(22.13%)-FA(14:1) coating after 1 month immersion in Tris-buffer solution. ... 323 Figure 194: Cross section and associated EDS line profile analysis for a composite QMF8(16.13%)-FA(4:1) coating after 1 month immersion in SBF. ... 325 Figure 195: SEM micrographs of the composite coating QMF8(16.13%)-FA(14:1) before(A) and after(B) SBF immersion-1 month. ... 326 Figure 196: Cross section and associated EDS line profile analysis for a composite QMF8(16.13%)-FA(14:1) coating after 1 month immersion in SBF. ... 327 Figure 197: Mechanism of growing apatite on the initial FA phases in Tris-buffer solution. 332 Figure 198: SEM micrographs of (A) osteoblast-like cells and (B) fibroblast cells attached to glass coating QM5 (7.8 mol%) after 5 days in culture. ... 349 ... 350 Figure 199: (A) SEM micrograph of glass coating QM11(20 mol%) after 5 days culturing osteoblast and (B) osteoblast-like cells growing on plastic containing disk after 5 days in culture well containing the same glass coating. ... 350 Figure 200: SEM micrographs of osteoblast-like cells attached to glass coating MQM8 (9.11 mol%) (A) at low and (B) higher magnification... 351
20
Figure 201: (A) SEM micrographs of glass coating MQM8 (9.11 mol%) after 3 days culturing with fibroblast cells and (B) fibroblast cells growing on polystyrene plastic dish containing disk. ... 351 Figure 202: SEM micrographs of (A) osteoblast-like cells and (B) fibroblast cells attached to glass coating QMF8 (16.13 mol%). ... 352 Figure 203: SEM micrographs of (A) osteoblast-like cells and (B) fibroblast attached to composite coating QMF8 (16.13%)-FA(4:1) after 5 days in culture... 353 Figure 204: SEM micrographs of osteoblast-like cells attached to composite coating QMF5(9.93%)-FA(14:1) after (A) 2 days (B) 5 days (C) 10 days and (D) 14 days in culture. ... 355 Figure 205: (A&C) SEM micrograph of bone nodules formed on the glass coating QMF7 (13.13 mol%) and uncoated Ti disk after 5 weeks culturing in mineralised medium. (B&D) light microscopic views of mineralization by Alizarin Red S staining: mineralised bone nodules showed dark red staining. ... 356 Figure 206: (A) Light microscopy images showing ALP activity of osteoblast cells on glass coating QMF7(13.13 mol%) (B) control-coating-free cells (the glass coating does not have cells to convert stain to an insulble precipitate). ... 358 Figure 207: ALP activity of high FA series (4:1) and uncoated Ti disk at different time points. ... 359
21
List of Tables
Table1: Ablative techniques of modifying titanium implant surfaces. ... 38 Table 2: Additive techniques of modifying titanium implant surfaces with calcium phosphate. ... 41 Table 3: Chemical composition of glass series (mol%). ... 89 Table 4: Showing coating parameters, adhesion status, sintering window (Tpcon-Tg) and optical appearance of glass and glass/FA composites. ... 95 Table 5: Chemical composition of human blood plasma and (SBF) mM. ... 96 Table 6: Thermal analysis of MgO glasses compared with 45S5 and ICIE glasses. ... 106 Table 7: Chemical composition of 45S5 and ICIE16 glasses (mol%). ... 106 Table 8: TEC of MgO glass series compared with Tomsia’s (6P57) and 45S5 glasses...…112 Table 9: Calculated values of Ca, Mg, P,Si of MgO glasses assuming that 100% of glasses dissolved in Tris-buffer solution. . ... 116 Table 10: Extrapolated values and thermal analyses of QM8 (0) and MQM8 (9.11)mol%. 174 Table 11: Calculated values of Si,Ca, Mg, P assuming that 100% of glass dissolved in 50 ml solution.. ... 182 Table 12: Sintering windows of MgF2 and MgO glasses. ... 227 Table 13: Thermal properties of QM7 (11 mol%) and QMF7 (13.13 mol%) MgO glasses. . 230 Table 14: Calculated values of Si,Ca, Mg,P assuming that 100% of glass dissolved in 50 ml solution (p.p.m). ... 242 Table 15: summery of bioactivity and biocompatibility of glass/composite coatings ... 373
22
1. Introduction and background
1.1 Introduction
In the past 20 years, surgical placement of dental implants has increased steadily worldwide, reaching about one million dental implants per year (Le Guehennec et al., 2007). Dental implants can be used to substitute missing tooth or teeth for many reasons, such as congenital anodontia, trauma, cancer, failed root canal treatment, carious roots and chronic periodontitis (Gassner et al., 2000; Gurlek et al., 1998; McMillan et al., 1998).
The clinical success of dental implants is attributed to the osseo-integration process. According to Branemark, 1996 osseo-integration can be defined as “the close apposition of new and reformed bone in congruence with the fixture, so that there is no interposition of connective or fibrous tissue at the light microscopic level”. This phenomenon depends on biological process of bone regeneration to obtain implant stability after abutment placement (Berglundh et al., 2003). A number of studies showed that the success rates of oral implant treatment are high (Behneke et al., 2000; Romanos and Nentwig, 2000; Khayat et al., 2001, Mordenfeld et al., 2004; Jemt, 2008). It was found that the 5-year survival rates of dental implants replacing single missing tooth is 95.6%; whereas for the implants replacing a group of teeth as fixed prostheses is about 97.7 % (Pow and Leung, 2008). Although success rates of dental implants are high, failures still do occur (Patrick, 2008). Failure may be classified as early or late. Early failure occurs before establishment of osseo-integration and prosthetic placement, late failure occurs after prosthetic replacement (Albrektsson et al., 1986). Factors, such as systemic diseases and medications may interfere with the regeneration process of dental implants (Gruber et al., 2006; Mombelli and Cionca, 2006, Alsaadi et al., 2008) and contribute to implant failure.
The most common constituent of dental implants are commercially pure titanium and titanium alloy. Titanium has excellent corrosion resistance and physical properties (Faria et al., 2008). It could exhibit proper biocompatibility and almost certain osseo-integration (Branemark, 1969; Pohler, 2000). It is thought that the biocompatibility of titanium is attributed to the formation of a surface titanium oxide layer (Moritz et al., 2004). However, still the ability of
23
pure titanium to integrate with host bone and to induce blood vessels proliferation is insufficient.
The quality of titanium dental implants depends on chemical, physical, mechanical and topographical features of the surface (Grassi et al., 2006). The first generation of successful titanium dental implant, which have been in clinical use for almost 50 years, are machined with a smooth surface topography. Since then, the importance of implant surfaces has been recognised to play a pivotal role in biological process, such as cellular behaviour, molecular interaction and bone-integration. The second generation has been developed with modified surfaces to improve and speed up bone-implant integration. This, in turn, improves implant stability during healing process and implant performance in a region of poor bone quality and quantity. Hence, this development may permit the application of early or immediate implants loading protocol.
1.2 Attempts of coating titanium implant thermally with bioactive materials: Back ground
Several methods have been developed to modify the surface of dental implants in order to improve its bone-bonding ability. Coating titanium implants with plasma sprayed HA is one of these methods (Kong et al., 2002). The implants coated by such a method have a rapid integration rate and enhance and direct bone attachment compared to non-coated implants (Baltag et al., 2000).
However, it has been shown that the stability of the coating produced by plasma spraying is weak, the coating may undergo cracking and loss of adhesion during heat treatment (Gross et al., 1998), and this technique is unsuitable for more complex shapes (Gomez et al., 1999). These drawbacks may be associated with porosity and coating thickness, thermal expansion mismatching of HA (13.3X10⁻⁶ /oC) (Chern Lin et al., 1994) and titanium (9.4-10.3 x10⁻⁶ /oC), weak interfacial bonding and the low dissolution process of HA particles (Sun et al., 2001). Activation of osteoclast cells by HA particles and subsequent bone resorption has been observed as well (Sun et al., 1999).
An alternative approach is by coating titanium implants with bioactive glasses. These glasses when exposed to biological environments undergo chemical reactions and form HA on their surfaces, which is similar to
24
biological apatite in bone, thus forming chemical bonds with bone (Pajamaki et al., 1995). In addition, some bioactive glasses not only bond with bone, but also with soft tissues (Hench, 1998). The reaction of bioactive glasses to body tissues is very fast (within hours) compared to HA, which reacts very slowly and bonds with bone only (Schrooten et al., 1999). It has been shown that coatings made of bioactive glasses are more resistant to suppuration in infected site compared to HA coatings; due to the alkaline medium produced by these glasses (Mistry et al., 2011).
Coating a titanium substrate with bioactive glasses has two advantages: to improve bone-implant adhesion and to protect the metallic substrates from corrosion (Hench and Andersson, 1993; Sousa and Barbosa, 1991, 1995, 1996). However, coating titanium substrate with Bioglass® using plasma spray technique was unsuccessful; due to a poor glass-metal interface and a rapid degradability of this glass when exposed to body fluid (Hench and Anderson, 1993). The weak glass-metal adhesion is attributed to the low silica content and the high TEC (14-15x10-6 /oC) of Bioglass® (Krajewski et al., 1985) compared to titanium and titanium alloy (9.4-10.3x10⁻⁶ /oC). Besides, Gomez and co-workers, 2000 stated that the formation of a thin silicide layer at the glass-metal interface could be another cause of coating failure. Further attempts to coat titanium implants with Bioglass® by an enamelling route also failed, because the glass crystallized during thermal treatment and as a result the coating detached from the underlying substrate (Pazo et al., 1998A; 1998B).
Many studies identified the importance of TEC (Pazo et al., 1998A; Gomez et al., 1999 and 2000; Lopez et al., 2003) during coating. Therefore, efforts have been made to tailor the TEC of bioactive glasses to that of titanium. Increasing the concentration of SiO2 or adding B2O3 to the glass composition
is one of these approaches (Pazo et al., 1998B; ElBatal et al., 2003). The major drawbacks of increasing SiO2 content is that glass bioactivity
decreases, and the melting temperature increases. Mechanical strength and glass stability can be affected by adding B2O3 to glass composition (ElBatal
et al., 2003).
Other attempts were made by partial substitution of MgO and K2O for CaO
and Na2O (Pazo et al., 1998A&B; Gomez et al., 1999 and 2000; Lopez et al.,
25
than that of the latter oxides. However, it has been stated that the rate of apatite formation in simulated body fluid decreases with increasing MgO content in CaO-SiO2 glass (Ebisawa et al., 1990).
In order to maintain the bioactivity after partial substitution of MgO for CaO, particles of HA and Bioglass® were incorporated into bioactive glass coating (Gomez et al., 2000). A multi-layer approach (Gomez et al., 1999) and a double-layer glass ceramic (Verne et al., 2004; Kim and Lee, 2005) coatings were also attempted to coat titanium implant. The composition of the inner layer is tailored to match TEC of the titanium substrate and to facilitate adhesion of the outer bioactive layer. However, this technique would be costly and more complicated.
1.3 Structure of the thesis:
This thesis is organised in a conventional way: following the introduction (Chapter 1), clinical and biomaterial background of dental implants, bone and bone structure and glass and glass structure including bioactive glasses were analysed and criticised in the form of a literature review (Chapter 2). The materials and methods used during this research comprising Chapter 3. The results of glass series (powder and coatings) are analysed and discussed thoroughly in Chapters 4, 5, 6 and 7. The results of cell culture experiments are discussed in Chapter 8. The conclusion of this research is given in Chapter 9.
1.4 Hypothesis:
Bioactive glasses have high thermal expansion coefficient (TEC) and tend to crystallization during coating procedure. These glasses might lose or reduce their bioactivity after coating process. Altering the glass composition by adding or substituting compounds might tackle these problems. The hypothesis is that:
- Substitution of MgO for CaO, magnesium will decrease TEC and suppress crystallization from occurring.
- Addition of CaF2 will mantain and improve apatite forming ability of the
glass.
- Replacing MgF2 and MgO for ZnO will improve the thermal property
26
- Mixing FA crystals with glass will improve bioactivity of the glass.
1.5 Aims and objectives of the study:
The main aim of this study is to improve the quality and performance of titanium dental implant. This is important in situations, such as osteoporotic patients and irradiated jaws, where bone quality and quantity are insufficient to stabilise and support dental implants. Bioactive glass coating of dental implants can be an appropriate choice to achieve such a goal. Therefore, we attempt to develop a bioactive glass coating that has the following criteria:
A thermal expansion coefficient matching or close to that of titanium substrate.
A wide sintering window and can resist crystallization during coating process.
Form surface apatite with a short onset of time.
Biocompatible to osteoblast and fibroblast cells.
Has an osteoconductive and osteoinductive properties. In order to achieve the following aims:
To speed up osseo-integration process of dental implants.
To reduce the incidence of peri-implantitis.
To reduce the time required for loading after implantation.
27
2. Literature review
2.1Dental implant: 2.1.1 Overview:
A dental implant is a prosthetic devices made from alloplastic materials usually pure titanium or titanium alloy (Ti6Al4V). Dental implant can be inserted into the mandible or maxilla, beneath the mucosa and periosteum and within the bone to retain and support the fixed or removable prosthesis (Stellingsma et al., 2004).
Figure 1: Dental implant (endosteal type).
Dental implants consist of three components: the fixture which is inserted into the bone, the part carries the prosthesis is called the abutment and the prosthesis, which is either a fixed or removable prosthesis. Due to worldwide use of dental implants by dentists for replacing missing teeth both for partially or completely edentulous patients, there are a wide variety of dental implants. Most dental implants have different forms (Garefis, 1978) and shapes. Nevertheless, dental implants can be classified either according to geometrical forms into: fine, screw, cylinder, basket and root form. Or they could be categorised according to the fixture (body of the implant), since this part derives its support and stability from bone (Blacrom, 1999). In general dental implants can be categorised into: Endosteal, subperiosteal and transosteal implants.
28
Endosteal dental implants are the most common type used nowadays, Figure 1. These types are less invasive than other implants (e.g. transosteal dental implants), since it penetrates the upper cortical plate of the jaw. The implant body (fixture) usually is situated within the alveolar bone and/or the basal bone. The fixture of these types comes in different geometries such as cylinder, conical, screw or blade. Also it could be categorized as one-stage surgery or two-stage surgery. In the former, the implant is inserted in the jaw and projected into the oral cavity through oral mucosa. In contrast, in the latter, implants are placed surgically into the bone and covered by oral mucosa to facilitate healing process. After 4-6 months, the implant is uncovered and connected to the prosthesis.
Subperiosteal (eposteal) implants, also called non-ossointegrated design, since the metal frame (fixture) rests on the bone rather than inserts within the bone, Figure 2. The framework has a post pierces the mucosa to attach to the prosthesis. Ramus frame and intramucosal inserts are examples of the eposteal oral implant. The eposteal type is rarely used nowadays, due to introduction of new materials or techniques that overcome the drawbacks of this type. Disadvantages of subperiosteal implants include epithelial ingrowth, dehiscence of the implant, infection and parasthesia of the mental nerve (Garefis, 1978; Bodine, 1996).
Figure 2: Subperiosteal type.
Transosteal implants are more surgically invasive than other types, Figure 3. These are usually used in the mandible, and the implant part inserts through
29
the lower border of the mandible. It penetrates the full thickness of the bone through incision in submental region under general anaesthesia. There are two types of transosteal dental implants, either transmandibular implant system or staple bone implant (Blacrom, 1999). The staple form has a plate which fits against the lower border of the jaw. It is attached to the posts which penetrate the upper border of the jaw. The prosthesis is carried by these posts (Worthington, 1994).
Figure 3: Transosteal (transmandibular) type.
In general, dental implants can be categorised into: immediate which is implant placement before healing of extraction site; early means implant insertion 4-8 weeks after tooth extraction and late placement after completion of healing process (Pivodova et al., 2011). Regarding the healing time, still there is controversy about the time required for the implants to osseo-integrate (Gerds and Vogeler, 2005). The conventional protocol for loading of dental implants with prosthetic devices requires 6-months immobility for implants placed in the maxilla and 3-months for implants inserted in the lower jaw (Branemark et al., 1977). This period of implant immobility is to ensure the beginning of the healing time, which is necessary to establish secondary stability responsible for success of loaded-implants (Adell et al., 1981).
However, implant protocols have developed and the 2-stage approach is not the only choice of treatment. New concepts of implant loading include (Ostman, 2008):
30
Immediate loading: prosthesis is connected at the same time or within 24 hours of implant insertion.
Early loading: prosthesis is connected at a second stage surgery, less than classical loading protocol, within days or weeks.
Delayed loading: prosthesis is connected at a second stage surgery after a routine healing time of 3-6 months.
2.1.2 Failure of dental implants:
Success of dental implants is ascribed to the osseo-integration process. This term refers to direct contact between the implant surface and the living bone, so that there is no intervening soft tissue layer between them at the light microscopic level (Branemark, 1996). This process depends on mechanical support to obtain primary stability (Esposito et al., 1998A&B) and biological process of bone regeneration to achieve secondary stability (Berglundh et al., 2003).
Many studies reported that the success rate of dental implants of healthy people is high (95%) (Naert et al., 2000; Bahat, 2000; Karoussis and Bragger, 2004; Jemt, 2008). Moreover, Patrick, 2008 found that success rate of fixed supported dental implant prostheses was 95% after 5-years and 87% after 10-years respectively. However, failures still do occur, and is defined as” the inadequecy of the host tissue to establish or maintain osseo-integration “(Esposito et al., 1998 A).
Dental implant failure can be classified into early failure, when integration fails to occur or late failure, when the established osseo-integration is broken down after certain period of loading (Esposito et al., 1998A). There are many factors behind failure of dental implants. These factors may be associated with surgical procedure, implant design and patient-related factors. Patient-related factors can be further classified into microbiological, biomechanical and biological or local and systemic factors. The most suspected reason behind failure of a dental implant within 3 months of insertion is the tissues overheating during osteotomy (Hadi et al., 2011). If bone is heated to 47oC for 1 minute, the possibility of bone necrosis is very high. It is thought that the conditions under which surgical procedure is performed might have influence on success of dental implants.
31
There are many factors influencing the initial implant stability such as implant length, diameter, thread configuration and surface texture (Sennerby and Roose, 1998; Dos Santos et al., 2011). The texture of the surface is an important factor, as it influences the amount of bone deposited at the bone-implant interface (Cooper, 2000). Many studies showed that the rate of implant failure is higher in relatively smooth surfaces (Jemt and Lekholm,1995; Bahat,1992; Nevins and Langer,1993; Jemt,1994; Esposito et al., 1998B) compared with rough-implant surfaces (Albrektsson and Johansson, 2000;Lazzara et al.,1998;Grunder et al.,1999;Glauser et al., 2001). However, in an area of poor bone quantity, a combination of microscopic implant features and macroscopic level of implant design (profile of implant thread) may improve the stability of the implant-bone interface (Stanford, 1999).
It is generally agreed that implants placed in the maxilla have a higher failure rate compared to that inserted in the mandible (Esposito et al., 1998A; Buser et al., 1997 and Moy et al., 2005). In addition, the rate of implant loss in the posterior regions of upper and lower jaws is higher than that of anterior segment (Moy et al., 2005). These differences may be attributed to the quality of bone and the type of the load imposed on upper and lower implants (Esposito et al., 1998B). The low bone density and insufficient bone volume have a significant contribution to implant failure (Liddelow et al., 2011).
Infection is another possible cause of dental implant failure. Failure of dental implant is usually related to microflora that is associated with periodontitis. When the transition from gram positive aerobic bacteria to gram negative anaerobic bacteria is predominated, then occurrence of peri-implantitis and consequent failure of dental implants is more likely (Mombelli, 1999). Peri-implant mucositis is defined as an inflammatory lesion inhabits the oral mucosa, whereas peri-implantitis affects oral mucosa and the supporting bone (Lindhe and Meyle, 2008).
Occlusal overload is a biomechanical factor that may be associated with the late failure of implants. It has been shown that successful osseo-integrated dental implants underwent crestal bone loss when subjected to excessive occlusal stress (Adell et al., 1981; Cox and Zarb, 1987; Isidor, 1997). Dental implants differ from natural teeth in that they are lacking a periodontal ligament, which acts as a shock absorber and has mechanoreceptors.
32
Crestal bone could act as a fulcrum point for lever action when dental implants are subjected to a bending moment. Thus, susceptibility of crestal bone loss is high when a mechanical force is applied to oral implants. The detrimental effect of these forces is transmitted to the implant-bone interface via the material of the occlusal surfaces of implant supported prostheses (Skalak, 1983; 1985). Hence, excessive occlusal stresses could be reduced by using resilient elements within the prostheses to prevent late implant failure.
Age, gender and smoking are biological factors which may contribute to failure of dental implant. Op Heij et al., 2003 reported that dental implants can be compromised by jaw growth in young patients. Besides, it stated that advanced age is a possible cause of implant failure (Salonen et al., 1993). The effect of age might be associated with development of certain systemic diseases, such as osteoporosis. Gender by itself, on the other hand, has no effect on the implant outcome (Moy et al., 2005).
It is thought that smoking alters the inflammatory response, and promotes progression of periodontal disease (Akef et al., 1992). Recent research has indicated that peri-implantitis is frequently occurs in heavy smokers (Fransson et al., 2009). This might explain the low success rate of dental implant in smokers (80%) compared with non-smokers (91%) (Moy et al., 2005).
2.1.3 Outcome of dental implant in medically compromised patients: The influence of systemic conditions on the osseo-integration process is poorly documented (van Stenberghe et al., 2002). However, few studies indicated that systemic factors might contribute to implant failure (Alsaadi et al., 2007; Alsaadi et al., 2008; van stenberghe et al., 2002). Many literature indicated that conditions such as oral cancer, bisphosphonate, diabetic mellitus and osteoporosis have been considered as contraindications for dental implants (Oikarinen et al., 1995; Blanchaert, 1998; Fugazzotto, 1997). Therefore, a general view of the effect of these conditions on success of dental implant will now be discussed:
Oral cancer is usually treated by radiotherapy, chemotherapy and/or surgical ablation. After such treatments, patients are usually suffering from soft and hard tissue defects or deformity. Rehabilitation of oral defects by