Using neural networks and data mining techniques for the financial distress
prediction model
Wei-Sen Chen
*, Yin-Kuan Du
Industrial Technology Research Institute, #195, Sec. 4, Chung-Hsing Rd., Chutung 310, HsinChu, Taiwan, ROC
a r t i c l e
i n f o
Keywords:
Financial distress prediction model Artificial neural network Data mining
a b s t r a c t
The operating status of an enterprise is disclosed periodically in a financial statement. As a result, inves-tors usually only get information about the financial distress a company may be in after the formal finan-cial statement has been published. If company executives intentionally package finanfinan-cial statements with the purpose of hiding the actual status of the company, then investors will have even less chance of obtaining the real financial information. For example, a company can manipulate its current ratio by up to 200% so that its liquidity deficiency will not show up as a financial distress in the short run. To improve the accuracy of the financial distress prediction model, this paper adopted the operating rules of the Taiwan stock exchange corporation (TSEC) which were violated by those companies that were sub-sequently stopped and suspended, as the range of the analysis of this research. In addition, this paper also used financial ratios, other non-financial ratios, and factor analysis to extract adaptable variables. More-over, the artificial neural network (ANN) and data mining (DM) techniques were used to construct the financial distress prediction model. The empirical experiment with a total of 37 ratios and 68 listed com-panies as the initial samples obtained a satisfactory result, which testifies for the feasibility and validity of our proposed methods for the financial distress prediction of listed companies.
This paper makes four critical contributions: (1) The more factor analysis we used, the less accuracy we obtained by the ANN and DM approach. (2) The closer we get to the actual occurrence of financial dis-tress, the higher the accuracy we obtain, with an 82.14% correct percentage for two seasons prior to the occurrence of financial distress. (3) Our empirical results show that factor analysis increases the error of classifying companies that are in a financial crisis as normal companies. (4) By developing a financial distress prediction model, the ANN approach obtains better prediction accuracy than the DM clustering approach. Therefore, this paper proposes that the artificial intelligent (AI) approach could be a more suit-able methodology than traditional statistics for predicting the potential financial distress of a company. Crown CopyrightÓ2008 Published by Elsevier Ltd. All rights reserved.
1. Introduction
In Taiwan, domestic and foreign capital markets have developed rapidly in recent years, gradually giving people the idea of making a financial investment. There are various financial investment objects, such as stocks, futures, options, bond funds etc., and investment stock is the most widely accepted in society. However, capital markets are volatile, and most investors only know that a company is in financial trouble after the financial statement of the company has been made public. Therefore, forecasting corporate financial distress plays an increasingly important role in today’s society since it has a significant impact on lending deci-sions and the profitability of financial institutions. The ability to make accurate bankruptcy predictions are of critical importance
to various professionals, such as bank loan officers, creditors, stockholders, bondholders, financial analysts, governmental offi-cials, as well as the general public, as it provides them with timely warnings (Ko & Lin, 2006).
Financial failure occurs when a firm suffers chronic and serious losses or when the firm becomes insolvent with liabilities that are disproportionate to its assets (Hua, Wang, Xu, Zhang, & Liang, 2007). Common causes and symptoms of financial failure include lack of financial knowledge, failure to set capital plans, poor debt management, inadequate protection against unforeseen events and difficulties in adhering to proper operating discipline in the financial market. The common assumption underlying bankruptcy prediction is that a firm’s financial statements appropriately reflect above characteristics. Several classification techniques have been suggested to predict financial distress using ratios and data originating from these financial statements, e.g., univariate approaches (Beaver, 1966), multivariate approaches, linear multiple 0957-4174/$ - see front matter Crown CopyrightÓ2008 Published by Elsevier Ltd. All rights reserved.
doi:10.1016/j.eswa.2008.03.020
* Corresponding author. Tel.: +886 3 5820100; fax: +886 3 5610616. E-mail address:[email protected](W.-S. Chen).
Contents lists available atScienceDirect
Expert Systems with Applications
j o u r n a l h o m e p a g e : w w w . e l s e v i e r . c o m / l o c a t e / e s w adiscriminant approaches (MDA) (Altman, 1968; Altman, Edward, Haldeman, & Narayanan, 1977), multiple regression (Meyer & Pifer, 1970), logistic regression (Dimitras, Zanakis, & Zopounidis, 1996), factor analysis (Blum, 1974), and stepwise (Laitinen & Laitinen, 2000). However, strict assumptions of traditional statistics such as linearity, normality, independence among predictor variables and pre-existing functional form relating to the criterion variable and the predictor variable limit their application in the real world (Hua et al., 2007).
With radical changes taking place in corporate finance and the global economic environment, critical financial ratios can change dynamically (John & Robert, 2001). This means that it is both important as well as necessary to develop an evolutionary ap-proach for coping with future dynamic financial environments. Therefore, this paper proposes a model of financial distress predic-tion integrating artificial neural network (ANN) and data mining (DM) techniques. The main objectives of this paper are to (1) adopt ANN and DM techniques to construct a financial distress prediction model, (2) use financial and non-financial ratios to enhance the accuracy of the financial distress prediction model, (3) employ a traditional statistical method (factor analysis) to compare the de-gree of accuracy with that of the artificial intelligent (AI) approach, and (4) to expand this model so that it will work within a financial distress prediction system to provide information to investors as well as investment monitoring organizations. The data for our experiment were collected from the Taiwan stock exchange corpo-ration (TSEC) database.
The rest of this paper is organized as follows. A literature review of related studies is provided in Section2. Section3describes our proposed approach and the functionalities of each process. Section
4presents the process for selecting suitable indicators by factor analysis. To prove the prediction performance of our approach, we carried out several experiments which are described in Section
5. In Section6, we compared our results with the ANN, and DM ap-proaches. Finally, in Section 7 we draw our conclusions about financial distress forecasting and discuss future work.
2. Literature review 2.1. Artificial neural network
The ANN is composed of richly interconnected non-linear nodes that communicate in parallel. The connection weights are modifi-able, allowing ANN to learn directly from examples without requir-ing or providrequir-ing an analytical solution to the problem. The most popular forms of learning are:
Supervised learning: Patterns for which both their inputs and outputs are known are presented to the ANN. The task of the supervised learner is to predict the value of the function for any valid input object after having seen a number of training examples. ANN employing supervised learning has been widely utilized for the solution of function approximation and classifi-cation problems.
Unsupervised learning: Patterns are presented to the ANN in the form of feature values. It is distinguished from supervised learn-ing by the fact that there is noapriori output. ANN employing unsupervised learning has been successfully employed for data mining and classification tasks. The self-organizing map (SOM) and adaptive resonance theory (ART) constitutes the most pop-ular exemplar of this class.
A back-propagation network (BPN) is a neural network that uses a supervised learning method and feed-forward architecture. A BPN is one of the most frequently utilized neural network
tech-niques for classification and prediction (Wu, Yang, & Liang, 2006), and is considered an advanced multiple regression analysis that can accommodate complex and non-linear data relationships (Jost, 1993). It was first described byWerbos (1974), and further devel-oped byRonald, Rumelhart, and Hinton (1986). The details for the back-propagation learning algorithm can be found inMedsker and Liebowitz (1994).
Fig. 1shows thelmn(ldenotes input neurons,mdenotes hidden neurons, andndenotes output neurons) architecture of a BPN model (Panda, Chakraborty, & Pal, 2007). The input layer can be considered the model stimuli and the output layer the input stimuli outcome. The hidden layer determines the mapping rela-tionships between input and output layers, whereas the relation-ships between neurons are stored as weights of the connecting links. The input signals are modified by the interconnection weight, known as weight factorwji, which represents the intercon-nection of theith node of the first layer to the jth node of the second layer. The sum of the modified signals (total activation) is then modified by a sigmoid transfer function (f). Similarly, the out-put signals of the hidden layer are modified by interconnection weightwkjof thekth node of the output layer to thejth node of the hidden layer. The sum of the modified signals is then modified by sigmoid transfer (f) function and the output is collected at the output layer.
LetIp= (Ip1,Ip2,. . .,Ipl),p= 1,2,. . .,Nbe thepth pattern amongN input patterns. Wherewjiandwkjare connection weights between the ith input neuron to the jth hidden neuron, and the jth hidden neuron to the kth output neuron, respectively (Panda et al., 2007).
Output from a neuron in the input layer is
Opi¼Ipi; i¼1;2;. . .;l ð1Þ
Output from a neuron in the hidden layer is Opj¼fðNETpjÞ ¼f X1 i¼0 wjiopi ! ; j¼1;2;. . .;m ð2Þ
Output from a neuron in the output layer is Opk¼fðNETpkÞ ¼f Xm j¼0 wkjopj ! ; k¼1;2;. . .;n ð3Þ
Wheref( ) is the sigmoid transfer function given byf(x) = 1/(1 + ex). BPN has been applied to various areas, such as investigating long-term tidal predictions (Lee, 2004), improving customer satis-faction (Deng, Chen, & Pei, 2007), predicting flank wear in drills (Panda et al., 2007), enhancing job completion time prediction in the semiconductor fabrication factory (Chen, 2007), and providing
the required accuracy for focal ventricular arrhythmias diagnosis (Yılmaz & Cunedioglu, 2007).
Based on the above literatures, many researches employed the BPN techniques for many applications. However, few of them used it to carry out empirical investigations of financial distress predic-tion related topics. Therefore, in this study we will use the BPN technique to forecast a potential crisis in the bankruptcy prediction domain. We hope that the results of our proposed approach will provide a useful methodology for investors as well as supervisory organizations to predict and avoid investing in, a company open to a bankruptcy in the near future.
2.2. Data mining
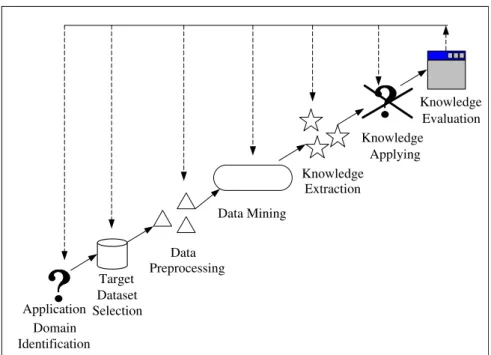
Data mining (DM), also known as ‘‘knowledge discovery in dat-abases” (KDD), is the process of discovering meaningful patterns in huge databases (Han & Kamber, 2001). In addition, it is also an application that can provide significant competitive advantages for making the right decision. (Huang, Chen, & Lee, 2007). DM is an explorative and complicated process involving multiple itera-tive steps.Fig. 2shows an overview of the data mining process (Han & Kamber, 2001). It is interactive and iterative, involving the following steps:
Step 1. Application domain identification: Investigate and under-stand the application domain and the relevant prior knowledge. In addition, identify the goal of the KDD from the administrators’ or users’ point of view.
Step 2. Target dataset selection: Select a suitable dataset, or focus on a subset of variables or data samples where data relevant to the analysis task are retrieved from the database.
Step 3. Data Preprocessing: the DM basic operations include ‘data clean’ and ‘data reduction’: In the ‘data clean’ process, we remove the noise data, or respond to the missing data field. In the ‘data reduction’ process, we reduce the unnecessary dimen-sionality or adopt useful transformation methods. The primary objective is to improve the effective number of variables under consideration.
Step 4. Data mining: This is an essential process, where AI meth-ods are applied in order to search for meaningful or desired pat-terns in a particular representational form, such as association rule mining, classification trees, and clustering techniques. Step 5. Knowledge Extraction: Based on the above steps it is
pos-sible to visualize the extracted patterns or visualize the data depending on the extraction models. Besides, this process also checks for or resolves any potential conflicts with previously believed knowledge.
Step 6. Knowledge Application: Here, we apply the found knowl-edge directly into the current application domain or in other fields for further action.
Step 7. Knowledge Evaluation: Here, we identify the most inter-esting patterns representing knowledge based data on some measure of interest. Moreover, it allows us to improve the accu-racy and efficiency of the mined knowledge.
A particular data mining algorithm is usually an instantiation of the model preference search components. The more common mod-el functions in the current data mining process include the follow-ing (Mitra, Pal, & Mitra, 2002).
Classification: Classifies a data item into one of several prede-fined categories.
Regression: Maps a data item to a real-valued prediction variable.
Clustering: Maps a data item into a cluster, where clusters are natural groupings of data items based on similarity metrics or probability density models.
Association rules: Describes association relationship among dif-ferent attributes.
Summarization: Provides a compact description for a subset of data.
Dependency modeling: Describes significant dependencies among variables.
Sequence analysis: Models sequential patterns, like time-series analysis. The goal is to model the state of the process generating the sequence or to extract and report deviations and trends over time.
Application
Domain
Identification
Target
Dataset
Selection
Data
Preprocessing
Data Mining
Knowledge
Knowledge
Knowledge
Extraction
Applying
Evaluation
In the recent past many research contributions have applied data mining techniques to many applications. DM has been suc-cessfully applied to several financial problem domains. Recent examples are as follows.Huang, Hsu, and Wang (2007) adopted the time-series mining approach to simulate human intelligence and discover financial database patterns automatically (Huang et al., 2007).Kirkos, Spathis, and Manolopoulos (2007)used classi-fication mining to identify fraudulent financial statements (Kirkos et al., 2007).Chun and Park (2006)integrated the regression anal-ysis and case-based reasoning for predicting the stock market in-dex (Chun & Park, 2006). However, few of these studies focused on the data clustering approach, and even fewer empirical investi-gations were made of financial distress prediction related topics. Therefore, we will use data clustering to enhance the accuracy of predicting bankruptcy in a capital market.
3. Research methodology
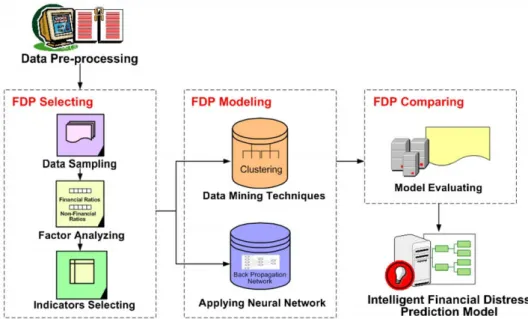
In this study we integrate ANN and DM techniques for financial distress prediction (FDP). The research methodology is as shown in
Fig. 3. In the first phase we deal with the dataset which basically is the original huge set of records from the TSEC which will be cov-ered by data pre-processing. The data sets then undergo cleaning and preprocessing for removing discrepancies and inconsistencies to improve their quality. The goal in this phase is to select the suit-able indicators, including financial and non-financial ratios, by means of factor analysis. After the above processes, the next phase will load these indicators and discovery prediction rule sets that are ready to be used in ANN and DM clustering. The ‘‘FDP Select-ing” will be discussed in detail in the following sections.
In the FDP Modeling phase we collect the financial statement data sets for ANN and DM processing. In the ANN approach, we will use the BPN algorithm to discover the rules and predict the FDP. In the DM approach, we will use the clustering technique to classify and predict the FDP. Next, the selected data set is analyzed by applying algorithms in order to identify the patterns among the data that represent a relationship. The BPN and clustering algo-rithm are applied to separately determine the financial distress prediction patterns or rules.
In the FDP Comparison phase, we compare the prediction accu-racy for BPN and clustering mining by means of several times
fac-tor analysis (non-facfac-tor analysis, 1st facfac-tor analysis, and 2ndfactor analysis). Then, the intelligent financial distress prediction model will be constructed and initiated to validate the new data sets of the financial statement from the TSEC.
4. The FDP selecting phase 4.1. Data
Our sample contained data from 68 Taiwan firms listed in the TSEC. The period of sampling was from 1999 January u/i October, 2006, amounting to 7 years and 10 months. The 34 firms in finan-cial distress were matched with 34 non-bankruptcy firms. These firms were characterized as non-bankruptcy based on the absence of any indication or proof concerning the issuing of financial dis-tress in the auditors’ reports, in the financial and taxation dat-abases and in the TSEC. This of course did not guarantee that the financial statements of these firms were not falsified or that the financial distress of these firms would not be revealed in the fu-ture. It only guaranteed that no firms in financial distress had been found during an extensive search. All the variables used in the sample were extracted from formal financial statements, such as balance sheets and income statements. This implies that the use-fulness of this study is not restricted by the fact that only data from Taiwanese companies was used.
4.2. Variables
The selection of variables to be used as candidates for participa-tion in the input vector was based upon prior research work linked to the topic of financial distress prediction. The work carried out by
Kirkos et al. (2007), Spathis (2002), Spathis, Doumpos, and Zopo-unidis (2002), Fanning and Cogger (1998), Persons (1995), Stice (1991), Feroz, Park, and Pastena (1991), Loebbecke, Eining, and Willingham (1989)and Kinney and McDaniel (1989)contained the suggested indicators of financial distress prediction. Therefore, this paper adopted the related variables based on prior researches, the Taiwanese Economic Journal (TEJ), and the Taiwanese eco-nomic database. Moreover, this paper selected 37 variables and categorized them as six major types: earning ability, financial structure ability, management efficiency ability, management
performance, debt-repaying ability, and non-financial factors. The details of these indicators belong to each type and are listed as follows:
Earning ability: Including pretax margin, return on total assets, return on equity, earnings per share, and gross margin ratios. Financial structure ability: Including debt to assets, times interest
earned, book value per share, financial leverage ratio, debt to equity, short term and long term debt to book value ratio, fixed assets to total assets ratio, gross margin to total assets ratio, inventory to total assets ratio, inventory to sales ratio, invest-ment ratio, and current assets to total assets ratios.
Management efficiency ability: Including turnover rate of inven-tory, turnover rate of account receivable, turnover rate of fixed assets, turnover rate of total assets, turnover rate of equity, and turnover rate of working capital ratios.
Management performance: Including pretax margin growth ratio, gross margin growth ratio, and sales growth ratio ratios. Debt-repaying ability: Including current ratio, acid-test ratio,
cash ratio, cash flow ratio, cash flow to long term debt, cash flow to total debt, and cash flow to short term and long term debt ratio ratios.
Non-financial factors: Including dividend payout ratio, price-book ratio, the proportion of collateralized shares by the board of directors, and the insider holding ratio.
4.3. Factor analysis
This paper collected the samples of 34 pairs of financial distress and non-bankruptcy firms listed in the TSEC, between 1999 and 2006. The main variables are 37 ratios for the predictive financial distress model factors. This research used the SPSS statistical soft-ware to conduct factor analysis and principle component analysis (PCA) with varimax for rotation (VARIMAX), in order to make the factor structure easier and simpler to explain. The principle for the selection of factors is based on Kaiser’s criteria, meaning that the eigenvalue greater than 1 is a common factor, the absolute va-lue of the factor loadings is greater than 0.5 and the communality is greater than 0.8 in order to obtain suitable factors.
In total, we compiled 33 financial ratios and 4 non-financial ra-tios. In an attempt to reduce dimensionality, we ran a factor anal-ysis to test whether the differences between these 37 variables were significant for each variable. If the difference was not signif-icant (low factor loadings or communality values), the variable was considered to be non-informative.Table 1shows the factor load-ings, communality, the eigenvalues and the explained variance for each variable. As a result, 18 variables presented high factor loadings or communality values. These variables were chosen to be used in the input vector, while the remaining 19 variables were discarded. In addition, the total explained variance was 75.776%. We used the factor analysis to process the experiment a second time.Table 2shows that 5 variables were discarded, and that the total explained variance was 85.288%. Due to the better perfor-mance in the total explained variance value, we can assume that the factor analysis is not yet the optimal solution. Therefore, we used the factor analysis to process the experiment a third time.
Table 3shows that two variables were discarded, and that the total explained variance was 91.876%. Therefore we used the factor analysis to process the experiment a fourth time. However,Table 4shows there were no suitable variables to be discarded, and the total explained variance was down to 88.228%. Therefore, we can were sure that the optimal factor analysis was the one we carried out the third time, where the performance was the highest at 91.876%.
Table 1
1st Factor analysis results
Factors Variables Factor loadings
Communality Eigenvalues Explained variance 1 Earnings per share
(EPS) 0.870 0.919 4.023 10.874 Return on equity (ROE) 0.862 0.889 Return on asset (ROA) 0.850 0.866 Pretax margin growth ratio 0.641 0.524 Margin before
interest and tax (BEFM)
0.638 0.814
2 Current ratio 0.762 0.877 3.858 10.428
Acid-test ratio 0.742 0.833 Equity per share 0.631 0.742 Cash ratio 0.624 0.503 Gross margin ratio 0.609 0.660 Price-book ratio
(PBR)
0.352 0.462
3 Gearing ratio 0.949 0.969 3.738 10.103
Debt to equity ratio (DEBE) 0.948 0.968 Debt/equity (DE) 0.923 0.962 Debt ratio 0.625 0.820 4 Turnover rate of total assets 0.858 0.824 2.886 7.800 Turnover rate of equity 0.798 0.793 Turnover rate of fixed assets 0.635 0.803 Gross margin to
total assets ratio
0.479 0.716 5 Inventory to total assets ratio 0.899 0.889 2.558 6.912 Inventory to sales ratio 0.848 0.802 Current assets to total assets 0.578 0.871 The proportion of collateralized shares by the broad of directors
0.422 0.397
6 Cash flow ratio 0.859 0.873 2.476 6.693
Cash flow to total debt ratio 0.830 0.823 Dividend payout ratio 0.514 0.579 7 Insider holding ratio 0.756 0.635 2.039 5.510 Investment ratio 0.635 0.755 Fixed assets to total
assets ratio
0.607 0.772 8 Times interest
earned
0.836 0.778 2.012 Cash flow to long
term debt 0.827 0.732 9 Turnover rate of working capital 0.788 0.777 4.571 Turnover rate of inventory 0.714 0.736 10 Turnover rate of account receivable 0.782 0.693 1.646 4.450 Gross margin growth ratio 0.665 0.526 Sales revenue growth ratio 0.548 0.641 11 Cash flow to short
term and long term debt ratio
0.871 0.813 1.110 2.999
After the three times factor analysis, 13 variables presented higher factor loadings or communality values. These variables were chosen to be used in the input vector, while the remaining 24 variables were discarded. The selected variables were debt to
equity ratio, gearing ratio, debt/equity (DE), return on asset (ROA), earnings per share (EPS), return on equity (ROE), current ra-tio, acid-test rara-tio, current assets to total assets, cash flow to total debt ratio, cash flow ratio, inventory to total assets ratio, and inventory to sales ratio.
5. The FDP modeling phase 5.1. ANN experiments and results
This process uses the finance and non-finance ratios, and con-structs a financial distress prediction model after carrying out a second time factor analysis. The variables are then loaded as ANN input nodes. In addition, we also apply these experiment parameters to investigate the past 2 seasons, the past 4 seasons, the past 6 seasons, and the past 8 seasons before the financial dis-tress occurred, for the sake of prediction accuracy. In this experi-ment, we will use the BPN as the ANN algorithm. In addition, the training sample and the testing sample will adopt the 80:20 ratio. In terms of bankruptcy prediction, whether or not the predic-tion is accurate is routinely measured by three quantities:Type I Error Rate,Type II Error Rate, and Total Error Rate. ‘‘TypeIError Rate” means that the error rate for the risk can not categorize the normal company as a normal company, ‘‘TypeIIError Rate” means that the error rate for the risk can not categorize the bankruptcy company, and ‘‘Total Error Rate” means the combined ‘‘TypeIError Rate” and ‘‘TypeIIError Rate”.Table 5shows the relationship among these three error rate types. The formula for each error rate is listed as follows:
Type I Error Rate¼Y2 Y3
ð4Þ Type II Error Rate¼Y4
Y6
ð5Þ Total Error Rate¼ðY2þY4Þ
Y9
ð6Þ
Table 5
The relationship with type I, II, and total error rates
Prediction Sum Normal Bankruptcy Actually Normal Y1 Y2 Y3 Bankruptcy Y4 Y5 Y6 Sum Y7 Y8 Y9 Table 2
2nd Factor analysis results Factors Variables Factor
loadings
Communality Eigenvalues Explained variance 1 Return on asset (ROA) 0.913 0.904 3.497 19.427 Return on equity (ROE) 0.903 0.923 Earnings per share (EPS) 0.897 0.897 Margin before
interest and tax (BEFM) 0.759 0.717 2 Gearing ratio 0.962 0.978 3.492 19.401 Debt to equity ratio 0.961 0.976 Debt/equity (DE) 0.939 0.968 Debt ratio 0.656 0.789 3 Current ratio 0.896 0.939 2.296 12.755 Acid-test ratio 0.892 0.940 4 Inventory to total assets ratio 0.909 0.868 11.659 Inventory to sales ratio 0.891 0.854 5 Turnover rate of fixed assets 0.840 0.775 2.076 11.536 Turnover rate of total assets 0.811 0.761 Current assets to total assets 0.649 0.869 6 Cash flow to total
debt ratio
0.830 0.835 1.892 10.509
Cash flow ratio 0.811 0.869 Cash flow to short
term and long term debt ratio
0.642 0.489
Total explained variance 85.288
Table 3
3rd Factor analysis results Factors Variables Factor
loadings
Communality Eigenvalues Explained variance 1 Debt to equity ratio 0.970 0.993 3.011 23.164 Gearing ratio 0.969 0.994 Debt/equity (DE) 0.943 0.973 2 Return on asset (ROA) 0.923 0.935 2.759 21.227 Earnings per share (EPS) 0.917 0.930 Return on equity (ROE) 0.909 0.930 3 Current ratio 0.894 0.929 2.106 16.203 Acid-test ratio 0.877 0.945 Current assets to total assets 0.602 0.763 4 Cash flow to
total debt ratio
0.950 0.934 2.038 15.673
Cash flow ratio 0.940 0.943 5 Inventory to
total assets ratio
0.927 0.889 2.029 15.609
Inventory to sales ratio
0.874 0.788
Total explained variance 91.876
Table 4
4th Factor analysis results Factors Variables Factor
loadings
Communality Eigenvalues Explained variance 1 Gearing ratio 0.962 0.988 2.969 26.989 Debt to equity ratio 0.961 0.986 Debt/equity (DE) 0.942 0.973 2 Return on asset (ROA) 0.923 0.929 2.779 25.259 Earnings per share (EPS) 0.918 0.923 Return on equity (ROE) 0.910 0.931 3 Cash flow to
total debt ratio
0.937 0.915 2.047 18.613
Cash flow ratio 0.920 0.916 Inventory to
total assets ratio
0.393 0.194
4 Current ratio 0.936 0.975 1.910 17.366
Acid-test ratio 0.921 0.975
5.1.1. The experiment using a non-factor analysis
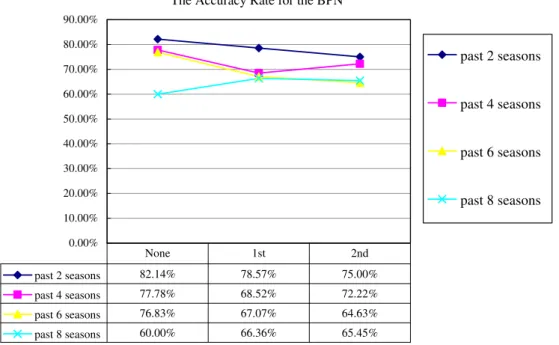
This experiment obtains a result after using 37 original ratio variables that have not yet obtained a result by factor analysis. As shown inTable 6, the testing data has an estimate accuracy rate as high as 82.14%, with an error rate of 17.86% for the past 2 sea-sons. However, the accuracy rate reduces to 60%, and the error rate rises to 40% when measured over the past 8 seasons. The closer the financial crisis the higher the accuracy will be.
5.1.2. The experiment with the 1st factor analysis
This experiment obtains a result after using 18 original ratio variables of this research that have undergone 1st factor analysis. As shown inTable 7, the testing data has an estimate accuracy rate as high as 78.57%, with an error rate of 21.43% for the past 2 sea-sons. However, the accuracy rate reduces to 66.36%, and the error rate rises to 33.64% when measured over the past 8 seasons. Sim-ilar to the above experiment, the closer the financial crisis the higher the accuracy will be.
5.1.3. The experiment with 2nd factor analysis
This experiment obtains a result after using 13 original ratio variables of this research that have undergone 2nd factor analysis. As shown inTable 8, the testing data has an estimate accuracy rate as high as 75%, with an error rate of 25% for the past 2 seasons.
However, the accuracy rate reduces to 65.45%, and the error rate rises to 34.55% when measured over the past 8 seasons. Similar to the above experiment, the closer the financial crisis the higher the accuracy will be.
5.2. DM experiments and results
Clustering analysis finds groups, each very different from the other. However, within a group all members are very similar. Un-like classification, the class label of each group is not known. Clus-tering is a way to naturally segment data into groups, whereas classification is a way to segment data by assigning it into groups. Briefly, a good clustering method will produce high quality clusters with high intra-class similarity and low inter-class similarity (Chen & Chen, 2006). However, how good a cluster is ultimately depends on the opinion of the user. In our experiment, we used the parti-tioning methods to cluster the datasets for the financial distress prediction model. The partitioning methods construct a partition of a database ofNobjects into a set ofkclusters. Usually, they start with an initial partition and then use an iterative control strategy to optimize an objective function.
The K-means algorithm (Han & Kamber, 2001) is a well-known and commonly used clustering algorithm. It takes input parameter k and partitions data intok clusters. First, we select k objects to represent the cluster centers. The remaining objects are then assigned to the cluster whose center is closest to the object. Then, it computes the mean value for each cluster as new cluster centers. This process is iterated until the criterion function converges.
The same as with the ANN experiment, this process also uses a finance and non-finance ratio, and constructs the financial distress prediction model after a second time factor analysis. We apply the K-means algorithm to investigate the past 2 seasons, the past 4 seasons, the past 6 seasons, and the past 8 seasons before the occurrence of financial distress to ensure prediction accuracy. After the K-means algorithm implementation, we decided to adopt 10–15 clusters to analyze the prediction accuracy.
5.2.1. The experiment with non-factor analysis
This experiment obtains a result after using 37 original ratio variables of this research that haven’t yet undergone a factor anal-ysis. As shown inTable 9, the data has an estimate accuracy rate as high as 78.57%, with an error rate of 21.43% for the past 2 seasons. However, the accurate rate reduces to 56.36%, and the error rate rises to 43.64%, when measured over the past 8 seasons. The closer the financial crisis the higher the accuracy will be.
5.2.2. The experiment with 1st factor analysis
This experiment obtains a result after using 18 original ratio variables of this research that have undergone a 1st factor analysis. As shown inTable 10, the data has an estimate accuracy rate as high as 75%, with an error rate of 25% for the past 2 seasons. How-ever, the accurate rate reduces to 56.36%, and the error rate rises to 43.64% when measured over the past 8 seasons. Similar to the above experiment, the closer the financial crisis the higher the accuracy will be.
5.2.3. The experiment with 2nd factor analysis
This experiment obtains a result after using 13 original ratio variables of this research that have undergone 2nd factor analysis. As shown inTable 11, the testing data has an estimate accuracy rate as high as 75%, with an error rate of 25% for the past 2 seasons. However, the accurate rate reduces to 56.36%, and the error rate rises to 43.64% when measured over the past 8 seasons. Similar to the above experiment, the closer the financial crisis the higher the accuracy will be.
Table 6
The accuracy for the ANN model with non-factor analysis
Training data Testing data
Normal Bankruptcy Normal Bankruptcy 2 Accuracy rate 87.03% 94.44% 92.86% 71.43% Average 90.74% 82.14% 4 Accuracy rate 89.91% 92.67% 100.00% 55.56% Average 91.28% 77.78% 6 Accuracy rate 91.41% 95.71% 87.80% 65.85% Average 93.56% 76.83% 8 Accuracy rate 95.85% 93.55% 74.55% 45.45% Average 94.70% 60.00% Table 7
The accuracy for the ANN model with 1st factor analysis
Training data Testing data
Normal Bankruptcy Normal Bankruptcy 2 Accuracy rate 90.74% 84.48% 85.71% 71.43% Average 86.11% 78.57% 4 Accuracy rate 87.16% 85.32% 88.89% 48.15% Average 86.24% 68.52% 6 Accuracy rate 83.44% 86.50% 65.85% 68.29% Average 84.97% 67.07% 8 Accuracy rate 93.09% 88.48% 67.27% 65.45% Average 90.78% 66.36% Table 8
The accuracy for the ANN model with 2nd factor analysis
Training data Testing data
Normal Bankruptcy Normal Bankruptcy 2 Accuracy rate 87.04% 77.78% 78.57% 71.43% Average 82.41% 75.00% 4 Accuracy rate 86.24% 86.24% 92.59% 51.85% Average 86.24% 72.22% 6 Accuracy rate 87.73% 83.44% 80.49% 48.78% Average 85.58% 64.63% 8 Accuracy rate 86.18% 81.57% 78.18% 52.73% Average 83.87% 65.45%
6. The FDP comparing phase
After the implementation for the FDP modeling phase, we will compare the BPN and clustering approaches with the accuracy rate, Type II error rate, and factor analysis. The detail descriptions will be discussed as following sections.
6.1. The accuracy rate for BPN and clustering
As is evident by the above-mentioned results inFig. 4, the BPN model presents the prediction performance by non-factor analysis, after the first-time factor analysis, and after the second time factor analysis. The result shows that the accuracy rate has the worst trend from the past 2 seasons to the past 8 seasons prior to the occurrence of the financial crisis. In addition, the BPN model shows that the closer the crisis the higher the accuracy rate becomes.
As seen by the above-mentioned results shown inFig. 5, the clustering model shows the prediction performance by non-factor analysis, after first-time factor analysis, and after the second time factor analysis. As a result, the accuracy rate is also shown the
worse and worse trend as BPN model. In addition, the clustering model becomes more accurate the closer the crisis.
6.2. The type II error rate for BPN and clustering
As seen by the above-mentioned results shown in Fig. 6, the BPN model presents the Type II error rate by non-factor analysis, after first-time factor analysis, and after the second time factor analysis. It shows that the Type II error rate increases for each fac-tor analysis, while the accuracy rate decreases from the past 2 sea-sons to the past 8 seasea-sons prior to the financial crisis. In addition, the BPN model becomes more accurate the closer the crisis and the Type II error rate becomes lower.
As seen by the above-mentioned results shown in Fig. 7, the clustering model presents the Type II error rate by non-factor analysis, after first-time factor analysis, and after the second time factor analysis. It indicates that the Type II error rate has approxi-mately the same increasing trend as the BPN model, while the accuracy rate decreases similar to the BPN model. The only excep-tion is the Type II error rate which is better in the 2nd factor
anal-Table 9
The accuracy for the clustering model with non-factor analysis
10 Clusters 11 Clusters 12 Clusters 13 Clusters 14 Clusters 15 Clusters
Accuracy Accuracy Accuracy Accuracy Accuracy Accuracy
Normal Bankruptcy Normal Bankruptcy Normal Bankruptcy Normal Bankruptcy Normal Bankruptcy Normal Bankruptcy
2 Accuracy 100% 57.14% 50.00% 85.71% 50.00% 85.71% 100% 57.14% 100% 57.14% 85.71% 57.14% Average 78.57% 67.86% 67.86% 78.57% 78.57% 71.43% 4 Accuracy 74.07% 77.78% 88.89% 55.56% 88.89% 55.56% 62.96% 70.37% 88.89% 55.56% 88.89% 55.56% Average 75.93% 72.22% 72.22% 66.67% 72.22% 72.22% 6 Accuracy 51.22% 85.37% 100% 48.78% 100% 51.22% 100% 51.22% 97.56% 51.22% 60.98% 73.17% Average 68.29% 64.63% 75.61% 75.61% 74.39% 67.07% 8 Accuracy 47.27% 87.27% 85.45% 36.36% 41.82% 78.18% 40.00% 78.18% 50.91% 76.36% 96.36% 16.36% Average 67.27% 60.91% 60.00% 59.09% 63.64% 56.36% Table 10
The accuracy for the clustering model with 1st factor analysis
10 Clusters 11 Clusters 12 Clusters 13 Clusters 14 Clusters 15 Clusters
Accuracy Accuracy Accuracy Accuracy Accuracy Accuracy
Normal Bankruptcy Normal Bankruptcy Normal Bankruptcy Normal Bankruptcy Normal Bankruptcy Normal Bankruptcy 2 Accuracy 100% 35.71% 100.00% 50.00% 100.00% 50.00% 100% 50.00% 100% 50.00% 100.00% 50.00% Average 67.86% 75.00% 75.00% 75.00% 75.00% 75.00% 4 Accuracy 70.37% 51.85% 100.00% 40.74% 100.00% 37.04% 100.00% 40.74% 100.00% 40.74% 100.00% 37.04% Average 61.11% 70.37% 68.52% 70.37% 70.37% 68.52% 6 Accuracy 92.68% 29.27% 100% 19.51% 100% 19.51% 53.66% 51.22% 100.00% 34.15% 100.00% 34.15% Average 60.98% 59.76% 59.76% 52.44% 67.07% 67.07% 8 Accuracy 72.73% 40.00% 100.00% 14.55% 100.00% 21.82% 100.00% 23.64% 100.00% 21.82% 100.00% 21.82% Average 56.36% 57.27% 60.91% 61.82% 60.91% 60.91% Table 11
The accuracy for the clustering model with 2nd factor analysis
10 Clusters 11 Clusters 12 Clusters 13 Clusters 14 Clusters 15 Clusters
Accuracy Accuracy Accuracy Accuracy Accuracy Accuracy
Normal Bankruptcy Normal Bankruptcy Normal Bankruptcy Normal Bankruptcy Normal Bankruptcy Normal Bankruptcy 2 Accuracy 100.00% 21.43% 100.00% 35.71% 100.00% 50.00% 71.43% 50.00% 71.43% 50.00% 92.86% 57.14% Average 60.71% 67.86% 75.00% 60.71% 60.71% 75.00% 4 Accuracy 100.00% 37.04% 100.00% 37.04% 100.00% 37.04% 100.00% 25.93% 100.00% 51.85% 70.37% 74.07% Average 68.52% 68.52% 68.52% 62.96% 75.93% 72.22% 6 Accuracy 82.93% 65.85% 82.93% 65.85% 82.93% 65.85% 82.93% 65.85% 68.29% 68.29% 68.29% 68.29% Average 74.39% 74.39% 74.39% 74.39% 68.29% 68.29% 8 Accuracy 58.18% 56.36% 83.64% 29.09% 65.45% 60.00% 65.45% 60.00% 61.82% 61.82% 74.55% 56.36% Average 57.27% 56.36% 62.73% 62.73% 61.82% 65.45%
ysis than in the non-factor analysis over the past 6 seasons. Never-theless, in summary we get that the closer the crisis point, the low-er the Type II low-error rate in the clustlow-ering model.
6.3. The factor analysis for BPN and clustering
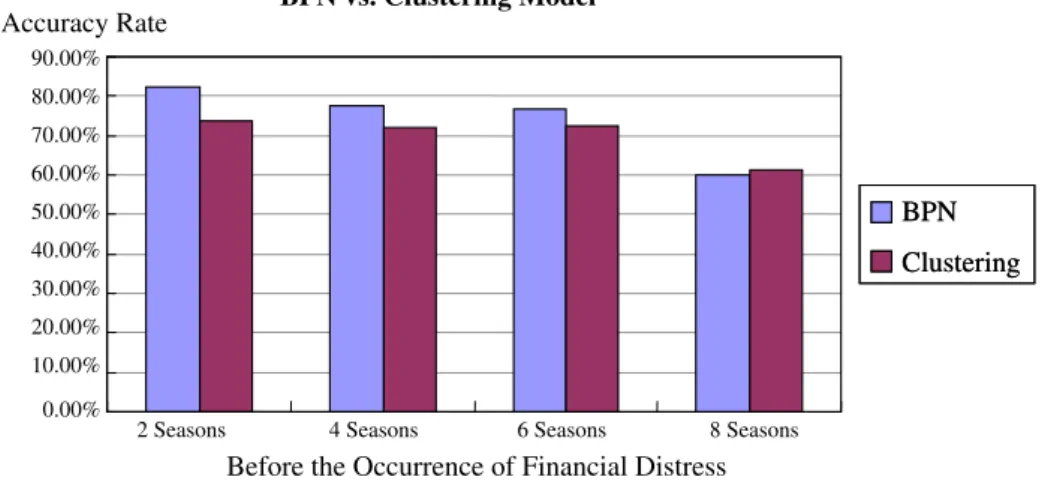
In this comparison, we average the accuracy rate of BPN and the clustering model for each factor analysis and over 2, 4, 6, and 8 sea-sons. InFig. 8, we can see that the accuracy rate (non-factor anal-ysis) with the BPN model is better than with the clustering model, with the exception of the past 8 seasons. InFig. 9, we can see that the accuracy rates (1st factor analysis) with the BPN model are all better than with the clustering model. InFig. 10, we can see that the accuracy rate (2nd factor analysis) with the BPN model is bet-ter than with the clusbet-tering model, with the exception over the past 6 seasons.
7. Conclusions
This research aimed at the financial and the non-financial ratios in the financial statement, and used the BPN and the clustering model to compare the performance of the financial distress predictions, in order to find a better early-warning method. This research took 34 companies that were facing a financial crisis, and matched them with 34 normal companies of the similar indus-try. In addition, we adopted the necessary dataset from the TSEC database and sampled them into the past 2, 4, 6, 8 seasons prior to the financial crisis occurrence. This data was then used to carry out a statistical factor analysis, with each ratio variable being gen-erated going into BPN and clustering methods in order to make a comparison.
After the experiments, we summarized four critical contribu-tions. First, the more time we used factor analysis, the less accurate
The Accuracy Rate for the BPN
0.00% 10.00% 20.00% 30.00% 40.00% 50.00% 60.00% 70.00% 80.00% 90.00%
past 2 seasons
past 4 seasons
past 6 seasons
past 8 seasons
past 2 seasons 82.14% 78.57% 75.00% past 4 seasons 77.78% 68.52% 72.22% past 6 seasons 76.83% 67.07% 64.63% past 8 seasons 60.00% 66.36% 65.45% None 1st 2ndFig. 4.The accuracy rate for the BPN.
The Accuracy Rate for Clustering
0.00% 20.00% 40.00% 60.00% 80.00%
past 2 seasons
past 4 seasons
past 6 seasons
past 8 seasons
past 2 seasons 73.81% 74.31% 66.67% past 4 seasons 71.91% 68.21% 69.36% past 6 seasons 72.56% 61.18% 72.36% past 8 seasons 61.21% 59.70% 61.06% None 1st 2ndthe results for the BPN and clustering approaches. In our experi-ments, we found that when we applied all of the 37 variables with non-factor analysis into the BPN and clustering models, we could obtain a better prediction performance except for the past 8 sea-sons in the BPN model and for the past 2 seasea-sons in the clustering model.
Second, the closer we get to the time of the actual financial dis-tress, the more accurate the prediction will be. For example, the accuracy rate with the non-factor analysis for 2 seasons before the financial distress occurs is 82.14% in BPN, while it is only 60% over 8 seasons. The results are similar for the clustering model, where the accuracy rate with non-factor analysis for 2 and 8 sea-sons before the occurrence of financial distress are 73.81% and 61.21%, respectively.
Third, most investors are concerned with the Type II error rate and avoid investing in these companies. Our empirical results show that factor analysis increases the error forecasts of classifying companies with a potential financial crisis as a normal company. Moreover, we also found that the average rate of the Type II error in the clustering model is higher than in the BPN model. Therefore, the prediction performance for the clustering approach is more aggressively influenced than the BPN model.
Finally, the BPN approach obtains a better prediction accuracy than the DM clustering approach in developing a financial distress prediction model, with the exception that the accuracy rate (non-factor analysis) for the past 8 seasons model and the accuracy rate (2nd factor analysis) for the past 6 seasons is lower with the BPN model.
The Type 2 Error Rate for the BPN
0.00% 10.00% 20.00% 30.00% 40.00% 50.00% 60.00%
past 2 seasons
past 4 seasons
past 6 seasons
past 8 seasons
past 2 seasons 28.57% 28.57% 28.57% past 4 seasons 44.44% 51.85% 48.15% past 6 seasons 34.15% 31.71% 51.22% past 8 seasons 54.55% 34.55% 47.27% None 1st 2ndFig. 6.The type 2 error rate for the BPN.
The Type 2 Error Rate for Clustering
0.00% 10.00% 20.00% 30.00% 40.00% 50.00% 60.00% 70.00% 80.00% 90.00%
past 2 seasons
past 4 seasons
past 6 seasons
past 8 seasons
past 2 seasons 33.34% 52.38% 55.95% past 4 seasons 38.27% 58.64% 56.17% past 6 seasons 39.84% 74.71% 33.34% past 8 seasons 37.88% 76.36% 46.06% None 1st 2ndIn future research, additional artificial intelligence techniques, such as other neural network models, classification mining, genetic algorithms, and others, could also be applied. And certainly, researchers could expand the system so as to deal with more finan-cial datasets.
Acknowledgements
We also gratefully acknowledge the Editor and anonymous reviewers for their valuable comments and constructive suggestions.
BPN vs. Clustering Model
2 Seasons 4 Seasons 6 Seasons 8 Seasons
Before the Occurrence of Financial Distress
Accuracy Rate
BPN
Clustering
90.00% 80.00% 70.00% 60.00% 50.00% 40.00% 30.00% 20.00% 10.00% 0.00%BPN
Clustering
Fig. 8.The accuracy rate with non-factor analysis for the BPN and clustering comparison.
BPN vs. Clustering Model
2 Seasons 4 Seasons 6 Seasons 8 Seasons
Before the Occurrence of Financial Distress
Accuracy rateBPN
Clustering
90.00% 80.00% 70.00% 60.00% 50.00% 40.00% 30.00% 20.00% 10.00% 0.00%Fig. 9.The accuracy rate with 1st analysis for the BPN and clustering comparison.
BPN vs. Clustering Model
2 Seasons 4 Seasons 6 Seasons 8 Seasons
Before the Occurrence of Financial Distress
Accuracy rateBPN
Clustering
80.00% 70.00% 60.00% 50.00% 40.00% 30.00% 20.00% 10.00% 0.00%References
Altman, E. L. (1968). Financial ratios, discriminant analysis and the prediction of corporate bankruptcy.The Journal of Finance, 23(3), 589–609.
Altman, E. L., Edward, I., Haldeman, R., & Narayanan, P. (1977). A new model to identify bankruptcy risk of corporations.Journal of Banking and Finance, 1, 29–54.
Beaver, W. (1966). Financial ratios as predictors of failure, empirical research in accounting: Selected studied.Journal of Accounting Research, 71–111. Blum, M. (1974). Failing company discriminant analysis. Journal of Accounting
Research, 1–25.
Chen, T. (2007). Incorporating fuzzy c-means and a back-propagation network ensemble to job completion time prediction in a semiconductor fabrication factory.Fuzzy Sets and Systems, 158(19), 2153–2168.
Chen, A. P., & Chen, C. C. (2006). A new efficient approach for data clustering in electronic library using ant colony clustering algorithm.The Electronic Library, 24(4), 548–559.
Chun, S. H., & Park, Y. J. (2006). A new hybrid data mining technique using a regression case based reasoning: Application to financial forecasting.Expert Systems with Applications, 31(2), 329–336.
Deng, W. J., Chen, W. C., & Pei, W. (2007). Back-propagation neural network based importance–performance analysis for determining critical service attributes. Expert Systems with Applications. doi: 10.1016/j.eswa.2006. 12.016.
Dimitras, A. I., Zanakis, S. H., & Zopounidis, C. (1996). A survey of business failure with an emphasis on prediction methods and industrial applications.European Journal of Operational Research, 90(3), 487–513.
Fanning, K., & Cogger, K. (1998). Neural network detection of management fraud using published financial data. International Journal of Intelligent Systems in Accounting, Finance and Management, 7(1), 21–24.
Feroz, E., Park, K., & Pastena, V. (1991). The financial and market effects of the SECs accounting and auditing enforcement releases.Journal of Accounting Research, 29(Suppl.), 107–142.
Han, J., & Kamber, M. (2001).Data mining: Concepts and techniques. San Francisco, CA, USA: Morgan Kaufmann.
Huang, M. J., Chen, M. Y., & Lee, S. C. (2007). Integrating data mining with case-based reasoning for chronic diseases prognosis and diagnosis.Expert Systems with Applications, 32(3), 856–867.
Huang, Y. P., Hsu, C. C., & Wang, S. H. (2007). Pattern recognition in time series database: A case study on financial database.Expert Systems with Applications, 33(1), 199–205.
Hua, Z., Wang, Y., Xu, X., Zhang, B., & Liang, L. (2007). Predicting corporate financial distress based on integration of support vector machine and logistic regression. Expert Systems with Applications, 33(2), 434–440.
John, S. G., & Robert, W. I. (2001). Tests of the generalizability of altman’s bankruptcy prediction model.Journal of Business Research, 54, 53–61. Jost, A. (1993). Neural networks: A logical progression in credit and marketing
decision system.Credit World, 81(4), 26–33.
Kinney, W., & McDaniel, L. (1989). Characteristics of firms correcting previously reported quarterly earnings.Journal of Accounting and Economics, 11(1), 71–93. Kirkos, E., Spathis, C., & Manolopoulos, Y. (2007). Data mining techniques for the detection of fraudulent financial statements.Expert Systems with Applications, 32(4), 995–1003.
Ko, P. C., & Lin, P. C. (2006). An evolution-based approach with modularized evaluations to forecast financial distress. Knowledge-Based Systems, 19(1), 84–91.
Laitinen, E. K., & Laitinen, T. (2000). Bankruptcy prediction application of the Taylor’s expansion in logistic regression. International Review of Financial Analysis, 9, 327–349.
Lee, T. L. (2004). Back-propagation neural network for long-term tidal predictions. Ocean Engineering, 31(2), 225–238.
Loebbecke, J., Eining, M., & Willingham, J. (1989). Auditor’s experience with material irregularities: Frequency, nature and detectability.Auditing: A Journal of Practice and Theory, 9, 1–28.
Medsker, L., & Liebowitz, J. (1994).Design and development of expert systems and neural networks. New York: Macmillan.
Meyer, P. A., & Pifer, H. (1970). Prediction of bank failures.The Journal of Finance, 25, 853–868.
Mitra, S., Pal, S. K., & Mitra, P. (2002). Data mining in soft computing framework: A survey.IEEE Transactions Neural Networks, 13(1), 3–14.
Panda, S. S., Chakraborty, D., & Pal, S. K. (2007). Flank wear prediction in drilling using back-propagation neural network and radial basis function network. Applied Soft Computing. doi:10.1016/j.asoc.2007.07.003.
Persons, O. (1995). Using financial statement data to identify factors associated with fraudulent financial reporting.Journal of Applied Business Research, 11(3), 38–46. Ronald, J. W., Rumelhart, D. E., & Hinton, G. E. (1986). Learning internal representations by error propagation. In E. David Rumelhart & J. A. McClelland (Eds.).Parallel distributed processing: Explorations in the microstructure of cognition (Vol. 1). Cambridge: MIT Press/Bradford Books.
Spathis, C. (2002). Detecting false financial statements using published data: Some evidence from Greece.Managerial Auditing Journal, 17(4), 179–191.
Spathis, C., Doumpos, M., & Zopounidis, C. (2002). Detecting falsified financial statements: A comparative study using multicriteria analysis and multivariate statistical techniques.The European Accounting Review, 11(3), 509–535. Stice, J. (1991). Using financial and market information to identify pre-engagement
market factors associated with lawsuits against auditors.The Accounting Review, 66(3), 516–533.
Werbos, P. (1974), Beyond regression: New tools for prediction and analysis in the behavioral science, Ph.D. Thesis, Committee on Applied Mathematics, Harvard University, Cambridge, MA.
Wu, D., Yang, Z., & Liang, L. (2006). Using DEA-neural network approach to evaluate branch efficiency of a large Canadian bank.Expert Systems with Applications, 31, 108–115.
Yılmaz, B., & Cunedioglu, U. (2007). Source localization of focal ventricular arrhythmias using linear estimation, correlation, and back-propagation networks.Computers in Biology and Medicine, 37(10), 1437–1445.