ISSN (Online): 2319 – 8028, ISSN (Print): 2319 – 801X
www.ijbmi.org Volume 2 Issue 3 ǁ March. 2013ǁ PP.31-38
Comparative Study of Pre and Post Corporate Integration
through Mergers and acquisition
Manoj Kumara.N.V
1, Satyanarayana
2 1(Doctoral Student, Department of Post Graduate Studies in Management Sciences,
Maharaja Research Foundation, Mysore. University of Mysore, India)
2(HOD and Professor, Department of Post Graduate Studies in Management Sciences,
Maharaja Institute of Technology. Mysore. India)
ABSTRACT:
Merger and acquisition are concerning the determinations of the synergetic effect through which firms are undertake their domestic and global strategies .The study made an effort to find the nature and the impact of integration activities on the firm involved in such activities are vague sometimes ambiguous also. The study is tried to explore the potentialities and capabilities of the firm by looking pre and post merger and acquisition performance. The present study is examines the comparative difference between pre and post merger and acquisition in terms of financial analysis all the sample of ten major companies were taken from a list of merger and acquisition in india-2010.The results indicated a significant positive value creation to the acquired firms. The implication of the results will provide new evidences for the future and leads to greater value creation.Keywords:
Financial performance, Mergers and acquisition, synergetic effectI.
INTRODUCTION
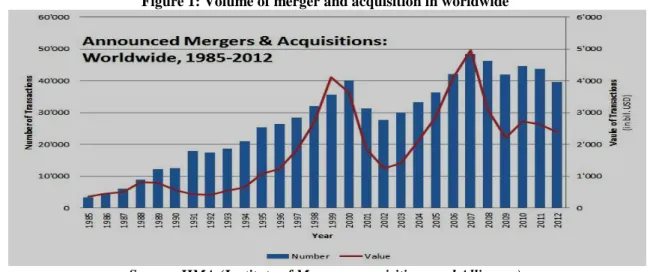
Recent merger and acquisition is indicating the competitiveness, potentialities and capabilities within an industry. The more merger and acquisition activity there is, the fewer firms there are to compete against within a firm. However, these merger and acquisition cab built an unfair market advantages that may harmful to the industry. “Fig-1”
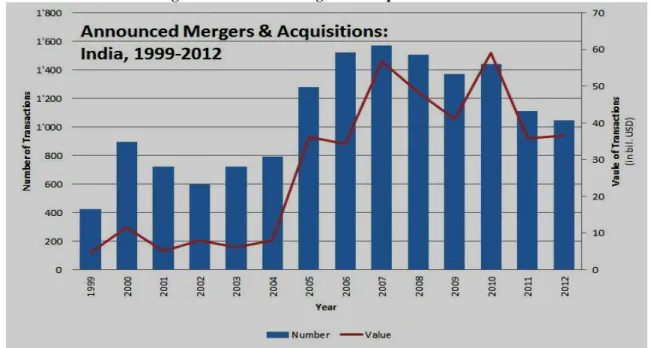
The evolution from segregation to economic integration has lead many business organization to increase the rate of merger and acquisition globally and India is also no exception. “fig -2”
Present merger and acquisition have an investment opportunity in some cases, if the merger and acquisition deals exhibit a majority share of a growing market after the merger and acquisition, it may signal that the company should purchase the stock of the target company equally, if the merger and acquisition seems an unhealthy, then they may want to separate from the business interest.
The fact is that the amount and volume of merger and acquisition is accomplishing greater levels, merger and acquisition is most important because these activities have significant implications for firm performance (Laamanen & Keil, 2008)
Figure 1: Volume of merger and acquisition in worldwide
Figure 2: Volume of merger and acquisition in India
Source: IIMA (Institute of Mergers, acquisitions and Alliances) 1.1 Background
“All marriage are heaven, it‟s the life afterwards that makes troubles”. The studies of both national and international journals are encouraging on the work relating to comparative study of pre and post corporate integration through Mergers and acquisitions. Maximum studies were already conducted on the value effect the merger and acquisition on stock prices and share holders wealth. But only a few studies have been done on the long term performance of bidder firm (Ross and Westerfield) after merger and acquisition. The study tries to provide conclusive evidence that merger and acquisition is efficiency or not.
1. Literature review
Ghosh (2001) found Mergers and acquisitions show the significant positive effect in operating performance.HBR(2011)found that 70% of Mergers and acquisitions are failed to create a value to the firm, for instance, Morosini, Shane and Singh(1998) Mergers and acquisitions become important strategic tool for corporate excellence of MNC. Mergers and acquisitions results to increase the efficiencies and effectiveness of corporate sector in relating to „individual companies‟ corporate exposure(Hih , Ireland and Harrison.2001).Pazarskis, Vogiatzogloy ,Christodoulou, and Drogalas(2006) the negative performance is not differ from bidder firm and found that the profitability of a company that performed an integration id decreased due to the integration event. Kumar(2009) show that on average, the post merger and acquisition profitability and solvency of the acquiring firms shows negative results when compared with the pre merger and acquisition values. The key success in buying another firm is knows the maximum price of actual pay and then have the discipline not to pay a penny more.
Vanitha and Selvan (2007) also found that financial performance of the acquired firms improves than the target firms. Manthravadhi and Reddy (2008) states that Mergers and acquisitions have positive effect on liquidity of firms in banking and finance sector, Pharmaceuticals, textiles and electrical equipment industries saw a marginal reduction in performance in terms of liquidity, profitability and returns on assets. For the chemical and agri products firms, performance after Mergers and acquisitions declined, both in terms of profitability and return on assets.
II.
HYPOTHESIS
Based on the research gap areas from the review of literature to find the impact of Mergers and acquisitions in post merger financial performance the following hypothesis is framed.
H 0: PostMergers and acquisitions performance have no significant impact on financial performance. H1: PostMergers and acquisitions performance have no significant impact on financial performance.
III.
RESEARCH METHODOLOGY
a. Data and their sources
The data collected from IIMA-Database with the focus on Mergers and Acquisitions transactions in India during the financial year-2010-2011.during the period 10 companies were selected based on the high value deals. so, those first major ten companies are taken for the analysis.
b. Methodology
In this study „event study‟ methodology is used to determine whether there was any changes in post merger and acquisition financial performance associated with merger and acquisition of ten sample companies in India.
c. Parameters
In this research is carried out over various years‟ consideration of accounting based approach using various financial tools.
i. Liquidity or solvency Parameters: - Current ratio, Liquidity ratio ii. Leverage parameters :-Debt equity ratio, total debt to Long term funds
iii. Profitability Parameters:-Return on capital employed, return on net worth, and return on assets.
d. Sample size
The research is confined to the merger and acquisition cases in chemicals, power, telecommunication, pharmaceutical, banking. steel, personal care, hospital and medical service and auto mobiles industry during the period of 2010.the time period is confined that there is 3 years to judge the post mergers and acquisitions performance, the year when merger and acquisition taken place is not considered for the analysis.
IV.
RESULTS AND DISCUSSIONS
The financial analysis that estimates the returns of firm and those financials analysis needs statistical techniques have to be used to determine the significant returns.
Table: 1 Current Ratio including short term loan in selected units (Before 1 years and after 3 years)
Name of the Company Before
merger (X)
After Merger (Y)
Difference [D=X-Y] Difference D2
Tata Chemicals 0.55 1.03 0.48 0.23 Reliance Power 0.56 1.35 0.79 0.62 Bharathi Airtel 0.6 0.38 -0.22 0.05 Abbott India 2.31 2.81 0.5 0.25 GTL Infrastructure 4.42 0.37 -4.05 16.40 ICICI Bank 0.11 0.12 0.01 0.00 JSW ISPAT Steel 0.85 0.97 0.12 0.01 Reckitt Benckiser 0.6 0.47 -0.13 0.02 Fortis Healthcare 1.48 3.28 1.8 3.24
Mahindra & Mahendra 0.9 0.95 0.05 0.00
ΣD = -0.65 ΣD2=20.83
Table: 2 Student t-test results pre and post merger and Acquisition performance
Financial ratio σ t-test value
Pre merger current ratio to post merger current ratio
Table: 3 liquidity Ratio in selected units (Before 1 years and after 3 years)
Name of the Company Before
merger (X) After Merger (Y) Difference [D=X-Y] Difference D2 Tata Chemicals 0.77 0.83 0.06 0.00 Reliance Power 0.56 1.32 0.76 0.58 Bharathi Airtel 0.64 0.47 -0.17 0.03 Abbott India 1.59 1.77 0.18 0.03 GTL Infrastructure 4.92 0.37 -4.55 20.70 ICICI Bank 3.71 3.44 -0.27 0.07 JSW ISPAT Steel 0.42 0.25 -0.17 0.03 Reckitt Benckiser 0.43 0.36 -0.07 0.00 Fortis Healthcare 3.06 10.73 7.67 58.83 Mahendra & Mahendra 0.83 0.66 -0.17 0.03 ΣD = 3.27 ΣD2=80.31
Table: 4 Student t-test results pre and post merger and Acquisition performance
Financial ratio σ t-test value
Pre merger liquidity ratio to post merger liquidity ratio
0.8175 5.09 0.32
Table: 5 return on capital employed in selected units (Before 1 years and after 3 years)
Name of the Company Before
merger (X) After Merger (Y) Difference [D=X-Y] Difference D2 Tata Chemicals 14.04 15.87 1.83 3.35 Reliance Power 1.42 3.87 2.45 6.00 Bharathi Airtel 25.3 8.86 -16.44 270.27 Abbott India 41.04 33.79 -7.25 52.56 GTL Infrastructure 0.55 2.54 1.99 3.96 ICICI Bank 13.14 11.72 -1.42 2.02 JSW ISPAT Steel 6.69 7.65 0.96 0.92 Reckitt Benckiser 6.6 6.93 0.33 0.11 Fortis Healthcare 1.64 2.77 1.13 1.28
Mahendra & Mahendra 13.99 23.58 9.59 91.97
ΣD = -6.83 ΣD2=432.44
Table: 6 Student t-test results pre and post merger and Acquisition performance
Financial ratio σ t-test value
Pre merger Return on capital employed to post merger Return on capital employed
Table: 7 Return on net worth in selected units (Before 1 years and after 3 years)
Name of the Company Before
merger (X)
After Merger (Y)
Difference [D=X-Y] Difference D2
Tata Chemicals 14.29 13.05 -1.24 1.54 Reliance Power 1.77 4.93 3.16 9.99 Bharathi Airtel 27.11 4.38 -22.73 516.65 Abbott India 27.95 22.12 -5.83 33.99 GTL Infrastructure 0.23 -29.26 -29.49 869.66 ICICI Bank 7.64 12.47 4.83 23.33 JSW ISPAT Steel 486.64 -45.53 -532.17 283204.91 Reckitt Benckiser 145 63.16 -81.84 6697.79 Fortis Healthcare -0.88 6.29 7.17 51.41
Mahendra & Mahendra 16.03 23.8 7.77 60.37
ΣD = -650.37 ΣD2=291469.63
Table: 8 Student t-test results pre and post merger and Acquisition performance
Financial ratio σ t-test value
Pre merger Return on net worth to post merger Return on net worth
-162.6 248.81 -1.30
Table: 9 Debt equity ratios of selected units (Before 1 years and after 3 years)
Name of the Company Before
merger (X)
After Merger (Y)
Difference [D=X-Y] Difference
D2 Tata Chemicals 1.39 0.93 -0.46 0.21 Reliance Power 0.1 0.83 0.73 0.53 Bharathi Airtel 0.47 1.36 0.89 0.79 Abbott India 0 0 0 0.00 GTL Infrastructure 2.92 2.52 -0.4 0.16 ICICI Bank 1.02 1.92 0.9 0.81 JSW ISPAT Steel 9.04 9.63 0.59 0.35 Reckitt Benckiser 0.05 0.083 0.033 0.00 Fortis Healthcare 0.38 0.35 -0.03 0.00
Mahendra & Mahendra 0.77 0.26 -0.51 0.26
ΣD = 1.743 ΣD2=3.12
Table: 10 Student t-test results pre and post merger and Acquisition performance
Financial ratio σ t-test
value Pre merger Debt equity ratio to post merger Debt
equity ratio
Table: 11 return of long term funds of selected units (Before 1 years and after 3 years)
Name of the Company Before
merger (X)
After Merger (Y)
Difference [D=X-Y] Difference D2
Tata Chemicals 24.48 16.49 -7.99 63.84 Reliance Power 1.42 3.87 2.45 6.00 Bharathi Airtel 24.26 10.56 -13.7 187.69 Abbott India 41.04 33.79 -7.25 52.56 GTL Infrastructure 0.56 2.54 1.98 3.92 ICICI Bank 68.05 57.98 -10.07 101.40 JSW ISPAT Steel 7.09 7.84 0.75 0.56 Reckitt Benckiser 3 2 -1 1.00 Fortis Healthcare 1.81 3.08 1.27 1.61
Mahendra & Mahendra 14.51 23.58 9.07 82.26
ΣD = -24.49 ΣD2=500.86
Table: 12 Student t-test results pre and post merger and Acquisition performance
Financial ratio σ t-test value
Pre merger Return on long term funds to post merger Return on long term funds
-6.123 10.82 -1.13
Table: 13 return of assets of selected units (Before 1 years and after 3 years)
Name of the Company Before
merger (X)
After Merger (Y)
Difference [D=X-Y] Difference D2
Tata Chemicals 192.73 251.93 59.2 3504.64 Reliance Power 57.49 62.63 5.14 26.42 Bharathi Airtel 152.7 133.27 -19.43 377.52 Abbott India 161.79 256.08 94.29 8890.60 GTL Infrastructure 14.89 13.24 -1.65 2.72 ICICI Bank 420.19 531.56 111.37 12403.28 JSW ISPAT Steel 7.6 2.77 -4.83 23.33 Reckitt Benckiser 14.83 40.32 25.49 649.74 Fortis Healthcare 34.74 78.98 44.24 1957.18
Mahendra & Mahendra 191.9 205.5 13.6 184.96
ΣD = 327.42 ΣD2=28020.39
Table: 14 Student t-test results pre and post merger and Acquisition performance
Financial ratio σ t-test value
Pre merger Return on Assets to post merger Return on Assets
Table: 15 total debt to long term fund of selected units (Before 1 years and after 3 years)
Name of the Company Before
merger (X)
After Merger (Y)
Difference [D=X-Y] Difference D2
Tata Chemicals 1.39 0.93 -0.46 0.21 Reliance Power 0.1 0.83 0.73 0.53 Bharathi Airtel 0.47 0.36 -0.11 0.01 Abbott India 0 0 0 0.00 GTL Infrastructure 2.92 2.52 -0.4 0.16 ICICI Bank 5.61 4.6 -1.01 1.02 JSW ISPAT Steel 9.04 9.37 0.33 0.11 Reckitt Benckiser 3 2 -1 1.00 Fortis Healthcare 0.38 0.35 -0.03 0.00
Mahendra & Mahendra 0.77 0.26 -0.51 0.26
ΣD = -2.46 ΣD2=3.31
Table: 16 Student t-test results pre and post merger and Acquisition performance
Financial ratio σ t-test value
Pre merger Total debt to long term funds to post merger Total debt to long term funds
-0.615 0.774 -1.589
Table: 17 Student t-test results pre and post merger and Acquisition performance of all financial ratio
This techniques helps to make proper interpretation like if the t-value show that the positive sign it refers to the level of significance comparable with the mean it refers to increase in ratio, the negative sign it refers to the level of significance comparable with the mean it refers to decrease in ratio, the sign which no change and its nearer and equivalent to the mean than it refers to a statistically significant.
The liquidity ratio like current ratio and quick ratio improved after merger and acquisition and it is statistically insignificant.
In case of the profitability parameters like ROCE, ROA, RONW, Return on long term funds are improved, Return on long term funds, ROCE ,ROA are statistically significant but in case of RONW it has decreased after the merger and acquisition
The leverage ratios like debt equity ratio and total debt to long term funds improved after the merger and acquisition. Both debt equity ratio and total debt to long term funds have increased and statistically significant
Financial ratios σ t-test
value
Level of significa nce
Premerger current ratio to post merger current ratio 0.1625 2.57 0.126 0.1533
Premerger liquid ratio to post merger liquid ratio 0.8175 5.09 0.32 0.741
Premerger ROCE to post merger ROCE -1.71 11.8 -0.29 0.847
Premerger RONW to post merger RONW 0.436 248.81 -1.30 0.176
Premerger debt equity ratio to post merger return on long term funds
-6.123 0.889 0.980 0.460
Premerger return on long term funds to post merger return on long term funds
81.86 10.82 -1.13 0.000
Premerger return on assets to post merger return on assets
20.13 20.13 8.12 0.000
Premerger total debt to long term funds to post merger total debt to long term funds
V.
LIMITATIONS OF THE STUDY
The period of the study up to 2012, since 3 years post merger and acquisition performance data are required for the research.
The research only confined long term performance measures, so short term returns are not taken in to consideration in the announcements of merger and acquisition results.
The results are not compared with the control firms.
VI.
CONCLUSION
The study shows that the liquidity positions of the merger and acquisition has improved but it is not statistically insignificant. The results are similar to Pawaskar (2001).the profitability position of the companies has positively increased in terms of return on capital employed, return on long term funds, and return on assets and it declines in terms of return on net worth. the financial performance of the firms improved after merger in terms of current ratio, liquidity ratio, ROCE, ROA, return on long term funds but most of the ratios are statistically insignificant, the there is a need to further study on the motive behind the merger and acquisition. Also the financial performance is not only a tool for merger and acquisition success. The further research having scope of study to compare integration activity firms and without conglomerations
REFERENCES
Journal Papers:
[1]. Laamanen T Keil.T. performance of social acquires: towards an acquisition program perspective , strategic management journal,29(6)2008,663-672
[2]. Ghosh . A, “Does operating performance really improve following corporate acquisition?”Journal of corporate finance,7(2),2001,151-178.
[3]. Hitt .M, Ireland D and Harrison J.Merger and acquisition: A value creating and value destroying strategy?
[4]. Morosini P. Shane.S and singh H. national cultural distance and cross border acquisition performance. Journal of international studies,29(1),1998,137-158.
[5]. Vanitha,S and Selvam,M.”financial performance of Indian manufacturing company during pre and post mergers. International research journal of finance and economics,12
[6]. Pazarskis,M.,Vogitzogoly,M.,Christodoulou,P., and Drogalas,G.,.”Exploring the improvements of corporate performance after merger-The case of Greece”. International research journal of finance and economics, Vol.6, 2006,184.
[7]. Pawaskar,V.”Effects of mergers on corporate performance in india”.Vikalpa, vol.26 (1), 2001.
[8]. Kumar.R.,. “Post-merger corporate performance: An Indian perspective”, management research news,32(2),2009,145-157.
[9]. Books:
[10]. Ross and Westerfield, Advance corporate finance. (Englewood Cliffs, NJ: Prentice-Hall, 1966 [11]. Harward Business reviews, Mergers and acquisition,(HBR publications,2010 )