What Does CEOs' Personal Leverage
Tell Us About Corporate Leverage?
HEnrik CrOnqvis T
AniL k . MAkHijA
sCOT T E. YOnkEr
nO 67 — augus t 20 09a r e s e ar ch r e p o r t fr om Ins tIt u te fo r fInan cIal r e s e ar ch
SIFR – the Institute for Financial Research is an independent non‐profit organization established at the initiative of members of the financial industry and actors from the academic arena. SIFR started in 2001 and is situated in the center of Stockholm. Professor Per Strömberg serves as director of the institute. The mission of SIFR is to:
• Conduct and stimulate high quality research on issues in financial economics, where there are promising prospects for practical applications,
• Disseminate research results through publications, seminars, conferences, and other meetings, and
• Establish a natural channel of communication about research issues in finance between the academic world and the financial sector.
The activities of SIFR are supported by a foundation based on donations from Swedish financial institutions. Major donations have been made by: AFA, Alecta, Alfred Berg, AMF Pension, Brummer & Partners, Carnegie, Danske Bank, Handelsbanken, Kapitalmarknads‐ gruppen, Länsförsäkringar, Nordea, and Svenska Fondhandlareföreningen.
In addition, SIFR is directly sponsored by some institutions. Nasdaq OMX funds research projects and several positions at SIFR, including the Olof Stenhammar professorship in financial entrepreneurship. Stockholm School of Economics funds two research positions, and Sveriges Riksbank funds a visiting professorship at SIFR.
SIFR also gratefully acknowledges research grants received from Stiftelsen Bankforsknings‐ institutet, Föreningsbankens Forskningsstiftelse, Jan Wallanders och Tom Hedelius Stiftelse, Riksbankens Jubileumsfond, Johan och Jakob Söderbergs Stiftelse, Torsten och Ragnar Söderbergs Stiftelser, and Foundation for Economics and Law.
What
Does
CEOs’
Personal
Leverage
Tell
Us
About
Corporate
Leverage?
Henrik
Cronqvist,
Anil
K.
Makhija,
and
Scott
E.
Yonker
What Does CEOs’ Personal Leverage Tell Us About
Corporate Leverage?
∗Henrik Cronqvist
Robert Day School of Economics and Finance Claremont McKenna College
Anil K. Makhija Fisher College of Business The Ohio State University makhija 1@fisher.osu.edu Scott E. Yonker
Fisher College of Business The Ohio State University
yonker 8@fisher.osu.edu This draft: July 28, 2009
Abstract
We find that firms behave remarkably similarly to how their CEOs behave personally when it comes to leverage choices. We start our analysis by compiling a comprehensive sample of home purchases and financings among S&P 1,500 CEOs. Debt financing in a CEO’s most recent home purchase is used as a revealed preference of the CEO’s personal attitude towards debt. We find a robust positive relation between personal and corporate leverage. We also find that firms tend to hire CEOs with a similar personal attitude towards debt as the previous CEO. When the new and previous CEOs have different personal preferences, corporate leverage changes in the direction of the new CEO’s personal leverage. These results support a model with endogenous matching of CEOs to firms. We also find that the positive relation between CEOs’ personal leverage and corporate leverage is stronger in firms with poor governance, suggesting that CEOs imprint their personal preferences on the firms they manage when they are able to do so. These results suggest that heterogeneity in CEOs’ personal attitudes towards debt partly explains differences in corporate capital structures, and suggest more generally that an analysis of CEOs’ personalities and personal traits may provide important information about the financial policies of the firms they manage.
∗Contact: Anil K. Makhija, Rismiller Professor of Finance, Fisher College of Businesss, The Ohio State University,
Columbus, Ohio, 43210. We appreciate comments by Sumit Agarwal, Brent Ambrose, Zahi Ben-David, Harry DeAngelo, Rudi Fahlenbrach, Eric Helland, David Hirshleifer, Eric Hughson, Andrew Karolyi, Tim Loughran, Angie Low, Enrico Perotti, Tony Sanders, Hersh Shefrin, Janet Smith, Meir Statman, Per Str¨omberg, Ren´e Stulz, Dick Thaler, Michael Weisbach, Robert Yonker, and seminar participants at Amsterdam Business School, Chapman University, Claremont McKenna College, Erasmus University, European Summer Symposium in Financial Markets in Gerzensee, Nanyang Technological University, and Sungkyunkwan University. We thank Alexander Bonnett, Rishi Desai, and Jennifer Volk for outstanding research assistance and Rudi Fahlenbrach for providing data on founder CEOs. Cronqvist is thankful for research support provided by the Financial Economics Institute (FEI) at Claremont McKenna College.
I
Introduction
Since the beginning of modern capital structure research (Modigliani and Miller, 1958), financial economists have devoted significant effort to analyzing the determinants of corporate financing policies. The focus of most empirical work has been on examining whether market-, industry-, and/or firm-level characteristics can systematically explain corporations’ leverage choices. Examples of firm characteristics that have been studied extensively are taxes, transactions costs, agency costs, and costs of financial distress.1 However, there has been less focus in the corporate finance literature on the effects of personal characteristics, such as the specific traits and the personality of a firm’s top-executive, the Chief Executive Officer (CEO).
Many empirical studies assume, at least implicitly, that the traits of a firm’s CEO are not important for corporate capital structure decisions. One possibility is that CEOs tend to be more or less homogenous in terms of characteristics that may matter for capital structure choices of firms if it takes a certain type of person to rise to the top of a firm. CEOs are then perfect substitutes for one another, and for this reason, their specific traits do not matter. Another possibility is that there may exist real heterogeneity between CEOs, for example, in their personal preferences or personal attitude towards debt and financial leverage. But these differences may not translate into effects on firms’ capital structures if a single CEO can not impact such policies, or corporate governance structures effectively restrain CEOs from imprinting their personal preferences on the firms they manage. In either case, the prediction is that firms in the same industry with similar firm-level characteristics will choose similar capital structures despite being managed by different CEOs.
The hypothesis we set out to analyze empirically in this paper is that the specific personal traits of CEOs matter for corporate capital structure decisions. We base such a hypothesis on recent empirical evidence and discussion in corporate finance research. For example, in an extensive review of empirical papers, Parsons and Titman (2007) argue that there exist several difficult to measure
1A number of firm-level characteristics have been found to be significantly related to corporate capital structures.
Frank and Goyal (2007a) study the leverage decisions of U.S. public firms for the period 1950 to 2003, and find that the most important firm characteristics are median industry leverage, market-to-book ratio, firm size, profitability, tangibility, and expected inflation. Graham and Harvey (2001) use survey data to study capital structure decisions. They also focus on characteristics at the firm-level but note that some models, such as agency models, may not be examined using a survey research methodology.
CEO characteristics which may impact capital structures, including “managerial preferences” (p. 24). Some studies show that CEOs are key to understand corporate decision-making.2 For example, Bertrand and Schoar (2003) document significant CEO fixed effects in a set of corporate policies, such as capital structure decisions, and argue that such effects may represent heterogeneity in “preferences, risk aversion” (p. 1174). However, we are not aware of any empirical analysis specifically on a relation between CEOs’ attitudes towards debt and capital structures in the firms which these CEOs manage. Recent papers which have analyzed CEO characteristics (e.g., Frank and Goyal (2007b) and Graham et al. (2008)) have examined important characteristics but not the effect of
CEOs’ personal attitude towards financial leverage.3
In this paper, we will attempt to measure the personal attitude towards financial leverage in the cross-section of CEOs and then relate those personal preferences to firms’ capital structure decisions. It is extremely difficult to measure or otherwise elicit CEOs’ attitudes without the ability to perform experiments with our sample of CEOs as subjects. We therefore propose the use of CEOs’ debt ratios, i.e., their mortgage to purchase price ratios in their most recent purchase of a primary residence, as a revealed preference of their personal attitude towards debt. We consider this to be a reasonable approach for several reasons. First, it is a “revealed preference approach” to elicit CEOs’ personal attitudes towards financial leverage.4 Second, the personal preference we attempt to elicit comes from the same domain (financial decision-making) as the policy we analyze, corporate leverage. Finally, a primary residence purchase is an important decision for many CEOs, and the mortgage is likely the most important source of debt for many CEOs. Based on the above, we hypothesize that a CEO’s personal home leverage may tell us something about the CEO’s personality, and specifically, how comfortable the CEO is with financial leverage and how conservative he is when it comes to financial decision-making.
2For a recent overview of research on CEOs, we refer to Bertrand (2009).
3We have referenced several empirical studies, but it is worth noting that we are not aware of much theoretical work
which incorporates heterogeneity in CEOs’ personal traits into a model of corporate capital structure decisions. Two exceptions are Cadenillas, Cvitani´c, and Zapatero (2004) and Hackbarth (2008). Cadenillas, Cvitani´c, and Zapatero model the relations between managerial risk aversion, leverage, and CEO compensation contracts. In Hackbarth, the CEO characteristic which is modeled is optimism or overconfidence, traits which we do not measure in this paper.
4Other researchers have previously measured specific traits of CEOs also using a revealed preferences approach. For
example, Malmendier and Tate (2005, 2008) measure CEO overconfidence by examining whether CEOs persistently choose not to exercise in-the-money call options on their own company stock.
Why then may we expect personal and corporate leverage to be related? One possibility, which we call the “hedging” view, is that CEOs with more personal home leverage prefer lower corporate leverage to countervail their high personal financial risk in their overall portfolio. Such an effect assumes that excessive corporate leverage is not costless for the CEO personally. Corporate financial distress may be costly if the CEO loses his job and firm-specific human capital investment, and there are frictions in the the labor market for executives.5 These arguments predict an inverse relation between personal CEO leverage and the financial leverage in the capital structure of the firm which the executive manages, as the CEO considers corporate as well as personal leverage when making decisions.
Another possibility is that CEOs (and any other individual for that matter) possess individual-specific personal preferences regarding financial leverage and debt, and there is heterogeneity in these attitudes across CEOs. That is, some prefer more financial risk while others prefer less.6 As a result, CEOs may differ in their “match quality” with firms, and CEOs who have a higher propensity to bear financial risk are, in such a model, expected to match in equilibrium with firms that have higher leverage. Alternatively, a specific debt preference steers both CEOs’ personal and corporate leverage decisions in the same direction, so that those who prefer more leverage personally are expected to manage firms with more aggressive capital structures, and vice versa.7 These arguments predict a positive relation between personal and corporate leverage.
We start our empirical analysis by following Liu and Yermack (2007) in constructing a database with detailed information on CEOs’ primary residences and their mortgages. Liu and Yermack find that firm performance deteriorates when CEOs acquire extremely large properties, but they do not
5For evidence on costs of financial distress for firms, see, e.g., Warner (1977) and Andrade and Kaplan (1998),
and see Weisbach (1988) and Warner et al. (1988), for example for evidence of high CEO turnover among financially distressed firms.
6Where would such heterogeneity in attitudes towards financial leverage come from? While an interesting research
question which we want to address in future work, it is beyond the scope of the current paper. In this paper, we may only speculate – based on existing research – that prior experience is one determinant. For example, Graham and Narasimhan (2004) find that CEOs’ professional (and perhaps also personal) experiences during the Great Depression affected their firms’ capital structures in the following decade. Malmendier and Nagel (2007) report that an individual’s experience of a macro-economic shock may affect risk-taking decades later.
7The pursuit of leverage with similar aggressiveness in the personal and corporate domain may arise from a desire
to avoid cognitive dissonance. Cognitive Dissonance Theory is a well-established theory in psychology about the discomfort individuals feel when “having opinions that do not fit other opinions that they have” (Festinger, 1957, p. 4).
analyze the effects of the financing of these homes on corporate capital structures. Our sample consists of S&P 1,500 firms. The personal leverage data are hand-collected from LexisNexis and public records on county assessor, auditor, and recorder websites. We find that 67 percent of the CEOs use a mortgage at the time of the home purchase. Conditional on using a mortgage, the median mortgage to purchase price ratio is 66 percent. Importantly, we find significant heterogeneity in personal leverage across CEOs: the range is from 0 to 100 percent home leverage and the standard deviation is 34 percent. Some CEOs are found to be much more comfortable with personal financial leverage compared to others, even when controlling for important economic determinants of home leverage, such as the geographic region of the home or interest rates at the time of the purchase.
We regress corporate leverage on personal leverage, and find a positive and statistically significant relation. The economic magnitude of the estimated effects is large. Suppose we compare two CEOs, one with the median personal leverage, measured by the mortgage to purchase price ratio in the most recent home purchase, and one with a one standard deviation lower home leverage. The difference in corporate leverage is about 2.4 percentage points. Because the median (market-based) corporate leverage ratio is 12 percent in our sample, this translates into a 20 percent lower corporate leverage. We also show that the presumably most conservative CEOs, i.e., those who are found to “never lever” (at the time of the home purchase or any other time), have 4.2 percentage points lower corporate leverage. We show in the paper that these basic results are robust to an extensive set of controls and robustness checks.
Why are personal and corporate leverage positively related? We examine several possibilities, and find support for two explanations. First, we consider an explanation based on sorting and endogenous matching of CEOs to firms. We analyze CEO changes and subsequent corporate leverage changes. When we regress a new CEO’s personal leverage on the previous CEO’s personal leverage, we find a positive and statistically significant relation. This result is suggestive of an endogenous CEO-firm matching explanation in which a firm’s board tends to replace a CEO with a specific personal attitude towards financial leverage with a new, similar CEO. Explanations for such matching include efficient risk allocation such that CEOs who are willing to bear more financial risk match better with firms for which higher leverage is optimal. While statistically significant,
the correlation is far from one, meaning that sometimes firms select a new CEO with different personal leverage than the previous CEO. When we regress changes in corporate leverage on changes in personal leverage and control variables, we find a positive and statistically significant effect. That is, firms change corporate leverage in a way that is, in part, predicted by the difference in personal leverage between the new and previous CEOs. So, when the new CEO is more financially conservative based on his personal leverage, we find that the firm tends to reduce its corporate leverage. It is of course possible that the new CEO was selected precisely to change the firm’s capital structure in this direction.
Second, the positive relation between personal and corporate leverage may be explained by CEOs imprinting their personal preferences on the capital structures of the firms they manage, even if not optimal for the value of the firm. If CEOs imprint their personal preferences, governance may play an important role. Specifically, we expect that in poorly governed firms, CEOs most easily imprint their personal preferences. We analyze three measures of governance: the percentage incentive-based pay, board size as a measure of board governance, and the G-index. We find that the positive relation between CEOs’ personal leverage and corporate leverage is significantly stronger in firms with poor governance using two of these three measures. These results suggest that matching of CEOs to firms is not the only explanation for the positive relation between personal leverage and corporate leverage.
Our paper is related to the previously mentioned research and several other empirical studies. First, existing evidence suggests that when CEOs have more discretion over their firms’ capital structures and are more poorly governed, they tend to prefer lower corporate leverage (e.g., Berger et al. (1997)). Executives may prefer less leverage than optimal because they prefer to reduce firm risk to protect their undiversified human capital (Fama, 1980). Conversely, Harris and Raviv (1988) and Stulz (1988) have suggested that CEOs may prefer to increase corporate leverage above the optimum, in order to increase their control and fend off takeovers. Our results show that there is significant heterogeneity in the cross-section of CEOs. Some CEOs prefer lower financial leverage, but others have a high tolerance for debt, both personally and in the firms they manage. That is, CEOs who are poorly governed may not necessarily reduce corporate leverage, but the CEO’s
specific personal attitude towards financial leverage seems to matter. Our paper is also related to recent studies which have focused on personal traits other than personal attitude towards debt, e.g., CEO overconfidence. Ben-David et al. (2006) find that firms with overconfident CEOs (based on surveys) use more long-term debt in their firms’ capital structures.
The rest of the paper is organized as follows. In Section II, we describe the construction of our new database of CEOs’ primary residences and personal leverage. In Section III, we study the relation between personal CEO leverage and corporate leverage. In Section IV, we analyze CEO changes and changes in corporate leverage. In Section V, we explore what may explain the significant relation between personal and corporate leverage. Section VI concludes.
II
The Personal Leverage of CEOs in the U.S.
In this section, we describe the construction of a new database of CEOs’ primary residences and mortgages. We report summary statistics for CEO home characteristics and personal leverage. Finally, we estimate an empirical model of the economic determinants of personal leverage among CEOs of large U.S. firms.
A Sample Construction
We construct a database with detailed information on CEOs’ primary residences and mortgages.8 Our starting point is all CEOs of the largest U.S. firms – the S&P 1,500 set of firms – in 2004. We choose the year 2004 because it is recent enough that there is reasonable coverage by our primary source of data (see below for details). We identify the CEOs using Standard and Poor’s ExecuComp database. In total, there are 1,699 CEOs since the index was revised during the year by replacing some 199 firms. As is standard in empirical research on capital structures, we drop all financial and utility firms (SIC codes 4813, 4911, 4931, 6020, 6311, and 6331) as they are subject to capital
8In this paper, we focus on CEOs, and not CFOs, because it is costly to collect data on all executives. CFOs report
to CEOs, not vice versa, so CEOs sign off on important capital structure decisions. That is, a CFO’s proposed action is by definition filtered through the CEO. CEOs who are more directly involved in financing decisions may simply direct CFOs to implement their specific capital structure choice. CEOs may also hire their “likes” as their CFOs. Finally, as shown by Chava and Purnanandam (2009), it is possible that CEOs matter for capital structure choices, while CFOs may matter relatively more for, e.g., debt-maturity decisions, which we do not analyze in this paper.
structure regulations (339 firms). We also drop nine firms headquartered outside the U.S. because of lack of real estate data. This results in a sample of 1,351 CEOs.
Data availability for the personal leverage and mortgage variables varies somewhat across states, and to a smaller extent across counties within a state. The following states do not provide public records of mortgages or other key variables (e.g., purchase price) required for the computation of our personal leverage measure: Alaska, Delaware, Iowa, Idaho, Indiana, Kansas, Louisiana, Maine, Minnesota, Missouri, Mississippi, Montana, Nebraska, New Hampshire, Nevada, Oklahoma, Oregon, Pennsylvania, Texas, Utah, and Wisconsin. Included in our sample are states that closely resemble the excluded ones in terms of real estate prices and we also estimate a model with state fixed effects. As a result of data unavailability, the sample is reduced to 942 CEOs.
We hand-collect data on these CEOs’ primary residences and mortgages using several data sources and following Liu and Yermack (2007). We use mainly the Nexis online database of public records, www.nexis.com/research. In this database, we are able to search tax assessment, deed transfer, and mortgage records for each of the CEOs in our sample. In a select few cases, we have supplemented the data from Nexis by searching various county assessor, auditor, and recorder websites. We now describe this search and sample construction process in more detail.
For each CEO, we start by performing a name search using the first name, middle initial, and last name from the ExecuComp database. We restrict this search to individuals with age +/– 1 year of the CEO’s age because some of them have common first and last names, such as Gary B. Smith, the CEO of Ciena Corp. The vast majority of the CEOs and their residences were identified in this straightforward way. In a few cases where there are several individuals with exactly the same name and age, we use SEC filings and voter registration records to try to identify the CEO’s home.9
For estate planning, tax, or other reasons, sometimes a trust is recorded as owner of the CEO’s home. When the trust has a different name than the CEO, he or his spouse are recorded as sellers of the property or as trustees and thus are still in the database. In addition, listed on some records may be the name of the CEO’s spouse, commonly with the label “Husband and Wife.” Spousal names may in some cases be found in the firm’s SEC filings. Additional records are in some cases
9There are eight CEOs with the last name “Smith” in our sample. We are able to identify the primary residence
located through a search based on these trust or spousal names.
We focus on a CEO’sprimary residence, as it constitutes the vast majority of most CEOs’ real estate holdings. In many cases, the primary residence is listed as “Owner Occupied.” Listed on all records is the mailing address for tax purposes, which is often the CEO’s primary residence address (but it may also be the address of the corporate headquarters). When CEOs own multiple homes in the area of the corporate headquarters, we classify the largest property as the primary residence if we do not find information from other data sources suggesting otherwise. By their specific location, some homes are determined to be recreation homes or the like, such as a golf community condominium in Hawaii for a California-based CEO. By reviewing all the records for a CEO, we are able to determine the primary residence of 709 CEOs (75.3% of the sample).
Once all primary residence and mortgage records are located, we collect data on the purchase price of each CEO’s most recent primary home, as well as details regarding mortgages and refinancings.10 In addition, we record characteristics of the homes (e.g., the number of bedrooms). When available, we record the loan type and the mortgage rate. In addition, we supplement these data with estimated current market values of the homes from Zillow, www.zillow.com.
B Summary Statistics: CEO Home Characteristics
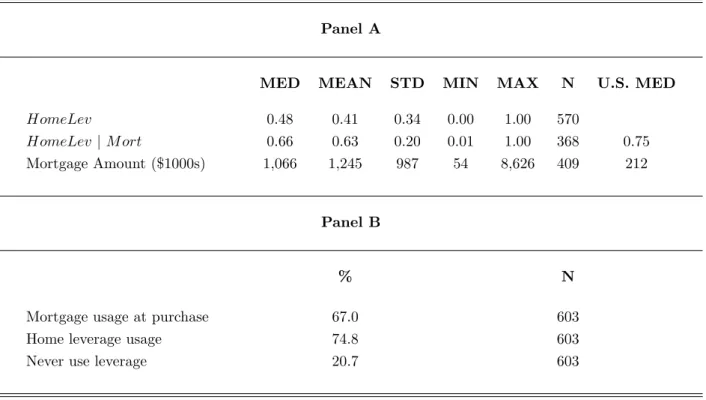
Table I reports descriptive statistics for our database of CEOs’ primary residences. In Panel A, the number of observations (N) varies across variables because property records are sometimes incomplete and vary by county. We find that the median CEO home is large at 5,180 square feet and was built on 1.1 acres of land in 1989.11 There is, however, significant variation in home size because the standard deviation is 2,800 sq. ft. Some CEOs prefer significantly larger homes compared to others. For example, one CEO resides in a 22,371 square feet home, a measure which does not include three additional smaller houses or servants’ quarters on the estate, nor a 24,000 square feet indoor pool. The median CEO home has 11 rooms, whereof four are bedrooms, and in addition,
10We recorded executive loans from the company, but found them to be very rare in our sample, probably because
Sarbanes-Oxley (SOX) bans such loans to CEOs. From the 477 pre-2002 CEO home purchases, we identify only five such loans.
11We coded condominiums as having zero land size and they are not included in the land size statistics. Land sizes
there are five bathrooms. All of the distributions of house size or estimated market values are found to be skewed to the right.
The table also reports data on purchase prices and estimated market values. The median CEO purchase price is $1.651 million in 2005 home price dollars. The purchase prices have been adjusted using the Office of Federal Housing Enterprise Oversight’s National Home Price Index. Current market values are very difficult to estimate without actual real estate transactions for the properties, in particular for high-priced CEO homes for which the market is illiquid and there are not many reasonable benchmark transactions. Based on assessment records, the market value of the median CEO home is $1.480 million in 2005 dollars.12 Based on Zillow’s “Zestimates,” the market value of the median CEO home is $1.679 million. The highest estimated market value in our sample is $43.6 million from assessment records, and $39.1 million from Zillow.
In the last column of the table, we also compare the CEO homes to those of the median U.S. household based on data from the Bureau of Census 2005 American Community Survey. These data show that the median home in the U.S. has five rooms, whereof three are bedrooms. At the median, these homes are 14 years older (built in 1975) than a CEO’s primary residence. In addition, we find that there is an almost 10-fold difference in the median market value based on assessment records: $1.48 million for CEOs versus $168,000 for the U.S. overall, in 2005 house price dollars. Though large, proportionately this difference is smaller than the pay difference between the groups. Kaplan and Rauh (2007) report that the median total compensation in 2004 for CEOs of non-financial firms was $2.54 million. This is nearly 57 times the $44,684 U.S. median household income reported by the 2004 American Community Survey.
Panel B of Table I shows that only 10.2 percent of the CEO homes are new constructions homes. These observations are more complicated when it comes to determining the purchase price for the home in addition to the land. But this statistic shows that this potential problem is relatively uncommon in our sample. For new construction homes, we use as the purchase price, the cost of the land plus the “construction cost,” when available, and otherwise the “improvement value” as stated
12The median market value from assessment records is lower than the median purchase price, both reported in 2005
home price dollars. One reason for this is that, because of data availability, we are comparing two different subsamples. Also, tax assessments are often lower than actual market values.
in assessment records. Not surprisingly, we find that 89.0 percent (5.6 percent) of the CEOs reside in the state (neighboring state) of their firm’s corporate headquarters, probably because of significant diseconomies of living far away.13 In a few cases, the CEO’s primary residence is thousands of miles from the corporate headquarters, such as one California-based CEO with a primary residence on the East Coast. We assume that these are cases where the CEO is reluctant to relocate the family at the start of his tenure, or he resides in close geographical proximity to the firm’s marketing and sales organization.
C Summary Statistics: CEO Home Leverage
With the objective of measuring personal tolerance for financial leverage in mind, we compute the leverage which each CEO uses in the purchase of his most recent primary residence. Specifically, HomeLevis the sum of the primary and secondary mortgage liens, at the time of the home purchase, scaled by the purchase price.14 In the real estate literature,HomeLev is commonly referred to as the combined loan-to-value (LTV) ratio.15
One problem caused by data unavailability is that the nonexistence of a mortgage record results inHomeLev= 0, though the reason could be: (i) that no mortgage was used; or (ii) missing data. To try to include the former but exclude the latter, we require the purchase price to be available for an observation to remain in the sample. Because it is difficult to determine the purchase price of new construction homes, we drop these observations for HomeLev, but we include them for measures of home leverage that do not require a measure of the purchase price (e.g., whether the CEO has a mortgage or not). In cases of intra-family real estate transactions, we search the Nexis database until we find an arms-length transaction and calculateHomeLev based on that.
13These numbers may be somewhat upwardly biased because one reason for not being able to definitively identify a
CEO and include him in our sample is that he resides very far from the firm’s headquarters.
14There appears to be no way for researchers to reliably measure CEOs’ personal leverage other than mortgages
and home equity loans/lines using U.S. data. However, these sources are likely the most common sources of debt because the interest rate is lower than for uncollateralized loans such as credit card debt, and mortgages are also special in that they come with interest deductability and thus should to be used as the first source of debt.
15The data on specifics on the mortgages are incomplete or not available, e.g., whether the mortgage was an
adjustable-rate mortgages (ARM), subprime, ALT-A mortgage, or the name of the bank which provided the mortgage. For example, we have data on ARMs for only 292 executives. We also have not cross-checked our database with HMDA or LPS/McDash data to examine whether the banks retain CEO mortgages in their portfolios or sold them in the secondary market.
Table II reports summary statistics for CEO home leverage. Panel A shows that the unconditional median HomeLevis 48 percent. However, we find a range from 0 to 100 percent leverage (i.e., no down-payment at all on the home).16 Also, the variation, as measured by the standard deviation, is very large at 34 percent. Conditional on having a mortgage, we find that the median CEO home leverage is 66 percent. Somewhat surprisingly, CEOs’ home leverage is only somewhat lower than the U.S. median, which is 75 percent in 2005, as can be seen in the final column of the table. We also see that the median mortgage of a CEO is $1.066 million, in 2005 home price dollars, while it is $211,900 overall in the U.S.17
Panel B reports that 67.0 percent of CEOs use a mortgage at the time of the purchase of their primary residence. We find that some CEOs obtain mortgages after the time of the home purchase: 74.8 percent of the CEOs use a mortgage backed by their primary residence at some point in time. For some CEOs, we find forms of home leverage other than mortgages. This debt includes revolving credit home equity lines/loans or other forms of short-term debt financing. The table shows that we found no evidence of any form of debt financing in the search process for 20.7 percent of the CEOs. We hypothesize that CEOs who “never lever” are particularly averse to the use of financial leverage, and this personal preference may be apparent also in their firms’ capital structure choices.
D Determinants of CEOs’ Personal Leverage
We now turn to the question of what determines CEOs’ personal leverage. That is, why do some CEOs use relatively more debt to finance their primary residence than others? One plausible reason is a greater personal tolerance for debt and financial leverage. However, we also recognize several other potentially important determinants: CEO characteristics (e.g., age), the geographic region of the home, the macroeconomic conditions (mortgage rates) at the time of the house purchase, and tax optimization.
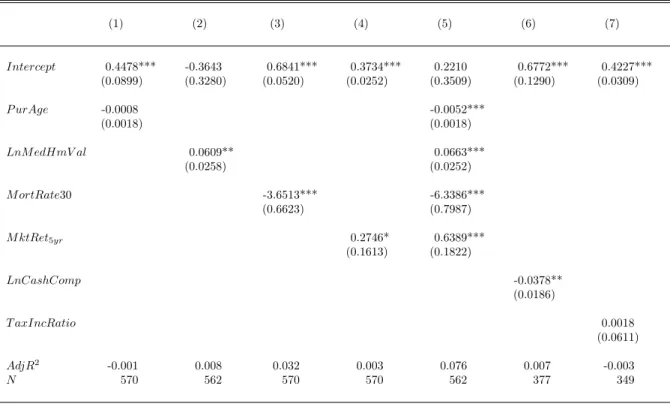
Table III reports results from regressing HomeLevon a set of potential determinants of CEOs’ personal leverage. In column (1), we include the CEO’s age at the time of the home purchase
16In a few cases, mortgage records suggest slightly above 100 percent leverage, presumably for financing of home
improvements or closing fees, but we censor the home leverage distribution at 100 percent.
17In 2005, the threshold for ”jumbo” mortgages from Fannie Mae and Freddie Mac was $359,650. The vast majority
(P urAge). We expect a negative coefficient on P urAge because older CEOs are likely to have accumulated more wealth and need smaller mortgages. In column (2), we include the log of the median home price in the geographic region (county) where the CEO’s home is located (LnM edHmV al). We expect that CEOs who reside in regions where residential real estate is relatively more expensive use more debt, all else equal. In column (3), we include the 30-year fixed mortgage rate at the time when the CEO purchased the home (M ortRate30). We predict an inverse relation between mortgage financing rates and the amount of debt taken on by the executive. In column (4), we include the 5-year lagged market return prior to the time when the CEO purchased the home (M ktRet5yr). CEOs with more wealth are expected to take on smaller mortgages. In column (5),
we include all of these potential determinants at the same time.18
We find support for several of our predictions. First, we find that indeed older CEOs use less leverage in their homes: ten years reduce personal home leverage by about 5.2 percentage points. Second, we find that CEOs in geographic regions with relatively higher real estate prices are significantly more levered in their homes. Where to live is an endogenous choice, but living very far from the corporate headquarters is associated with significant diseconomies for most CEOs, so executives are commonly constrained to live in the region of the corporate headquarters. That is, some markets, even for CEOs, require more financial leverage. For example, the difference between Los Angeles county in California and Cuyahoga county in Ohio implies 7.7 percentage points higher home leverage. We also find that CEOs who purchased their homes when mortgage rates were relatively low use more leverage: a 100 basis points lower 30-year fixed rate implies about 6.3 percentage points more home leverage, ceteris paribus.19 Finally, we find that higher stock market returns in the past five years result in use of less leverage by CEOs, about 6.4 percentage point less leverage for every ten percent value-weighted market returns. That is, CEOs tend to keep their investments in the stock market after periods of relatively higher returns. The weak explanatory power (adjustedR2 of less than 10 percent) of the models explored in the table suggests that there is
18Untabulated regressions show that these results do not change if we also include home characteristics (square
footage, land size, purchase price, etc.). But because of the endogenous choice of the size of the home to consume, we choose not to include such variables in our reported model specification.
19This result is robust to using the spread of the 30-year fixed rate above the T-Bill rate or the London Interbank
a significant heterogeneity in personal leverage ratios which cannot be explained by these economic determinants, but which may measure a CEO’s personal and idiosyncratic preference for financial leverage.
For several reasons, it seems unlikely that heterogeneity in home leverage across CEOs is entirely caused by differences in personal tax status. First, the tax code in the U.S. allows married (single) taxpayers to deduct interest on home mortgages up to $1 million ($500,000).20 But out of the mortgages in our final sample, only 10.0 percent are exactly $1 million. Most of the CEOs in our sample have sufficiently high incomes to benefit from the maximum interest tax deduction. Still, it is not the case that CEOs lever up their entire home up to the $1 million. We find that only 11.9 percent of the CEOs have 100 percentHomeLev if their home purchase price is below $1 million or a $1 million mortgage if it is above the tax deductability threshold.21
Second, in column (6) of Table III we control for the ratio of a CEO’s total compensation which is not tax deferable (T axIncRatio), i.e., salary and other cash compensation (e.g., bonus) divided by total compensation. CEOs with a larger proportion of their compensation in the form of non-tax deferrable income may be expected to use more debt to reduce their taxes, but the estimated coefficient is close to zero (0.002) and not statistically significant. In column (7), we control for the log of the CEO’s total cash compensation. However, the estimated coefficient on this variable is negative and statistically significant, which seems to be more supportive of a capital constraints explanation rather than tax optimization.22
E Corporate Leverage Measures and Control Variables
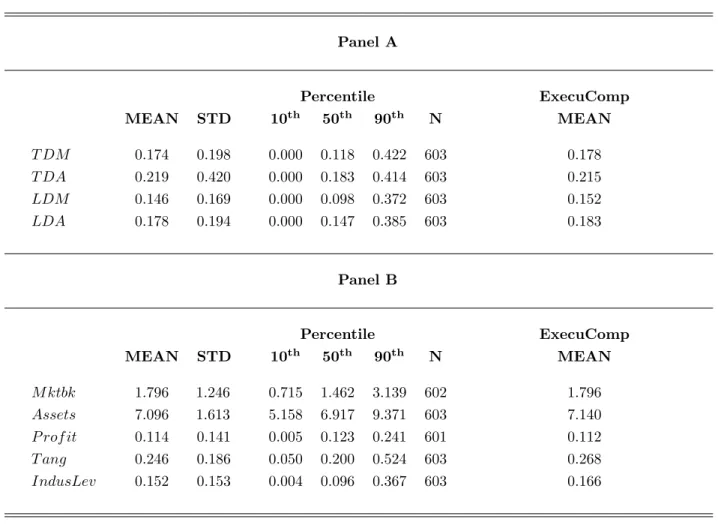
Table IV reports summary statistics for four different measures of corporate leverage commonly used in the corporate finance literature, as well as firm-level characteristics that are used in our analysis as control variables. The leverage variables are measured as of the end of 2004 to match
20For details, see http://www.irs.gov/publications/p936/ar02.html.
21This number increases to 21.1 percent if we assume that CEOs can only borrow 80% of their home value, so that
tax minimizers are CEOs who borrow 80% or more if the purchase price of the home is less than $1,250,000 or those who borrow exactly $1,000,000 if the purchase price of the home is greater than or equal to $1,250,000.
22The number of observations is reduced by about a third in columns (6) and (7) because we require data on the
CEO’s compensation at the time of the home purchase. In several cases such data are missing because the CEO purchased the home at a time when the CEO was not a top-executive covered by ExecuComp or before the start date of the ExecuComp database.
the CEO sample, and the controls are lagged by one year. These data are from S&P’s Compustat database. Detailed variable definitions are available in the Appendix. The number of observations (N) varies across variables because of data availability.
The final column of the table, “ExecuComp MEAN,” is reported as a comparison and shows the means for all U.S.-based, non-financial, and non-utility firms covered by ExecuComp in 2004. As can be seen, the difference in means between our particular sample firms and the firms covered in ExecuComp is very small. Overall, the firms we analyze in this paper are representative of these large U.S. firms when it comes to corporate leverage and firm characteristics.
III
Are Personal and Corporate Leverage Related?
Our analysis so far shows that there is significant heterogeneity in personal leverage across CEOs of large public U.S. firms and that the ability of economic predictor variables to explain these differences is limited. This suggests that something else could be driving differences in the observed leverage choices, i.e., variation in individuals’ debt tolerances. In this section, we examine whether personal leverage is related to corporate leverage.
A Regression Results
Table V reports results from regressing corporate leverage on personal leverage using ordinary least squares (OLS).23 We use a market-based measure of corporate leverage, the ratio of total debt to market value of assets (T DM). HomeLev is our measure of CEOs’ personal tolerance for debt financing. In column (1), we find that the estimated coefficient on home leverage is positive (0.0606) and statistically significant at the 5%-level (t-statistic = 2.43). We report White (1980) heteroscedasticity-consistent standard errors, and we allow for clustering of the standard errors at the industry-level in this model specification and in all other specifications reported in the paper.
In column (2), we include the following firm-level characteristics as control variables: the market-to-book ratio (M ktbk) as a measure of growth opportunities, the log of total assets (Assets) measuring the size of the firm, profitability (P rof it), and tangibility of the firm’s assets (T ang) as
a measure of collateral. In column (3), we control for industry leverage by includingIndustLev, the median total debt to market value of assets ratio in the firm’s industry (defined at the 4-digit SIC code level). In column (4), we include firm controls and control for industry leverage. Controlling for firm characteristics and industry leverage does not affect our result. According to column (4), which we label our “baseline” model in the rest of the paper, we find that the estimated coefficient on HomeLev is positive (0.0700) and statistically significant at the 1%-level (t-statistic = 3.53). We also note that the firm-level control variables have the expected signs.24
The relation between personal and corporate leverage is very robust. Frank and Goyal (2007a) explore the relative importance of a large number of potential firm controls for leverage choices. As a result, we include the ones they find to be the most reliable as our control variables. These controls are similar to those used in other empirical analysis of corporate capital structures (e.g., Rajan and Zingales (1995)). In untabulated regressions, we have also checked that our results are robust to the inclusion of an extensive set of other variables used in a working paper version of Frank and Goyal. For example, we included Sales instead of Assets, a different collateral measure (inventory plus net property, plant, and equipment scaled by assets) instead ofT ang, and we included Zscore of Altman (1968). None of these changes to our model specification change our results.
We note that some recent research on capital structure decisions suggests that firms tend to be relatively slow at rebalancing their capital structures (e.g., Leary and Roberts (2005), Kayhan and Titman (2007), and Lemmon et al. (2008)). As a result, firms’ observed leverage levels may be imprecisely measured. With persistent shocks to capital structures, cross-sectional regressions may have low power to pick up systematic variation. However, this does not seem to be a problem in our regressions because the measures of personal leverage as well as the firm-level characteristics are all statistically significant in the table. That is, however imprecisely measured capital structures are, we are able to find many significant capital structure determinants.
In column (5) of Table V, we examine non-linear effects of personal home leverage because it may be that only the executives with the highest home leverage find it optimal to countervail their personal debt through corporate capital structure decisions. That is, we may find an inverse relation
24We also check that our results are robust to dealing with potential outliers by winsorizing the data at the 0.5%-level
between personal and corporate debt, but only for the CEOs who are the most highly levered in their homes. We choose an 80 percent cutoff because of the norm in the U.S. mortgage industry related to down payments. CEOs with more than 80 percent personal leverage have chosen to deviate from the norm and expose themselves to particularly high financial risk and may choose to offset such risk through the firm’s leverage choices. We defineHL80 as an indicator variable which equals one if HomeLev > 0.80, and zero otherwise. However, we find no evidence of non-linear effects. This result shows that we find no evidence of CEOs attempting to offset their personal financial risk by changing their firms’ leverage in a countervailing fashion, not even among those who are the most levered.
One concern is thatHomeLev may proxy for regional effects because of a possible systematic relation between geography, personal, and corporate leverage decisions. Variation in taxes across states is one example. In column (6), we therefore include state fixed effects in our baseline model. However, we find that controlling for regional differences does not change our results.25 Related to geographic variation, we also note that there is evidence in the corporate finance literature that rural firms have somewhat more debt in their capital structures than similar urban firms, possibly because of differences in information asymmetries (e.g., Loughran (2008)). However, for such a result to explain the CEO home leverage effect, it has to be that CEOs of rural firms have more mortgage debt than CEOs of urban firms, something we consider unlikely given our findings regarding regional housing prices and personal leverage in Section II.D.
B Economic Magnitude of the Results
The magnitude of the estimated effect of personal leverage is large. One example which illustrates this involves the two extreme personal leverage values. A firm with a CEO with 100 percent home leverage has a debt ratio which is 7.0 percentage points higher than a similar firm with a CEO with zero debt. We may also compare two CEOs, one with the median home leverage in our sample and another with one standard deviation higher leverage. The estimated difference in corporate leverage is about 2.4 percentage points (= 0.070×0.34). Given that the median total debt to market value
25We have checked that our results are robust to allowing for clustering of the standard errors at the state-level
of assets (T DM) ratio is 12 percent in our sample, this means about a 20 percent higher corporate leverage. As a comparison, a one standard deviation change in firm size (measured by total assets) corresponds to about 27 percent higher leverage. The effect of a corresponding market to book change is similar, and the effect of a profit change is also of this magnitude. Thus, we find that the effect of personal leverage on corporate capital structures is about three-quarters of the size of what are arguably the three most important firm-level determinants of firms’ leverage choices.
Another way to illustrate the economic significance of our results is to consider how much HomeLev adds to the explanatory power of the model for corporate leverage. Untabulated regressions indicate that personal leverage adds about 1.5 percentage points to the adjusted R2 of our leverage model, which for our baseline model is 0.421. Not surprisingly, this is less than, e.g., industry or firm size, but interestingly, it is on par with the amount added by profitability, another important explanatory variable in capital structure choices.
What do our results tell us about the overall effect of CEOs’ personal debt preferences on corporate capital structures? To address this question we start by computing predicted corporate capital structures using the baseline model specification, with and without HomeLev. We then compute the absolute value of the difference between the predicted values from the two models as a measure of deviations directly related to our proxy for a CEO’s personal tolerance for financial leverage. In Figure I, we report a histogram of the resulting distribution of these deviations. We find that the median is 0.0234, with a range from 0 to 0.0487. That is, because of the effect of CEOs’ personal debt preferences, the median firm’s debt ratio deviates about 2.3 percentage points from the firm’s debt ratio as predicted by a standard model of capital structure. Given that the median T DM is 12 percent, this again shows the economic significance of our results.
C Effects of Home Purchase Timing
While we measure corporate leverage in the cross-section of firms in 2004, recall that data availability allows us to calculate HomeLev only at the time of the CEO’s home purchase. In Figure II, we report a time-line and a frequency distribution describing when the CEOs in our sample purchased their homes. We find that the median year in the figure is 1999. Thus, in 2004 the median CEO
had owned his primary residence for five years.
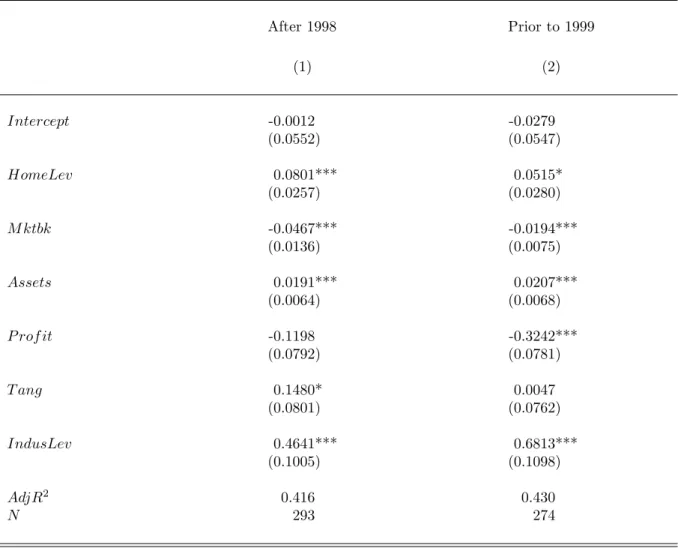
In Table VI, we examine if there is a differential effect of home leverage conditional on when the CEO purchased the home. In column (1), we examine 274 CEOs who purchased their home more recently, defined as less than five years prior to 2004. In column (2), we examine 293 CEOs who purchased their home more than five years prior to 2004. We find that both estimated coefficients are positive, 0.0801 and 0.0515. The first is significant at the 1%-level, while the second is significant at the 10%-level. There are two conclusions which can be drawn from this analysis. First, more recent home purchase transactions may be more precise estimates of CEOs’ personal tolerance for financial leverage, which can explain the stronger statistical significance for the recent purchases. Second, and most importantly, this evidence reduces concerns that an omitted variable simultaneously explains both personal and corporate leverage, because it shows thatHomeLev, even if measured more than five years earlier than corporate leverage, is still positively related to contemporaneous corporate leverage. Also affirming this, note that HomeLev is collected from different past years while corporate leverage is for 2004 only.
D Evidence from Alternative Measures of Personal Leverage
So far, we have used HomeLev, the mortgage to purchase price ratio, as a measure of a CEO’s personal tolerance for debt financing. One concern with this measure is the particular scaling (purchase price) used. As a result, we re-estimate our baseline model specification using several alternative measures of a CEO’s tolerance for financial leverage. These measures are not scaled by the purchase price of the home.
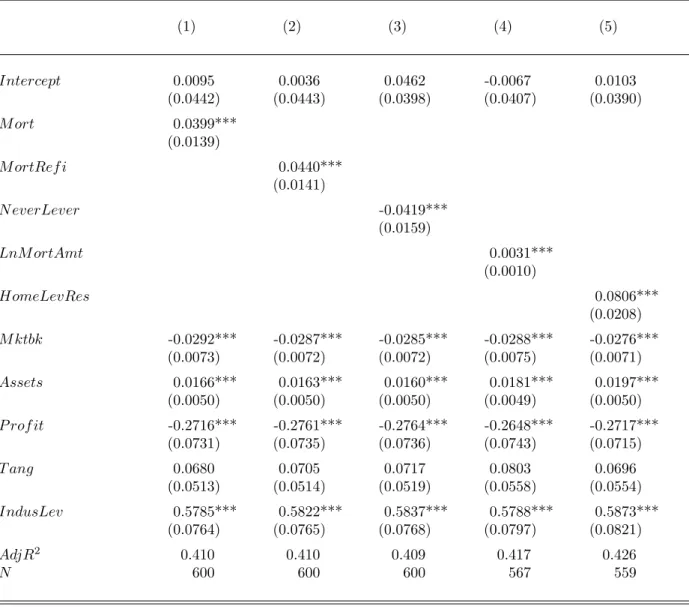
In column (1) of Table VII, we include an indicator variable (M ort) which is one if the CEO uses a mortgage at the time of the purchase of his primary residence, and zero otherwise. We find that the estimated coefficient is positive (0.0399) and significant at the 1%-level. That is, firms with CEOs with a mortgage have about 4.0 percentage points higher leverage than firms with CEOs without a mortgage. In column (2), we include an indicator variable (M ortRef i) which is one if the CEO uses a mortgage at the time of purchase or any other time, and zero otherwise. This effect is also statistically significant at all levels, and somewhat larger (4.4 percentage points). In column (3),
we include an indicator variable that is one if the CEO never used any mortgage, revolving credit home equity lines/loans, or other forms of short-term debt home financing, and zero otherwise, i.e., the CEO “never lever” (N everLever). This is the subset of CEOs who appear to be the most risk averse and prefer debt the least. We find that the capital structures of firms of CEOs who never lever are significantly different than those who are levered at some point. The difference is about 4.2 percentage points in terms of market-based debt ratios. These effects are large given a median leverage of 12 percent among our firms. In column (4), we include the log of CEO mortgage debt. We find that the estimated coefficient is positive (0.0031) and statistically significant at the 1%-level. That is, more CEO debt is associated with more leverage in the firm which the CEO manages.
In section II.D, we found several significant economic determinants of personal home leverage. We may therefore regress out these effects from HomeLevprior to relating the residual to corporate capital structures. Specifically, we defineHomeLevResto be the residual from column (5) of Table III. That is, HomeLevRes is the residual home leverage which is not explained by the CEO’s age at the time of the home purchase, the log of the median home price in the geographic region (county) where the CEO’s home is located, the 30-year fixed mortgage rate at the time when the CEO purchased the home, and the return on the market index during the five years previous to the home purchase.26 In column (5) of Table VII, we therefore include HomeLevRes. We find that the estimated coefficient is 0.0806 and statistically significant at the 1%-level, which confirms our previous result.
E Effects of Managerial Characteristics
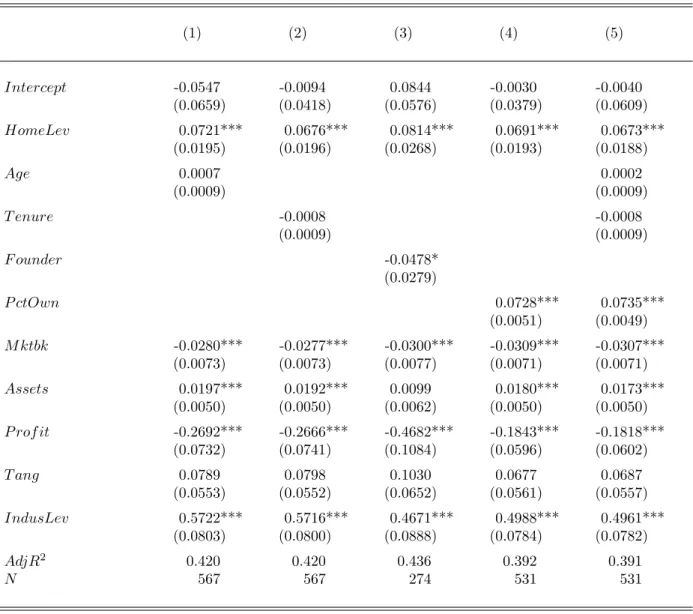
A concern with our empirical analysis so far is that our measure of personal debt preferences may be correlated with another CEO characteristic which explains our result. To reduce such concerns, Table VIII reports our baseline model specification with several managerial characteristics included. In column (1), we include CEO age (Age). This does not affect the magnitude of the estimated
26An example may rationalize this exercise. It may for example be argued that interest rates determine both
personal and corporate leverage (though we note that home leverage is typically not from year 2004, the year for which we measure corporate leverage). In column (5) of Table III, we regress out the effect of the 30-year fixed rate onHomeLev. As a result, theHomeLevResmeasure is orthogonal to home interest rates. A potential problem with
coefficient on home leverage – it is still positive and statistically significant at the 1%-level. In column (2), we include CEO tenure (T enure), but the coefficient estimate on HomeLev remains positive and strongly significant.
Another variable of importance is CEO wealth. We expect that wealthier CEOs may be less risk averse, and thus willing to lever up, both personally and in the companies they manage, because of the deductability of interest. In the U.S., it is not easy to measure CEO wealth.27 In this paper, we use two proxies. First, we control for founder-CEO status because founders are generally the wealthiest CEOs. It is possible that founder-CEOs may tolerate higher leverage in their homes and also in the firms they manage, which might explain our results. The data on founders are from Fahlenbrach (2008) and cover a subset of our sample firms. In column (3), we include an indicator variable that is one if the CEO is the firm’s founder, and zero otherwise (F ounder). However, controlling for founder-CEO status does not reduce the estimated coefficient on HomeLev, and the coefficient on F ounder is negative and significant at the 10%-level. That is, our results are inconsistent with wealthy founder-CEOs being responsible for the main result in this paper.
Second, in column (4) we control for the CEO’s percentage ownership stake in the firm at the end of the calendar year in 2003 (P ctOwn) because CEOs with larger ownership in their firms are likely wealthier than other CEOs. The ownership data are from ExecuComp and total shares outstanding are from the Center for Research in Security Prices (CRSP). However, controlling for CEO ownership does not reduce the estimated coefficient on HomeLev.28 The coefficient on P ctOwnis positive (0.0728) and statistically significant at the 1%-level.
Finally, in column (5) we include several managerial characteristics simultaneously. The effect of personal leverage remains positive (0.0673) and statistically significant at the 1%-level. The estimated coefficients on the managerial characteristics in the table are generally consistent with the result in Berger et al. (1997). They show that entrenched CEOs choose capital structures with less debt. Consistent with such entrenchment effects, we find that firms with founder CEOs have
27Studies which use data on CEO wealth (e.g., Becker (2006)) use data from other countries, such as Sweden, where
the government maintains detailed records of individuals’ wealth for tax reasons. Becker finds that wealthier CEOs receive higher incentives from their firms, a finding which is consistent with decreasing risk aversion from more wealth.
28As an alternative, we also included the log of the market value of the CEO’s equity holdings in the firm. The
estimated coefficient on that control variable is not statistically significant, and the inclusion does not reduce the effect of home leverage.
less debt. We conclude from this evidence that CEO personal leverage measures a key aspect of firm behavior which is not captured by other observable managerial characteristics, such as CEO age, tenure, founder status, or proxies for wealth.
F Effects of Home Characteristics
We reported in section B that there is significant heterogeneity across CEOs in terms of housing consumption. Anecdotal evidence suggests that this variation cannot be easily explained based on observables. For example, the CEOs with the largest and smallest homes in our sample are both males, both in their mid- sixties, and are both CEOs of firms in the retail industry (in fact, their firms have the same four-digit SIC codes). While there are several consumption-preference relations which may potentially be revealed from our housing and mortgage data, we have so far attempted to measure one specific personal preference which we believe is most relevant to corporate capital structures: the CEO’s personal tolerance for debt. However, there is some emerging evidence that CEOs’ purchases of large homes may signal CEO entrenchment. For example, Liu and Yermack (2007) show that firm performance deteriorates when CEOs purchase large mansions and estates.
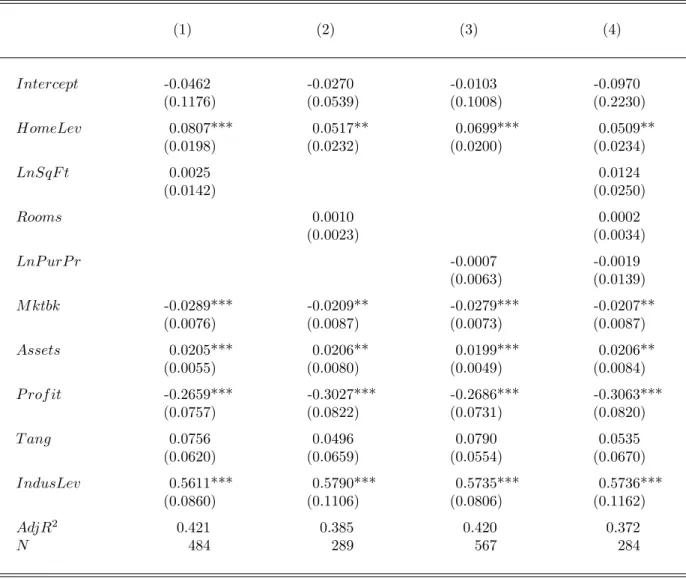
Table IX reports our baseline model specification with home characteristics, in particular, measures of the size of the home, included. In column (1), we include the log of the square footage of the residence (LnSqF t), in column (2) the number of rooms (Rooms), and in column (3) the log of the purchase price, in 2005 home price dollars (LnP urP r). In column (4), we include all of these home characteristics. We find that none of the home characteristics other than the CEO’s personal debt ratio are significantly related to corporate leverage.29 To the extent that home size is a measure of managerial entrenchment, it does not seem to be related to the choice of corporate leverage.
G Robustness Checks
We have performed a number of robustness checks. One concern is regarding the definition of corporate leverage that we use. Table X therefore reports our baseline model specification using
alternative measures of corporate leverage. In column (1), we use total debt to book value of assets (T DA). We find that the estimated effect is similar compared to the one using market values (13 percent compared to 20 percent). Other definitions of total corporate leverage have also been proposed; in untabulated regressions we have examined several of them, e.g., assessing market value as Assets – Book equity + Market equity.30 In column (2), we examine long-term debt to total market value of assets (LDM). The coefficient estimate is positive (0.0625) and statistically significant at the 1%-level. That is, a one standard deviation change in the home leverage measure corresponds to about 21.7 percent change in long-term debt. In column (3), we find that this result is similar when using book values. Finally, we analyze the short-term portion of debt in the capital structure. We find no statistically significant effects of home leverage (untabulated). Thus, our results are driven by variation in long-term debt ratios across firms.
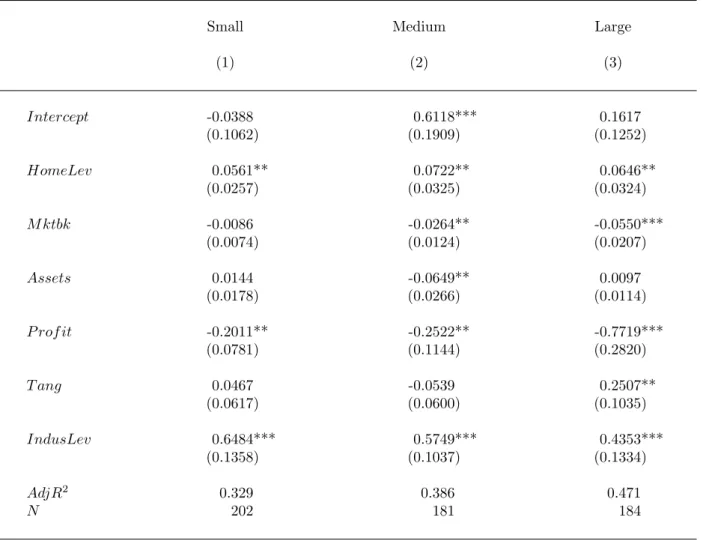
Another concern is that the sample analyzed so far contains firms of very different sizes, and our results may only be relevant for a subsample of firms. Table XI therefore reports results for size triciles, based on Assets for all U.S.-based, non-financial, and non-utility firms covered by ExecuComp in 2004. The average firm size for “Small,” “Medium,” and “Large” firms is $296 million, $1,178 million, and $16,242 million. We find that the coefficient estimates on HomeLev are similar across the triciles: 0.0561, 0.0722, and 0.0646. Each of the coefficients are statistically significant at the 5 percent level. That is, the estimated effect of personal leverage is similar across firms of different sizes.
We control for industry effects, and because we examine S&P 1,500 firms, we do not have a large subsample of “high-tech” firms. However, it may be argued that high-tech firms tend to have very low leverage, and because they have likely gone public recently, the firm’s CEO may largely use the proceeds from the sale of shares to finance his primary residence. In untabulated regressions, we have checked that our results are robust to excluding firms that in 2004 have been available on Compustat less than five years.
Finally, we note that there are certain advantages to having a principal residence in Florida in case of personal bankruptcy or lawsuits because of state-specific constraints on ability to take
30We have data on mortgage interest rates for only a small subset of firms so we are not able to examine the relation
possession of someone’s primary residence. This may result in higher personal leverage in Florida homes, but is unlikely to explain a relation with corporate leverage. In untabulated regressions, we have checked that our results are robust to excluding CEOs with a primary residence in Florida.
IV
CEO Changes and Corporate Leverage Changes
If a new CEO has different personal leverage than the previous CEO, does the firm then change corporate leverage? In this section, we analyze CEO changes and corporate leverage changes. We start our analysis with the sample of CEOs for which we have data on HomeLevand have studied so far in the paper. We then identify all CEO changes during the previous three years; we find 149 CEO changes. We are able to find primary residences for 108, or 72.5 percent, of the previous CEOs, i.e., a comparable percentage to the one for our original sample (75.2 percent). We are able to calculate home leverage for 89 of these CEOs (HomeLevP rev) after dropping eight observations that involve new construction buildings and 11 observations with missing purchase price.
We refer to CEOs as “new” (i.e., CEOs in 2004) versus “previous” CEOs. For previous CEOs, we calculate corporate leverage as of the last full year of the tenure of the CEO. For example, if the previous CEO left office on June 15, 2002, then we associate the end of the year 2001 corporate leverage with this CEO, as long as he was in office for all of 2001. For new CEOs, we calculate corporate leverage for the first full year that the CEO is in office. To continue with our example, if the new CEO started his tenure on June 16, 2002, then the first full year is 2003, as long as the CEO was in office through the end of 2003. Thus, we compute corporate leverage associated with the two different CEOs two years apart in order to ensure that the firm capital structure choices we analyze are in fact attributable to the two different CEOs. We have data on current and previous CEO home leverage for 89 firms, but for five of these observations the previous CEO’s tenure was for less then one full calendar year, thus they are excluded from the changes analysis.31 This leaves us with a sample of 84 CEO changes on which to perform our analysis.
31We have checked that our result of a positive relation between personal and corporate leverage is robust to
using the new, small subsample of 89 previous CEOs. The estimates coefficient is 0.0973, using the baseline model specification in column (4) of Table V. The statistical significance is weaker than in the full 2004 sample (t-statistic = 1.73), but this is likely because the sample is only about 15 percent of the 2004 sample size.
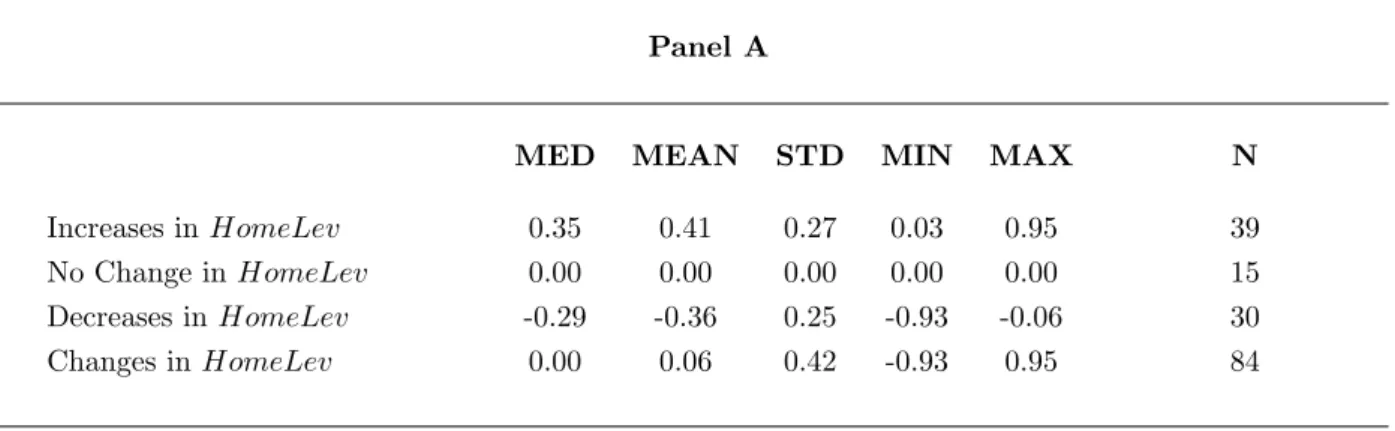
Table XII shows summary statistics and regression results for the changes analysis. We define HomeLevChg to beHomeLev−HomeLevP rev. Panel A shows that there are 39 observations for whichHomeLevChg >0, i.e., the new CEO has more personal leverage than the previous CEO, 30 observations for which HomeLevChg <0, and 15 observations for which there is no change (often 0 or 80 percent home leverage). We construct indicator variables for a personal leverage increase (HomeLevIncr) and decrease (HomeLevDecr). As may be seen in the table, the mean (median) increase in personal home leverage is 0.41 (0.35), while the mean (median) decrease is 0.36 (0.29). We report two results from the changes analysis. First, in column (1) of Panel B, we regress the new CEO’s home leverage on the previous CEO’s home leverage. We find a positive (0.2319) and statistically significant, at the 5%-level, relation between the home leverage of the new and previous CEOs. That is, if the previous CEO of a firm exhibited relatively low tolerance for financial leverage, then the new CEO also tends to exhibit low personal tolerance for financial leverage. That is, our evidence shows that a firm’s board tends to replace a conservative CEO with a new, similarly conservative CEO. This finding suggests an endogenous CEO-firm matching explanation in which firms persistently select CEOs with specific preferences for financial risk-taking.
Second, in column (2), we regress changes in corporate leverage onHomeLevChg and changes in the control variables. Also included are: T DM0, i.e., the corporate leverage in the last full year of the tenure of the previous CEO, and year fixed effects. We find that changes inHomeLev are positively related to changes in corporate leverage, all else equal. The estimated coefficient on HomeLevChg is positive (0.0622) and statistically significant at the 10%-level. The result of this changes analysis is consistent with the positive relation found in the pure cross-sectional analysis for 2004, but in this case, the identification comes from changes within firms. That is, firms appear to change corporate leverage in a way that is, at least partially, predicted by the difference in personal leverage between the new and previous CEOs. For example, if the new CEO is more conservative than the previous CEO, we predict that the firm reduces its corporate leverage. Since corporate leverage appears to change in two to three years around CEO turnover in the direction of the personal leverage of the new CEO, the findings are suggestive of the firm selecting a CEO who will execute a preset, desired, capital structure change.
In column (3), we differentiate between CEO changes resulting in home leverage increases and decreases and we find asymmetric effects. Specifically, we find that the estimated effect on corporate leverage of a change from a more to a less levered CEO is negative (-0.1152) and statistically significant at the 1%-level. That is, when the current CEO has less personal leverage than the previous CEO, we find a significant decrease in the firm’s corporate leverage. The median CEO home leverage decrease is 0.29 in our sample, implying an estimated corporate leverage decrease of 3.3 percentage point in our sample. We find no significant effect for CEO home leverage increases. When firms hire a new CEO with a lower personal tolerance for financial leverage than the previous CEO, the firm tends to reduce its corporate leverage. Thus, reducing financial risk is a stronger effect compared to increasing financial leverage. After all, CEO turnovers are frequently motivated by under performance (Warner et al., 1988); so that in our sample of firms with CEO turnovers the firms are more likely to seek new CEOs that will lower corporate leverage to avoid financial distress. Finally, we note that the intercept in this model specification absorbs the change in corporate leverage when there is no personal leverage change between the new and previous CEOs. The intercept is found to be close to zero (-0.0145) with a t-statistic of 0.30. That is, we find no change in corporate leverage when the new and previous CEOs have the same personal home leverage.32
V
Why Are Personal and Corporate Leverage Positively Related?
So far our empirical analysis shows that there is a robust, positive, and statistically significant relation between CEOs’ personal leverage, as revealed in their most recent home purchases, and the corporate leverage of the firms they manage. In this section, we offer some evidence on why personal and corporate leverage are positively related.
A Reverse Causality
It is possible that reverse causality can explain a relation between personal and corporate leverage. However, based on our evidence, we believe that such reverse causality is unlikely for two reasons.
32We have also checked the robustness of these results to including a measure of changes in expected inflation using
data from the Livingston Survey, www.phil.frb.org/econ/liv/index.html. However, this variable is not statistically significant and it does not change the effect of personal leverage (untabulated).
First, we found in Section III.C that there is a significant positive relation between personal and corporate leverage even whenHomeLev is measured several years earlier than corporate leverage. This reduces concerns about reverse causality explaining our evidence.
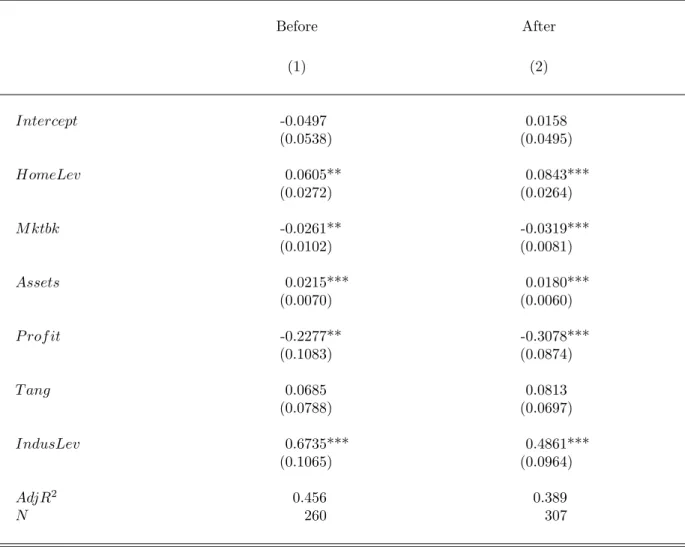
Second, Table XIII reports separate regressions for home purchases before versus after the executive becomes the CEO of the firm. In column (1), based on purchases before becoming CEO, the coefficient estimate is positive (0.0605) and statistically significant at the 5%-level. This evidence also reduces reverse causality concerns. In column (2), we report results for home purchases after the CEO became CEO. In this case, the executive could have chosen a personal home leverage to offset the corporate leverage. However, we find that the coefficient estimate in the regression is still positive (0.0843), and statistically significant at the 1%-level. The finding that the relation between personal and corporate leverage is similar after an executive becomes CEO also seems inconsistent with reverse causality and the view that CEOs change their personal leverage to countervail corporate leverage.
B Endogenous Matching of CEOs and Firms
Another explanation for the positive relation between personal and corporate leverage is endogenous matching (sorting) of CEOs to firms. CEOs may differ in their “match quality” with firms. In this case, the positive relation is the result of optimal matching of CEOs with specific personal trai