THE INCREMENTAL INFORMATION CONTENT OF ANALYSTS’ RESEARCH REPORTS AND FIRMS’ ANNUAL REPORTS:
EVIDENCE FROM TEXTUAL ANALYSIS
JUNE WOO PARK
A DISSERTATION SUBMITTED TO THE FACULTY OF GRADUATE STUDIES
IN PARTIAL FULFILLMENT OF THE REQUIREMENTS FOR THE DEGREE OF
DOCTOR OF PHILOSOPHY
GRADUATE PROGRAM IN ACCOUNTING YORK UNIVERSITY
TORONTO, ONTARIO
JUNE 2019 © June Woo Park, 2019
ii
Abstract
This dissertation consists of three essays, investigating the properties of analysts’ research reports and firms’ annual reports, and their impact on capital markets using textual analysis methods.
The first essay studies the validity of analyst report length, measured by page count, as a proxy for analysts’ research effort. Specifically, I find that longer reports are more positively associated with recommendation upgrades than downgrades, and with forecast accuracy. I further document an asymmetric market reaction to longer upgrades as compared to the same length downgrades. Cross-sectional tests find that this asymmetric report length effect is greater for longer upgrade reports with more cash flow discussion, by less experienced, busier, or male analysts, for high opaque firms, or during a financial crisis. The findings support my hypothesis that by providing more and accurate information, analysts exert credibility-enhancing efforts on their upgrades, as these are perceived by investors to be more optimistic and less credible than downgrades. The study is the first comprehensive investigation of analysts’ research effort for U.S. firms using the number of pages in their reports and suggests differing interpretations of analyst vs. annual report length as a proxy. In other words, management tends to write a longer annual report to hide bad news, whereas analysts tend to write a longer analyst report to provide, and not hide, more information to increase report credibility.
In a second textual analysis essay, I examine the determinants of environmental disclosures (ED) in U.S. 10-Ks (i.e. annual reports) and its impact on future stock price crash risk. I provide crucial evidence that ED is related to bad news (i.e. news that tends to be
obfuscated by managers) by showing the autocorrelation of its change over time and its negative association with short-term market reaction. In the long run, however, an increase in ED shows a
iii
lower likelihood of significant stock price drops. Change and instrument variable analyses mitigate endogeneity and identify a potential causality of ED on the future crash risk. The results are consistent with the notion that firms benefit from non-financial information disclosure.
A third textual analysis essay compares the value of private versus public information sources in U.S. analysts’ earnings forecasts. Using a pattern search algorithm (i.e., regular expression) on the headlines of earnings forecasts, I find that additional private sources of information are associated with (or may cause) less forecast error, triggering a greater market reaction. Moreover, I document that the combination of management and non-management private information sources minimizes forecast error and maximizes market reaction. Thus, such a combination tends to produce the most accurate forecasts and, as a result, the strongest market reaction. Finally, I show that more accurate and informative forecasts are made by analysts who make greater efforts to access private information sources, even when they do not have other information advantages (e.g. brokerage firm reputation). Thus, I provide new insight into the determinants of forecast properties.
Overall, the above-noted studies show that the length and the information sources of analysts’ research reports significantly influence investors’ decision making. The essays also suggest that environmental disclosure in firms’ annual reports contributes to a decrease in future stock price crash risk.
iv
Acknowledgments
First of all, I would like to thank my dissertation committee: Dr. Albert Tsang (chair), Dr. Kiridaran (Giri) Kanagaretnam, Dr. Kee-Hong Bae, Dr. Gary Spraakman, and Dr. Tracy (Kun) Wang for their advice and constructive feedback on my dissertation.
Especially, I would like to acknowledge my deepest gratitude to Dr. Albert Tsang, my supervisor and thesis advisor, for his invaluable detailed guidance, thoughtful correction, his confidence in my ability to carry the work out, and his great encouragement at each stage of my doctoral studies. This thesis would not have been possible without his wisdom, feedback, and support. Thank you for also being my friend and family.
I am incredibly fortunate to have Dr. Hongping Tan, my former advisor. His constant support and guidance have made my PhD study a fruitful journey. I will be forever indebted to you.
I am also highly indebted to Dr. Kee-Hong Bae, my mentor. I appreciate his insightful comments and continuing encouragement throughout the process. He is very kind and
supportive. This thesis has been considerably improved as a result of his insightful suggestions. I greatly thank Dr. Kiridaran (Giri) Kanagaretnam for caring me like a big brother. Your guidance and philosophy have shaped my thinking not only in research but also in life. There are no words that can truly express my gratitude to you for everything.
This journey would not have been possible without the great support that I have received from my family over the years.
I have to say thank you to my loving parents, Hyun Soo Park and Song Gang Kim. I would like to express my sincere gratitude for raising me to be who I am today with your
v
unconditional love. I thank you for supporting me in everything I wanted to do in life. I could not have hoped for better parents. I earnestly pray for my father’s fast and easy recovery.
vi Table of Contents Abstract...ii Acknowledgments...iv Table of Contents...vi Essay 1 Abstract.………...1 Chapter 1 Introduction...2
Chapter 2 Literature review on annual vs. analyst report length and Hypotheses development...7
2.1 Annual report (Form 10-K) length: proxy for complexity………..7
2.2 Analyst report length: proxy for analyst research effort……….8
2.3 Credibility-enhancing hypothesis……….11
Chapter 3 Research methodology and sample selection………...14
3.1 Measurement of report length………...14
3.2 Measurement of earnings forecast error and informativeness………..15
3.3 Regression specification………...16
3.4. Sample selection………..18
Chapter 4 Empirical results………...19
4.1 Descriptive statistics……….19
4.2 Univariate test………...21
4.3 Main regression analyses………..21
4.3.1 Determinants of report length………...22
4.3.2 Report length and earnings forecast accuracy………..23
vii
Chapter 5 Robustness checks………26
5.1 Recommendation levels: buy and sell………...26
5.2 Within-bank analysis………27
5.3 Extended market reaction model………..27
Chapter 6 Cross-sectional test on market reaction to longer revisions……….28
6.1 Detailed information traits………28
6.2 Analyst characteristics………..29
6.3 Information environment effect………30
Chapter 7 Report length and forecast frequency………...32
Chapter 8 Conclusion………33
References………...36
Essay 2 Abstract…...58
Chapter 1 Introduction...59
Chapter 2 Literature review and Hypothesis development………...62
2.1 Literature on consequences of environment disclosure...62
2.2 Hypothesis development: environmental disclosure and crash risk……….64
Chapter 3 Research methodology and sample………..66
3.1 Measurement of environmental disclosure in 10-K filings………...66
3.2 Measurement of short-term market reaction……….68
3.3 Measurement of crash risk………68
3.4. Regression specification………...70
3.5. Sample construction……….73
viii
4.1 Descriptive statistics……….73
4.2 Univariate test………...75
4.3 Determinants of environmental disclosure………...75
4.4 Evidence of Environmental Disclosure as Bad News………...76
4.5 Environment disclosure and short-term market reaction ……….78
4.6 Environment disclosure and crash risk ………78
Chapter 5 Robustness checks………80
5.1 Change, dummy, and residual variable of environmental disclosure…………...80
5.2 Exclusion of Utilities and Financials………82
Chapter 6 Identification strategy………...82
Chapter 7 Conclusion………85
References………...87
Essay 3 Abstrat……...113
Chapter 1 Introduction...114
Chapter 2 Literature review and Hypotheses development………118
2.1 Literature on analysts’ information sources………....118
2.2 Hypotheses development………121
Chapter 3 Research methodology and sample selection……….123
3.1 Measurement of independent variable: analysts’ private research effort level...123
3.2 Measurement of dependent variables: earnings forecast accuracy and market reaction……….124
3.3. Regression specification………125
ix
Chapter 4 Empirical results……….129
4.1 Descriptive statistics………...129
4.2 Univariate test……….132
4.3 Main regression analyses………132
4.3.1 Analysts’ private research effort and earnings forecast accuracy………...133
4.3.2 Analysts’ private research effort and market reaction to stock Recommendations………134
4.3.3 Analysts’ earnings forecast accuracy and market reaction based on the type of private information sources……….136
Chapter 5 Robustness checks………..137
5.1 Additional control variables (i.e., Form 10-K readability and analyst connection), and a new forecast error measure ………137
5.2 Mean value regressions of earnings forecast error……….139
Chapter 6 Change analyses……….139
Chapter 7 Analysts’ private research effort vs. information advantage ……….140
Chapter 8 Determinants of analysts’ private research efforts……….141
Chapter 9 Conclusion and Future Direction………...142
References………...145
1
The Determinants and Consequences of Analyst Report Length
Abstract
Based on textual analysis of 351,629 analyst reports for US firms over 2000-2014, the study finds that analysts tend to generate longer reports for recommendation upgrades rather than downgrades. Compared to shorter reports, longer reports are more accurate in earnings forecast, but solicit a stronger market reaction to upgrades perceived to less credible than downgrades. This suggests that analysts dedicate greater research efforts on the credibility/quality of upgrades by providing more information. The market reaction to longer upgrades is more pronounced when analysts discuss more about a firm’s cash flow; are less experienced, busier, and a male; cover firms with a higher level of information asymmetry; and are issued during a financial crisis. Overall, the study shows a contrast between analyst and annual report length.
Keywords: Report Length, Research Effort, Accuracy, Credibility, Informativeness, Valuation Detail
2 1. Introduction
Managers use longer annual reports (i.e., Form 10-Ks) generally to obfuscate/hide bad news (e.g., Loughran and McDonald, 2014). In contrast, analysts have a different motivation to issue longer research reports because as an important intermediary in the capital market, analysts undertake great efforts to collect both public and private information and provide research
reports to assess the valuation of the covered firms. These analyst reports contain both narratives and non-narratives (e.g., tables, charts, graphs, or pictures) to reflect their investment opinions and the underlying justifications. Comparing with annual report length, this study explores the validity of analyst report length, measured by page count, as a proxy for analysts’ research effort.
Counting the number of pages in analyst reports, Feldman, Gilson, and Villalonga (2010) find that analysts’ earnings forecasts increases with report length. Loh and Stulz (2018)
document that analysts work harder in bad times because investors rely more on analysts when investor uncertainty is heightened. In one of their robustness tests, Loh and Stulz (2018) find that analysts working for Morgan Stanley write longer reports in bad times, suggesting that analysts exert more effort in incorporating more information in the report.
The findings of these two studies are in sharp contrast to those of prior studies showing that management uses longer 10-K filings to obfuscate bad news. Analysts’ motivation to provide additional information in response to investors’ demand (Loh and Stulz 2018) or their own needs (Feldman, Gilson, and Villalonga 2010) brings about a longer research report, whereas management’s intention to hide bad news results in a longer annual report (e.g., Loughran and McDonald, 2014).
Counting the number of words and sentences in stand-alone CSR reports, Clarkson, Ponn, Richardson, Rudzicz, Tsang, and Wang (2018) find a positive association between CSR
3
performance and CSR report length, as predicted by signaling theory. This suggests that analysts
signal their overall research effort through report length.
This study examines the determinants and implications of report length based on analyst reports from seven large investment banks over 2000-2014 from Investext. The paper first identifies the determinants of report length. Prior research (e.g., Boni and Womack, 2006; Jegadeesh and Kim, 2010) finds that recommendation revisions (i.e., upgrade and downgrade) convey new and useful information (e.g., Womack, 1996; Jagadeesh, Kim, Krische and Lee, 2004), and are more informative than mere levels (i.e., buy and sell) (e.g., Boni and Womack, 2006; Jegadeesh and Kim, 2010), suggesting that a change in analysts’ prior belief better reflects their research effort. Moreover, due to analysts’ conflicts of interest and/or desire for access to management (e.g., Michaely and Womack, 1999; Ke and Yu, 2006; Ljungqvist, Marston, Starks, Wei, and Yan, 2007), analysts tend to initially write favorable level recommendations (i.e., buy/hold) perceived to be less credible by investors. Because favorable levels outnumber
unfavorable ones, it is less likely to for analysts to revise the former upwardly than downwardly, resulting in fewer upgrades than downgrades. Nevertheless, if analysts make upgrades, then the credibility of upgrades will be much less credible than favorable levels. Thus, this study focuses on analyst reports with the revisions, i.e., upgrade or downgrade reports, which provide a better research environment for a credibility test.
Specifically, on the information supply side, the paper documents that report length is more positively correlated with upgrade than downgrade, indicating research effort on credibility enhancement by providing more information in upgrade inherently perceived to be less credible (Conrad, Cornell, Landsman, and Rountree, 2006). Report length also has a more positive association with post-earnings announcements (analyst team) because of more resources
4
available. However, report length is negatively correlated with a firm’s past return volatility since the costs of covering the firm might outnumber its benefits. On the information demand side, report length is positively related to a financial crisis period and recession to respond to investors’ greater demand for information. This suggests that report length is determined by supply (demand) of information by analysts (from investors).
The study then examines the implications of report length by investigating its association with forecast error and market reaction to analyst recommendations. The study finds that longer report is associated with a smaller forecast error, suggesting that a greater information amount tends to bring about more accurate information.
The positive association of longer reports with higher forecast accuracy is related with a stronger stock market reaction to both longer upgrade and downgrade reports. This relationship, however, might not be warranted due to investors’ different credibility perception to these recommendation revisions, resulting in an asymmetric market reaction, i.e., (no) stronger reaction to longer upgrade (downgrade) reports.
In a related study, Hutton, Miller, and Skinner (2003) examine management earnings forecasts and hypothesize that bad news forecasts are always credible, whereas good news ones are optimistic and less credible.12 Therefore, managers are able to increase the credibility of the latter by providing more verifiable information to help justify their optimistic opinions.
Motivated by the above study, I examine the information content of longer upgrades, documenting statistically and economically asymmetric market reaction to longer upgrades
1 Hutton, Miller, and Skinner (2003) define forecast credibility as the extent to which investors believe the forecast and measure the credibility using the stock price reaction to the forecast.
2 The analyst literature considers a sell recommendation highly credible due to analysts’ incentives to issue optimistically biased reports, andoften combines it with a hold recommendation. See footnote 13 for related information.
5
perceived to be less credible relative to downgrades of the same length. The credibility
difference might be due to analysts’ conflicts of interest and/or desire for access to management described above. To increase the credibility of upgrades, analysts are likely to justify their optimism by providing more detailed and relevant information (esp., on valuation), resulting in longer upgrades. Consequently, investors constantly show more positive reaction to longer credibility-enhanced upgrade reports, whereas they do not react as much negatively to equally lengthy downgrade reports inherently perceived to be credible.
In cross-sectional tests, market reaction to longer upgrades is more (less) pronounced when they have more cash flow discussion (tables), suggesting that investors are more sensitive to a valuation-specific narrative which is more beneficial than a non-narrative valuation
summary in a table for the credibility enhancement of upgrades. Market also shows stronger reaction to longer upgrades by a less experienced, a busier, or a male analyst whose upgrades are perceived to be less credible. For the same reason, report length effect is more pronounced for a firm with higher information asymmetry or during greater uncertainty.
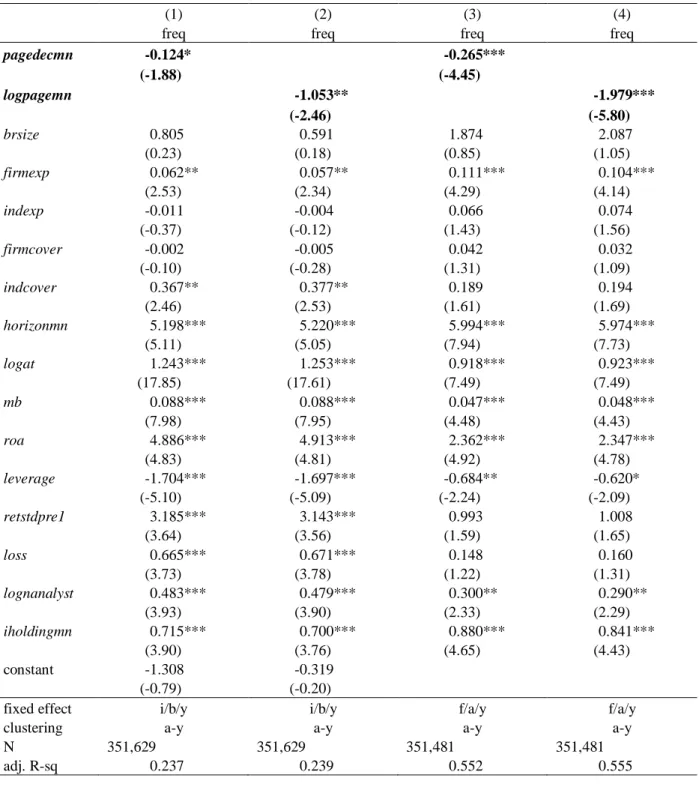
Different from report length (or amount), previous studies (e.g., Jacob, Lys, and Neale, 1999; Loh and Stultz, 2018) measure analysts’ research effort in terms of forecast frequency. The research examines whether greater page length is associated with fewer subsequent revisions, finding their negative relationship.
Overall findings are robust to different measures of report length and recommendation (i.e., logarithm and levels, respectively), to the specifications with different fixed effects or additional controls, and to adjustments for standard errors using a different two-dimension clustering. Particularly, a within-bank analysis shows the robustness by controlling for more bank-specific characteristics.
6
The research makes several important contributions. First, the paper contributes to analysts’ research effort literature by comprehensively studying research effort based on the number of pages in their reports and thus motivating and extending prior research (e.g., Loh and Stulz, 2018). Specifically, the study provides the justification of report length as a research effort measure by showing that longer upgrades have a positive association with market reaction. This highlights an important difference in motivation to issue longer reports between analysts and management. That is, analysts provide supplementary information to increase the credibility of optimistically-biased upgrades, whereas management supplies additional information to hide bad news: research credibility effort vs. information obfuscation motive. Thus, the paper also
contributes to the annual report literature which finds 10-K filing length to be a proxy for readability or complexity. Taken together, the study motivates researchers to investigate the nature (or motivation) of other larger documents, contributing to the disclosure literature.
In addition, to identify various report length determinants, the study finds that longer reports are associated with a smaller forecast error, through which positively influences market reaction. The paper also shows how two research effort proxies (i.e., report length (or amount) and forecast frequency) are related. Thus, the research helps improve our understanding and measurement of the determinants of analysts’ forecast performance by suggesting that
controlling for report length (or its alternatives) in forecast research is meaningful, especially, for textual analysis.
The paper makes another contribution to the literature on analysts’ optimism by showing that similar with management forecast, optimistically-biased favorable recommendations with more details become credible through accuracy, which are highly valued by investors. The
7
research also contributes to the same literature by finding that analysts’ optimistic-bias toward favorable opinions is more mitigated with additional details in valuation.
Lastly, there is a debate on measurement of forecast frequency as a proxy for research effort. Contrarily, report length is measured by simply counting the number of pages. Therefore, counting pages is more practical than measuring frequency for general report users to calculate research effort. Counting pages is especially helpful for unsophisticated investors who have difficulty in measuring forecast frequency due to the lack of data. This suggests the practical implication to use report length as a proxy for analyst effort.
This paper proceeds as follows. Section 2 reviews the relevant literature and develops the hypotheses. Section 3 explains the research design and the sample selection. Section 4 reports the main empirical analyses on the determinants and consequences of report length. Section 5
presents robustness checks. Section 6 describes the cross-sectional tests. Section 7 discusses the association between report length and forecast frequency. Section 8 concludes the paper.
2. Literature review on annual vs. analyst report length and Hypotheses development 2.1 Annual report (Form 10-K) length: proxy for complexity
Leuz and Schrand (2009) are the first to count the number of pages in the entire annual reports (i.e., Form 10-Ks) in 2001 as a proxy for a disclosure level. 10-K length by page count consists of Items 1 through 15 including the exhibits and financial statement schedules in Item 15. Using 10-K length, they find that the cost of capital shocks by the 2001 Enron scandal are positively associated with report length as a proxy for firms’ disclosures in their subsequent annual 10-K filings.
In contrast, using its file size, Loughran and McDonald (2014) argue that page length of 10-K filings is a proxy for a readability level, not disclosure. The file size in megabytes is the
8
sum of words, tables, pictures, graphics, and HTML code of complete submission text file from Electronic Data Gathering, Analysis, and Retrieval (EDGAR) database of the U.S. Securities and Exchange Commission (SEC), suggesting that it is equivalent to the number of pages (i.e., page count). They find that possibly due to management’s bad news obfuscation tendency, 10-K file size has a positive association with post-filing date abnormal return volatility, earnings surprises, and analyst forecast dispersion. This is inconsistent with Leuz and Schrand (2009)’s explanation that file size is a proxy for disclosure. They explain that if the alternative explanation is true, then “one would expect larger documents to be negatively (not positively) related to volatility and analyst dispersion”. Thus, they suggest that file size (or page count) is a measure for readability, not disclosure in “any longer documents”. However, their argument might be valid in 10-K filings, but thanks to the growth in textual analysis, it is found not to be true in other documents such as analyst reports.
Accepting the finding by Loughran and McDonald (2014), Li and Zhaoz (2016) further find that 10-K file size proxies both readability and information content. They argue that larger 10-K flings have more informative materials about which take time for investors to learn due to lower readability (or higher complexity). Comparing with 10-K reports, they argue thatearnings announcements tend to be shorter and less complex and are associated with a decrease in
uncertainty in a short horizon. This also suggests that other larger documents such as analyst reports might carry information more than complexity, which leads to investors’ positive reaction.
2.2 Analyst report length: proxy for analyst research effort
Counting the number of pages in analyst reports from Morgan Stanley, Loh and Stulz (2018) measure report length as a proxy for analysts’ research effort (or information amount).
9
Before report length, analysts’ forecast frequency (i.e., activity) is commonly used to measure their forecast effort. For example, Jacob, Lys, and Neale (1999) define forecast frequency as the number of earnings forecasts that analysts make for a specific firm in a specific year (i.e., individual analyst’s firm-specific forecast effort), arguing that the higher forecast frequency, the more forecast effort to the firm.
On the other hand, Barth, Kasznik, and McNichols (2001) measure forecast effort as the negative of the average number of firms covered by the firm's analysts, calculated as -1 times the sum of the number of firms followed by a firm's analysts in a particular year divided by the number of analysts covering the firm in that year (i.e., all analysts’ firm-specific forecast effort). They interpret a less number of total firms that a specific firm’s analysts follow as more effort to cover the firm.
Klettke, Homburg, and Gell (2015), however, argue that the first measure is not sufficient because the commonly applied firm-specific measure of forecast effort does not consider general analyst behavior for all covered firms. Additionally, by pointing out that the second measure is equal for all analysts covering the firm, they introduce a measure for general forecast effort by each analyst individually (i.e., individual analyst’s general (or non-firm-specific) forecast effort). Specifically, they calculate the average number of forecasts that an analyst issues for all covered firms, excluding the covered firm in a particular year. Consistent with other research based on forecast frequency, their findings show its negative relationship with forecast error.3
Compared to forecast frequency, report length by page count (or information amount) can be another proxy for analyst’ firm-specific research effort since it measures their individual overall research effort on collecting, analyzing, and presenting all information relevant to their
10
investment opinions. In addition, report length is different from report readability in that the latter is differently measured and does not contain non-narrative information as part of analysts’ overall research effort, even though it is sometimes referred to as the same name. For instance, following Li (2008) on annual report readability, De Franco, Hope, Vyas, and Zhou (2015) measure analyst report readability using the number of words and the number of characters. Similarly, Huang, Zang, and Zheng (2014) calculate the estimated residual or the number of sentences to measure analyst report readability. They argue that longer reports are more difficult to read and process for the users.4
Recently, researchers use report length as a proxy for an individual analyst’s firm-specific research effort. Specifically, counting the number of pages of analyst reports from a single investment bank, Morgan Stanley, Loh and Stulz (2018) measure report length to capture research effort. They only document that report length, as a dependent variable, is positively related with bad times, e.g., a global financial crisis or recessions. Overall, they show that greater report length is associated with better and more information, reflecting more research effort.
Earlier, using spin-off firms, Feldman, Gilson, and Villalonga measure the amount of
attention that analysts devote to their covered firms in their working paper (2010).5 As an independent variable, they also use both the total number of pages and the proportion of pages devoted to analyzing either the parent or subsidiary. They find that analysts issue more accurate forecasts on a parent firm rather than a subsidiary as they devote more effort to the former by including more detail in the forecasts.
4 10-K file size proxies readability (Loughran and McDonald, 2014), whereas it proxies both readability and information content (Li and Zhaoz, 2016). See Section 2.1 for more details.
5 Feldman, Gilson, and Villalonga examine page length variable in their working paper (2010), but exclude it from Strategic Management Journal (2014). Thus, Loh and Stulz are the first to accept report length as analysts’ research effort in a peer-reviewed journal (Journal of Finance, 2018), but without its justification for the research effort.
11
Even though both studies use report length, they do not provide justification for it as a valid proxy for research effort. However, using machine-learning approach on stand-alone CSR reports, Clarkson, Ponn, Richardson, Rudzicz, Tsang, and Wang (2018) document a positive association between CSR performance and CSR report length (i.e., disclosure level) measured by the number of words and sentences, suggesting that linguistic features can predict good or bad CSR performance firms, as predicted by signaling theory rather than legitimacy theory.
Using report length based on a larger sample size without the limitation to a firm-specific situation, the paper fills the gap by providing empirical evidence that analysts signal their overall research effort through report length.
Analysts’ primary responsibility is to forecast the value of the firm they cover. Their forecasts significantly differ in accuracy depending on known factors, i.e., control variables in the models such as brokerage-, analyst-, and firm-specific characteristics.
Using forecast frequency as a proxy for analysts’ forecast effort, prior studies show that all else equal, analysts who devote higher forecast effort are more accurate than those who devote lower effort (e.g., Jacob, Lys, and Neale, 1999). Measuring the same construct
differently, Loh and Stulz (2018) suggest that report length is another proxy for research effort. However, one argues that longer reports do not necessarily increase forecast accuracy because information amount and accuracy are different constructs. Nevertheless, following Loh and Stulz (2018)’s argument of the positive association between longer reports and better information, I expect that report length reduces forecast error as shown in forecast frequency. Accordingly, I set forth the first hypothesis as follows:
Hypothesis 1: Ceteris paribus, length and error of earnings forecasts are negatively associated.
12
If longer reports are positively associated with higher forecast accuracy, then it can be expected that stock markets react more positively to both longer upgrade and downgrade reports. This expectation, however, might be unwarranted due to investors’ different credibility level to these stock recommendation revisions, resulting in an asymmetric market reaction, i.e., (no) stronger reaction to longer upgrade (downgrade) reports.
Using an experiment based on psychological theories, Hirst, Koonce, and Simko (1995) find that when an analyst report conveys unfavorable information, subjects are more likely to seek out other information in the report because an unfavorable one is contrary to their
expectation that analysts issue a favorable one. In contrast, Francis and Soffer (1997) document that investors place greater weight on other information in an analyst report when the report contains a favorable recommendation than when it includes an unfavorable one because the former is inherently perceived to be biased. They explain that due to their optimism from the conflicts of interest (e.g., current and/or potential investment banking business or trading commissions) and/or their motive to gain access to management as a source of information, analysts are reluctant to issue an unfavorable recommendation.
Using management earnings forecasts, Hutton, Miller, and Skinner (2003) show that bad news forecasts are always credible, whereas good news forecasts are less credible. Thus,
managers increase the credibility of good news forecasts by supplementing them with verifiable forward-looking statements about earnings components to justify their earnings optimism, which market favorably reacts to.
In analyst forecasts, buy (sell) recommendation is good (bad) news. Similarly, upward (downward) recommendation revisions (or changes) mean good (bad) news. Previous studies (e.g., Womack, 1996; Jagadeesh, Kim, Krische and Lee, 2004) document that revisions convey
13
new and useful firm-specific information. Moreover, prior research (e.g., Boni and Womack 2006; Jegadeesh and Kim, 2010) confirms that recommendation changes are more informative than mere levels such as buy and sell. This suggests that a change in analysts’ previous belief in their covering firms better reflects their research effort than levels. Especially, due to analysts’ conflicts of interest and/or motivation for access to management (e.g., Hirst, Koonce, and Simko, 1995; Francis and Soffer, 1997; Michaely and Womack, 1999; Ke and Yu, 2006; Ljungqvist, Marston, Starks, Wei, and Yan, 2007), analysts tend to initially write favorable level
recommendations (i.e., buy/hold) perceived to be less credible by investors. Because favorable levels outnumber unfavorable ones, it is less likely for analysts to revise the former upwardly than downwardly, resulting in fewer upgrades than downgrades. Nevertheless, if analysts make upgrades, then the credibility of upgrades will be much less credible than favorable levels. Thus, I focus on recommendation revisions for a complete understanding of report length for research effort.
In sum, upgrades are perceived to be less credible than downgrades because they are optimistically biased possibly due to well-documented analysts’ conflicts of interest and/or motivation for access to management. Particularly, Conrad, Cornell, Landsman, and Rountree (2006) find that analysts tend to issue upgrades more than downgrades if their brokerage firm has a historical investment banking relationship with the firm they cover. As shown in management behavior on good news, to increase the credibility of these favorable recommendations, analysts tend to justify the optimistically-biased favorable ratings by providing more detailed and useful information (esp., valuation-specific detail), resulting in a long report, i.e., bigger research effort. Thus, investors react more positively to longer credibility-enhanced upgrade reports, whereas they do not show a stronger negative reaction to downgrade reports of equal length because they
14
are already credible and their additional information might be qualitative soft-talk not related to valuation, i.e., not informative. This prediction leads to the following hypothesis.
Hypothesis 2: Ceteris paribus, stock market reacts more strongly to longer upgrade reports than downgrade reports of equal length.
3. Research methodology and sample selection 3.1 Measurement of report length
The research question of interest is whether report length is a valid proxy for analysts’ research effort by examining its determents, and primarily, its association with forecast accuracy and/or informativeness. Without controlling for mechanical page variations due to regulatory and brokerage template requirements,6 previous literature (Feldman, Gilson, and Villalonga, 2010; Loh and Stulz, 2018) measures research effort as the total number of pages (page) of the forecasts. Ranked by an investment bank and a report year to control for such page differences, therefore, report length in deciles (pagedec) is a better measure for research effort than a raw number of pages (page). I treat pagedec as a continuous variable because the ranked pages are equally divided into 10 parts and thus, the numerical distance between each set of subsequent categories can be assumed equal (or even). Thus, pagedec is the variable of interest as a proxy for research effort.
For the robustness checks, the logarithm (logpage) of a raw number of pages is employed since its distribution is highly skewed to the right. In untabulated tests, two more measures are
6 In 2002, the U.S. Congress enacts the Section 501 mandate of the Sarbanes-Oxley Act (SOX) governing research analysts’ conflicts of interest. Subsequently, the New York Stock Exchange (NYSE) amends its Rule 351 (Reporting Requirements) and Rule 472 (Communications with the Public) while the National Association of Securities Dealers (NASD) releases Rule 2711 (Research Analysts and Research Reports). The historic Global Settlement with 10 of the U.S. largest investment banks is announced in December 2002 based on the enforcement actions against the issues of the conflicts of interest related to their analysts’ recommendations. In 2003, the SEC, NYSE, and NASD, and the banks reach the settlement resulting in nearly $1.4 billion dollars of fines and penalties and reinforce the structural reforms on NYSE Rule 472 and NASD Rule 2711. The new rules intend to make research output more credible by establishing stringent disclosure requirements.
15
tested: both a quintile of a raw number of pages and an abnormal page length equal to estimated residuals from regressing a raw number of pages on control variables in Equation (2) below. Their results are qualitatively similar to those of pagedsec and its alternative, logpage. 3.2 Measurement of earnings forecast error and informativeness
Loh and Stultz (2018) suggest that a longer report (i.e., more information) has better information. Thus, the paper exams the relationship between analysts’ report length (pagedec
and logpage) and their earnings forecast performance. Following Bae, Stulz, and Tan (2008), I define analysts’ absolute forecast error in percentage as follows:
afeprcmi,j,t = 100 x |forecasti,j,t – actualj,t|/prcmj,t (1)
where afeprcmi,j,t is the absolute forecast error for analyst i, following firm j for fiscal year t scaled by pricej,t (i.e., the latest monthly stock price from Compustat), forecasti,j,t is the last one-year-ahead forecast of annual earnings of firm j for fiscal year t issued by analyst i, and
actualj,t is the actual annual earnings for firm j for fiscal year t. Depending on the scalers such as
actualj,t, and forecasti,j,t of firm j for fiscal year t, alternative measures are labeled as afeacti,j,tand
afeepsi,j,t (e.g., Hong and Kubik, 2003).7 Earnings forecasts and actual earnings are from I/B/E/S. The higher the absolute forecast error, the lower the forecast accuracy.
To test whether longer report increases the informativeness of analyst recommendations, we measure the cumulative abnormal return (car5) as the sum of daily market-adjusted abnormal return during five days [-1, +3] starting from one day before an analyst forecast date. Analyst forecast dates are captured from the report per se downloaded from Investext. The daily stock return is based on the holding period return from CRSP and the market return is the daily value-weighted return including all distributions of U.S. stocks from CRSP.
7 Dividing by the share price, actual earnings, and earnings forecasts makes it possible to compare forecast errors across time and across firms.
16 3.3 Regression specification
I separately regress the dependent variables of error and informativeness of analysts’ earnings forecasts on various report length variables proxied for research effort. I control for series of factors that might affect forecast accuracy and stock returns, including a year fixed effect to control for common time trends, and an industry (a bank) fixed effect to account for cross-industry (bank) differences. The baseline regression model is as follows:
dependent = β0 + β1pagedec + β2Σanalyst + β3Σfirm + β4industy F.E.+ β5bank F.E.
+ β6year F.E. + ε (2) where the main dependent variables (dependent) are the proxies for either absolute forecast error (afeprcm) in year t in a forecast model or cumulative abnormal returns (car5) in year t in a market reaction model. All the independent variables are measured in year t-1 or year
t. page, at, and nanalyst are log-transformed in all models due to their high skewness. The key variable of interest (pagedec) is a proxy for analysts’ research effort level measured as the total number of forecast pages in deciles: its alternative is logpage. In a market reaction model, I additionally include the changes (upgrade and downgrade) of analyst recommendations as independent variables to test relative credibility-enhancement effect by comparing market reaction between two revisions. I also run an alternative market reaction model with firm, analyst, and year fixed effects. The coefficients on constants from the alternative model are not reported since Stata does not produce them. The rest of variables control for factors which influence dependent variables. Standard errors are cluster-adjusted at an analyst and a year (or firm) level. 8 Appendix A provides detailed variable definitions.
17
I follow the previous literature to control for two sets (Σanalyst and Σfirm) of
characteristics that affect forecast frequency, error, and investors’ reaction to recommendations, i.e., analyst (including brokerage firm)- and firm-specific characteristics.
According to prior research (e.g., Clement, 1999; Rubin, Segal, and Segal, 2017), analyst characteristics can explain analyst performance such as forecast accuracy. Thus, I control for the following analyst (including brokerage house)-specific variables in both a forecast and market reaction model: analyst’s experience following the firm (firmexp) and the industry (indexp) measured as the number of years the analyst covers the firm (industry) as of year t; analyst’s
busyness (or task complexity) calculated as the number of firms (firmcover) and industries (indcover) covered by the analyst in year t; resources of the brokerage house (brsize) defined as the number of analysts employed by the brokerage firm employing the analyst in year t. Clement (1999) finds that forecasts made closer to earnings announcements are more accurate. Thus, I control for forecast uncertainty (horizon) calculated as the number of days from the forecast date to fiscal year-end since a longer time period between the dates increases forecast error
(Richardson, Teoh, and Wysocki, 2004). Similarly, I control for information uncertainty
measured as previous forecast dispersion (displag) defined as the standard deviation of earnings forecasts divided by the absolute value of their mean in year t-1. Gu and Wu (2003) and Zhang (2006) find that it is negatively correlated with forecast accuracy. Following Loh and Stultz (2018), I also include previous forecast error (afeprcmlag). In a market reaction model, I control for report readability (readability) from De Franco, Hope, Vyas, and Zhou (2015), but drop
afeprcmlag and displag which include for robustness check.
I then control for proxies for firm’s financial and operating risk, as well as the information environment. These firm-specific variables are included in both a forecast and
18
market reaction model. Specifically, I control for a firm’s growth opportunities based on its market value (mb) calculated as a market value divided by a book value at year-end, its profitability (roa) in terms of a ratio of income before extraordinary items to total assets at the end of year t, its leverage (leverage) defined as total liabilities scaled by total assets at the end of year t, and its previous return volatility (retstdpre1) measured as the standard deviation of its daily stock return during one year prior to an analyst forecast date.
Finally, I also control for a firm’s information environment by including its size (logat) measured as the natural logarithm of its total assets at year-end, an indicator variable (loss) equal to 1 if it has a negative earnings during three fiscal years before an analyst forecast, and 0
otherwise, and the number of analyst following (lognanalyst) calculated as the natural logarithm of the number of analysts following the firm in the previous year. Last but not least, I control for institutional holdings (iholding)measured as the total number of shares held by institutions divided by shares outstanding at the end of the same quarter in quarter t. All continuous variables are winsorized at 1 and 99 percentiles to reduce the effect of outliers.
3.4. Sample selection
To empirically test the hypotheses, I count the number of pages for each analyst report of the top 15 largest global investment banks based on total assets who cover U.S. firms. The reports are downloaded from Investext over 2000-2014. The report data then merges analyst and management forecast data from I/B/E/S, financial data from Compustat, and stock price data from CRSP. Some banks’ reports in pdf file are not available in Investext, for example, Goldman Saches & Co. and Bank of America Securities LLC. Likewise, some banks’ forecast data is not available in I/B/E/S. These unmatched banks are dropped from a sample. There are four U.S. investment banks (i.e., J.P. Morgan, Morgan Stanley, Citigroup, and Jeffries Co.) and three
19
European banks (i.e., Credit Suisse, Deutsche Bank, and UBS). See Table 2, Panel B for the bank distribution. The sample consists of 470,075 firm-analyst-date observations. After deleting missing values of variables in a forecast regression, the final sample contains 351,629 reports from 7 unique banks for 15 years, 1,806 unique analysts, 3,879 unique firms, and 24 industries. 4. Empirical results
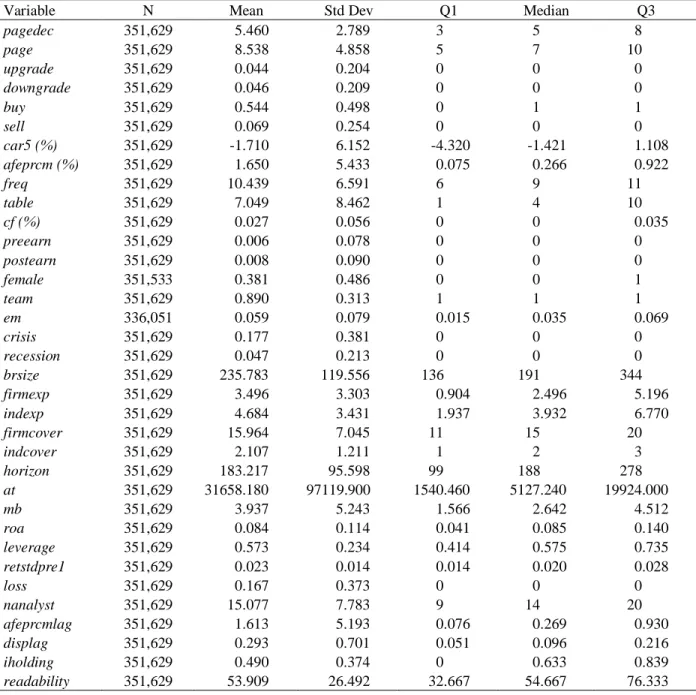
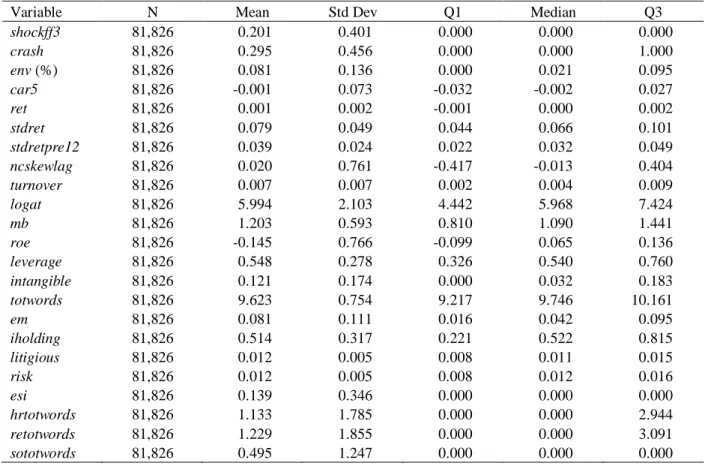
4.1 Descriptive statistics
Table 1, Panel A, provides the descriptive statistics for main variables. In the sample, the mean value of page is 8.538 with a minimum of 2 and a maximum of 29, meaning that on average, each analyst forecast has about 8 and a half pages including a required disclosure section. Using Morgan Stanley reports, Loh and Stultz (2018) find that the average report length is 10.237 pages.9 The mean value of a key report length (pagedec) is 5.460 with a median of 5.
As for the variables in a forecast error model, the mean value of afeprcm is 1.650. This suggests that on average, analysts are more likely to make an error on their forecasts by 1.650% of the latest monthly stock price of a firm.
Meanwhile, the mean value of cumulative abnormal return (car5) is -1.710%, suggesting that sample firms’ stocks underperform a benchmark around analyst forecast release dates by 1.71%. The mean values of upward recommendation revisions (upgrade) and downward revisions (downgrade) are 0.044 and 0.046, respectively. This suggests that recommendation reiterations overwhelmingly account for revisions by 91%. Buy (sell) recommendations consist of about 54% (7%) of all forecasts. Consistent with previous literature, analysts are highly likely to issue significantly more buy than sell, but slightly more downgrade than upgrade since they tend to be overly optimistic in the first place.
9 Huang, Zang, and Zheng (2014) report an average of 7.7 pages excluding brokerage disclosure sentences in the report.
20
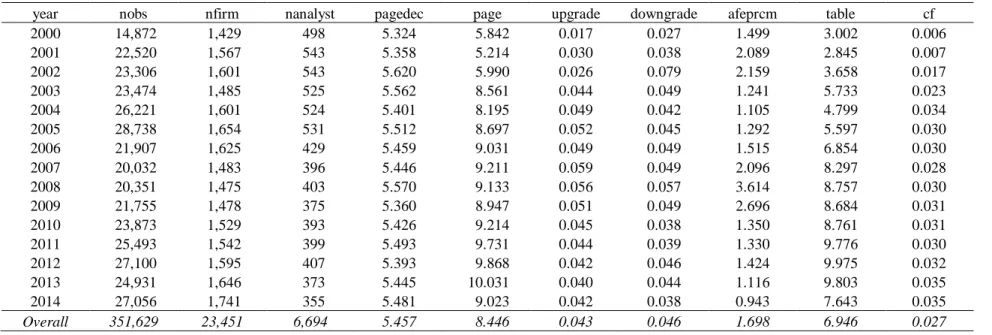
Panel A of Table 2 reports the sample distribution by year during 2000-2014. Consistent with Loh and Stultz (2018), analysts devote more forecast effort (pagedec) during bad times (i.e., 2007-2009 credit crisis) due to higher information demand from investors concerned about the stock market uncertainty.10 Especially, pagedec reaches the highest level of 5.620 in 2002 because of Sarbanes-Oxley Act (SOX), the New York Stock Exchange (NYSE), and the
National Association of Securities Dealers (NASD) Rules on the disclosure of analysts’ conflict of interest in their reports. The rules increase upgrade (but reduce buy in untabulated results) which is associated with more discussion on cash flow (cf). Generally, forecast error (afeprcm) decreases when pagedec increases. table constantly increases over time while cf is stable since 2004, suggesting that the difference between non-narratives and narratives gets bigger.
Untabulated results show the distribution of the sample by 24 industry groups in terms of the Global Industry Classification Standard (GICS) codes. Software & Services, Media, and Household & Personal Products are top 3 industries in average page length in decile, whereas Real Estate has the lowest, suggesting a shorter report for a firm with a higher tangible asset.
Table 3 displays the Pearson correlation matrix. Report length (pagedec) is significantly and positively associated with upgrade, whose relationship is twice that with downgrade. This provides initial evidence of analysts’ research effort on improving the credibility of their upgrade perceived to be overly optimistic. In contrast, pagedec is significantly and negatively correlated with forecast error (afeprcm), suggesting that the more research effort, the less forecast error.
pagedec is significantly positively correlated with valuation detail in a cash flow (cf) and with earnings management (em), whereas negatively associated with analyst characteristics (firmexp and female). This suggests that analysts tend to provide more information on cash flow details
10 The National Bureau of Economic Research (NBER) reports that the recession periods are from March 15th, 2001 to November 15th, 2001, and from December 15th, 2007 to June 15th, 2009.
21
directly related to firm valuation or for a firm with greater earnings management, and when they are a rookie or a male. pagedec is mechanically positively correlated with the number of tables (table). cf and table have a positive association, suggesting that cash flow details accompany tables. The key variable, pagedec, generally has a similar correlation pattern with page. However, indcover (crisis) is significantly positively (negatively) associated with page, rather than pagedec, suggesting that analysts tend to issue a longer report when they are busy or during a financial crisis.
4.2 Univariate test
Table 4, Panel A, displays the mean comparisons of main variables by pages in deciles, i.e., pagedec. As analysts’ effort increases from the first (i.e., D1) to the tenth (i.e., D10) decile, incremental change in upgrade is greater than that in downgrade, suggesting another initial evidence of analysts’ effort on the favorable forecast credibility. The values of a forecast error variable (i.e., afeprcm) significantly drop as pagedec increases, suggesting initial evidence that the more research effort, the less forecast error. Meanwhile, Panel A of Table 4 shows that the decile values of firmexp, em, and crisis have outliers in D1 or D10, displaying polynomial (i.e., not consistent change) relationship with pagedec, and thus, their D1 and D10 comparisons for main variables are misleading. Using the median values of a raw number of pages (pagedum), Panel B of Table 4 shows more meaningful association between low and high report length, and main variables. An observation greater (smaller) than pagedum is treated as high (low). In general, the results of Table 4 are consistent with those of the correlation in Table 3. 4.3 Main regression analyses
In this section, I identify the determinants of a main independent variable (pagedec) and then investigate its consequences using the multiple OLS regression model specified in Section
22
3. For a robustness check, all main tables include alternative measures of both a main independent and dependent variable.
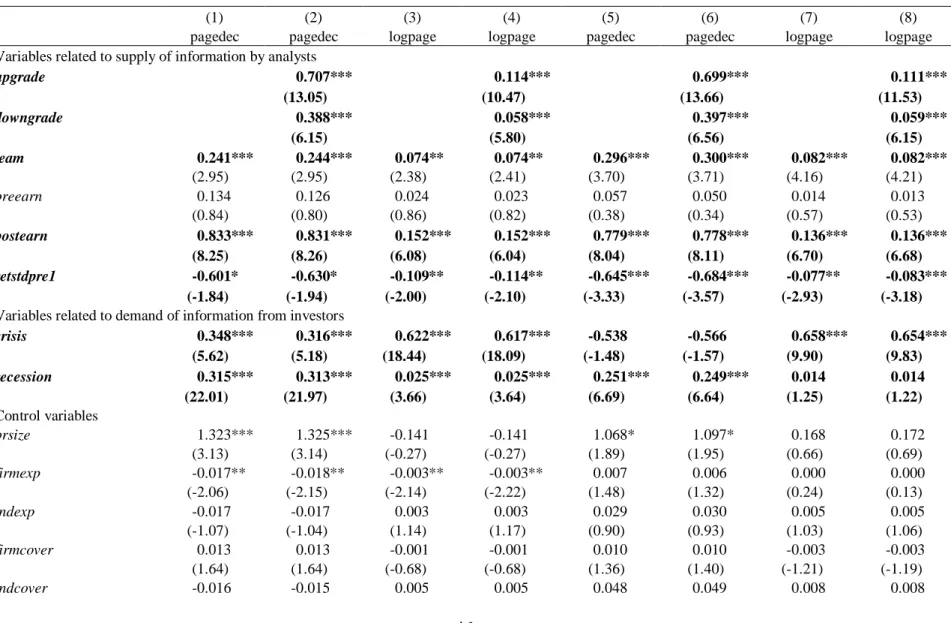
4.3.1 Determinants of report length
In this section, based on the supply and demand of information, I investigate forecast signal, analyst, and firm characteristics influencing report length by regressing pagedec on these. First, I start with the variables related to the supply of information by analysts. Due to an
analysts’ optimistic bias possibly from their conflicts of interest and/or motive on gaining access to management for better information (e.g., Hirst, Koonce, and Simko, 1995; Francis and Soffer, 1997; Michaely and Womack, 1999; Ke and Yu, 2006; Ljungqvist, Marston, Starks, Wei, and Yan, 2007), a favorable recommendation is perceived to be less credible relative to an
unfavorable one.11 Especially, Conrad, Cornell, Landsman, and Rountree (2006) find that analysts are more likely to issue upgrades than downgrades if their brokerage firm has a
historical investment banking relationship with the firm they cover. To enhance the credibility of the former, analysts are likely to supply detailed supplementary information, resulting in a longer recommendation. See more about this in Section 4.3.4. Consistent with the prediction, Column (2), (4). (6), and (8) of Table 5 displays the findings that upgrade is more positively associated with pagedec than downgrade. In addition, report length is positively associated with an analyst’s team (team). Report length also has a more positive relation with forecasts (postearn) issued after a firm’s earnings announcements than with those (preearn) before the
announcements because of more information available after the events.
On the demand side, report length is negatively related with a firm’s previous return volatility (retstdpre1) because costs required to follow the firm (e.g., information process)
11 The analyst literature often combines a hold and a sell recommendation as a sell recommendation, suggesting that the former is considered as much credible as the latter. See footnote 4 for related information.
23
outweigh benefits (e.g., trading commissions) from investors’ high information demand on the firm. On the other hand, report length is positively associated with bad times (crisis or recession) such as financial crisis or recession due to investors’ higher motivation for uncertainty reduction. The results are consistent with Loh and Stultz (2018)’s findings.
More importantly, the positive association between report length and readability (i.e., word length) suggests the mechanical relationship between these two, i.e., the longer the report is, the more non-narratives (e.g., tables) than narratives (e.g., words) the report has. In other words, a longer report is easier to read because of fewer words, inconsistent with the results from a longer 10-K report. Untabulated correlation results document the positive (negative)
association between readability and table (cf) at the 1% level.
Overall, the findings are consistent with the notion that analyst report length increases with the expected supply (demand) of information by analysts (from investors).
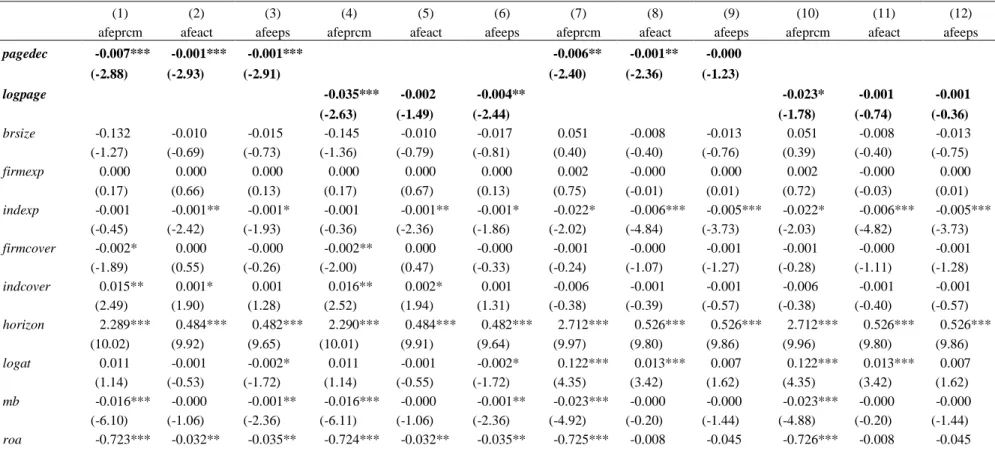
4.3.2 Report length and earnings forecast accuracy
The results of Table 6 show the linear regression results of report length on earnings forecast error. Except for 4 out of all 12 models, the coefficients on pagedec and logpage are significantly negative, implying that greater research effort tends to induce less forecast error. Consistent with the first hypothesis, this suggests that the information amount of analyst reports improve their quality in terms of accuracy.
In untabulated analyses, I re-estimate the forecast accuracy test including firm fixed effect instead of industry fixed effect. I also rerun the test after replacing bank fixed effect with analyst fixed effect. In addition, using a firm, analyst, and year level, I test other combinations of two-way clustering to adjust for standard error. No inferences are affected by these alternative specifications.
24
As for control variables, if analysts have a longer horizon to forecast (horizon), then they are likely to have more error in their forecasts. Similarly, if they cover highly leveraged
(leverage), more previously volatile (retstdpre1) firms, or have greater previous forecast
error/dispersion (afeprcmlag, afeactlag, or afeepslag /displag), they tend to make more forecast error. On the contrary, their forecast error is likely to decrease when analysts have more industry expertise (indexp) or cover higher growth/profitable firms (mb/roa).
4.3.3 Report length and stock recommendation informativeness
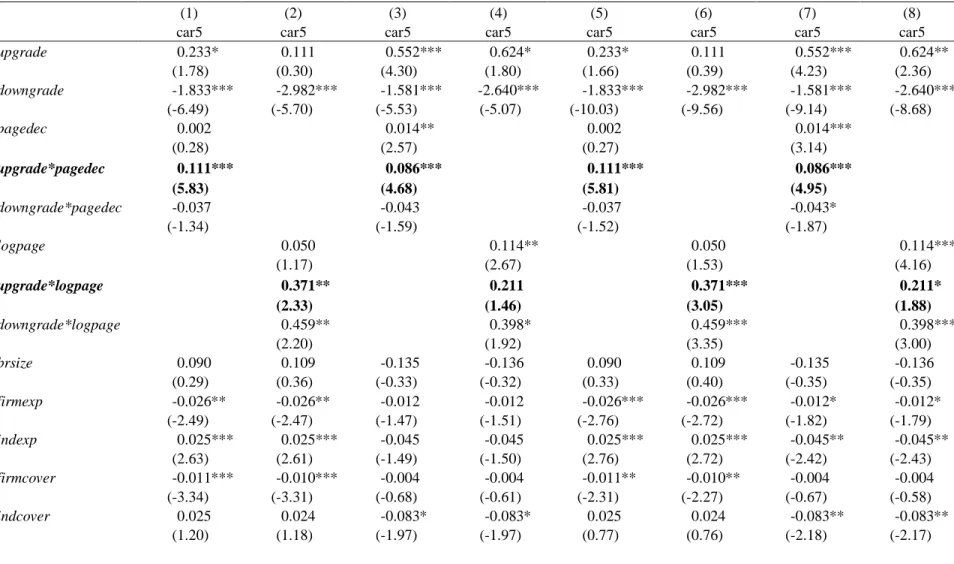
It is well documented that favorable recommendations are perceived to be less credible relative to unfavorable ones since they are optimistically biased especially due to analysts’ conflicts of interest and/or motivation to gain access to management for better information (e.g., Hirst, Koonce, and Simko, 1995; Francis and Soffer, 1997; Michaely and Womack, 1999; Ke and Yu, 2006; Ljungqvist, Marston, Starks, Wei, and Yan, 2007). To enhance the credibility of the former, analysts are likely to justify their optimistic opinions by providing more detailed information, resulting in an increase in the overall amount of information, i.e., a longer report. As a result, investors strongly react to a longer favorable report, whereas they do not show as much strong reaction to an unfavorable report of equal length inherently perceived to be credible by them. Note that as in Table 5, reports with favorable investment advice (i.e., upgrade) are more positively associated with page length than unfavorable ones, suggesting initial evidence that analysts exert efforts on improving the credibility of an upgrade by adding more detailed information.
Panel A of Table 7 displays asymmetric market reaction by showing that relative to a baseline upgrade, investors constantly react more strongly to a longer upgrade report
25
constantly stronger reaction to a longer downgrade report (downgrade*pagedec (or logpage)). In other words, a longer upgrade has a stronger market reaction than a downgrade in the same length. Specifically, the coefficients on upgrade* pagedec (or logpage) are statistically positive across all the models except one, whereas those on downgrade*pagedec (or logpage) are not significant at all, significantly positive or negative, i.e., not consistently negative.12 This supports the prediction that ceteris paribus, stock market shows a stronger reaction to a longer report with favorable recommendations than that with pessimistic opinions.
More importantly, for specifications where the sum of the coefficients on pagedec and
upgrade*pagedec is significantly different from zero, I also report the economic significance of the effect of pagedec for an upgrade. Specifically, Panel B of Table 7 indicates that a one standard deviation increase in pagedec (logpage) when a forecast is an upgrade improves car5
by 13.58% (9.32%) on average, or about 7.94% (7.67%) of the mean car5 on average. 13.58% is economically important given that the average annualized total return for the S&P 500 index over the past 90 years is 9.8%. Overall results suggest the statistical and economic significance of analysts’ research effort component effect of an upgrade report if all the other variables are at a fixed value.
As for analysts’ signals, cumulative abnormal returns (car5) is positively associated with
upgrade across models except two, whereas car5 is significantly negatively with downgrade
across models, suggesting that downgrade is more credible and thus informative than upgrade. As for control variables specific to analysts, car5 has a positive relationship with industry experience (indexp), whereas it is negatively correlated with their firm experience (firmexp) and their report readability (readability), suggesting that industry expertise is more valuable for
26
investors and easy-to-reports do not give information advantage to them. In terms of firm-specific control variables, car5 is negatively related to most of them, e.g., lognanalyst, suggesting no information advantage to investors.
Overall, the results provide robust evidence of a stronger market reaction to a longer upgrade. In other words, by providing more information, analysts make a significant credibility-enhancing effort on upgrade perceived to be less credible relative to that with a downgrade. Considering the significantly positive association between report length and forecast accuracy, this suggests that a longer upgrade becomes credible because of its informativeness through its accuracy.
5. Robustness checks
In this section, using a recommendation level, a within-bank analysis, and an extended model with more controls, I implement robustness tests on the results of Table 7. 13 For brevity, only the coefficients on key variables are reported.
5.1 Recommendation levels: buy and sell
Using recommendation levels, i.e., buy and sell, Panel C of Table 8 replicates the results of Column (1), (3), (5), and (7) of Table 7 and shows that the coefficients on the main interaction term, buy* pagedec are significantly positive across model, confirming the results of Table 7 in terms of main interaction term. More importantly, Column (1) and (2) of Panel A of Table 8 indicates that one standard deviation increase in pagedec increases car5 by 7.72% (6.19%), or about 4.52% (3.62%) of the average car5. Overall, the results suggest that holding other things constant, the statistical and economic importance of research component effect of a buy report on market reaction is substantive.
27
Using within-firm-year and within-analyst-year subsample, untabulated tests show the results similar to those of Table 7. Overall, the robust tests support the credibility-enhancing hypothesis on a longer upgrade report.14
5.2 Within-bank analysis
To control for bank-specific characteristics, I use a report length decile and also include a bank fixed effect in every model. Nevertheless, each investment bank has a different amount of the required disclosure at the end of a research report. To control for this, I replicate the results of Column (2) of Table 7 for each investment bank. Table 8, Panel B, reports the results of the within-bank market reaction analysis using logpage as a main report length proxy. Panel B of Table 8 shows that the coefficients on the interaction term, upgrade*logpage are significantly positive in four out of seven banks, confirming the results of Table 7.15 Using pagedec as its alternative, the results remain unchanged.
5.3 Extended market reaction model
Replicating the results of Column (1) and (3) of Table 7, Panel C of Table 8 shows the results of the extended market reaction model including seven additional control variables from both the determinant and forecast error model, i.e., team, preearn, postearn, crisis, recession,
afeprcmlag, and displag. Panel C of Table 8 displays that the coefficients on upgrade* pagedec
are significant across models, confirming the results of Table 7. Using logpage as its alternative, the results are qualitatively similar. Consistent with Chen, Cheng, and Lo (2010), preearn is more positively associated with car5 than postearn because analysts’ earnings forecasts are more
14 The disclosure rules on analyst conflicts of interest in 2002 increase report length, but the increase does not reflect analysts’ research effort. To control for the disclosure variation between before and after the regulations, I exclude report length variables before 2003, and find that market reaction to a longer report with upgrade are still positively significant. This suggests that report length is a valid proxy for research effort.
28
informative before a firm’s earnings announcements than after. Note that the coefficients on
crisis have a different sign depending on fixed effects, suggesting that a firm-analyst-year fixed effect model is inferior over an industry-bank-year fixed effect model because crisis is highly likely to be negatively associated with car5.
6. Cross-sectional test on market reaction to longer revisions
So far, the paper shows that 1) an upgrade tends to have more information, 2) a longer upgrade is positively associated with accuracy, and 3) a longer upgrade tends to be more informative because it provides more accurate information.
In this section, I cross-sectionally investigate the influence of detailed information, analyst, and information environment traits on report length effect. For this, I rank each trait by a brokerage firm and a forecast year and partition them into two groups by median values. High (low) indicates when the value of each trait is above (below) its median. Yes (no) indicates when the trait (does not) exist(s). The key interaction term of interest is upgrade*pagedec (or logpage). Only the coefficients on key variables are reported for brevity.
6.1 Detailed information traits
The results suggest that analysts exert efforts on improving the credibility of an upgrade by adding more detailed information. Then, the question is what kind of details are, i.e.,
narratives or not. To examine the moderating effect of details on relative market reaction to a longer revision, I create a variable to capture non-narrative valuation summary, table, by counting the number of tables. Tables usually contain the covered firm’s comparative financial or valuation summary in terms of previous, current, and future results. table is mechanically positively correlated with report length. I expect that report length effect is more pronounced for
29
a longer upgrade with a fewer number of tables because tables are in less detail and are not directly related with valuation, but is more likely a presentation of narratives.
Column (1) to (4) of Panel A of Table 9 shows the results on how the number of tables influences the results of Column (1) and (2) of Table 7. Specifically, the coefficients on
upgrade*pagedec in a low table group (i.e. low) are greater than those in a high group (i.e., high) even though the coefficients are not statistically different at the 10% level (Z-test=-0.784). However, the coefficients upgrade*logpage are statistically different at the 10% level (Z -test=-1.931), suggesting that fewer non-narratives generally have stronger report length effect than more non-narratives, consistent with the prediction.
If a page of the report has fewer non-narratives, e.g., a fewer number of tables, one would expect more narratives. Then, another question is whether the market reaction is more
pronounced for a longer upgrade report with more valuation narratives on the covered firm. To address this, I create a narrative valuation-specific variable for cf, calculated as the ratio of the number of cash flow keywords to the total number of words. Untabulated results show that 38.99% of the reports contain cash flow keywords (cf) which are positively related with a longer report. I expect that report length effect is greater for a longer upgrade with more valuation-related narratives (cf) on the covered firm’s cash flow.
The results of Column (5) to (8) of Panel A of Table 9 are consistent with the hypothesis by showing that the coefficients on upgrade*pagedec in a high cash flow group (i.e. high) are statistically bigger than those in a low group (i.e., low) at the 10% level (Z-test=1.870).
However, the coefficients on upgrade*logpage are not statistically different at the 10% level (Z -test-0.574). Overall, this suggests that in general, additional discussion on a cash flow is more useful to enhance the credibility of an upgrade, whereas additional details on non-narrative
30
valuation summary are relatively less useful. In other words, investors are more sensitive to more valuation-specific discussion than to a financial or valuation summary in a table.
6.2 Analyst characteristics
Analyst’s characteristics influence the credibility of upgrade perceived to be less credible and thus, market reaction. For example, investors are less likely to trust an upgrade issued by a less experienced analyst and a busier analyst. Thus, I expect that to increase the credibility of an upgrade from a rookie, she/he tends to provide more information, resulting in a longer upgrade and thus, stronger positive market reaction. Panel B of Table 9 shows the results. high (low) indicates when the median values of an analyst’s firm experience level on the covered firm (firmexp) or busyness level measured as the number of the covered industries (indcover) are above (less) its median.
Specifically, Column (1) to (4) of Panel B of Table 9 reports the results consistent with the experience prediction by showing that the coefficients on upgrade*pagedec
(upgrade*logpage) in a low experienced group are significantly negative and greater than those in a high experienced group at the 10% (5%) level. On the other hand, the results of Column (5) to (8) of Panel B of Table 9 also support the busyness hypothesis because the coefficients on
upgrade*pagedec (upgrade*logpage) in a high busy group are significantly positive and bigger than those in a low busy group at the 10% level (marginally).
Column (9) to (12) of Panel B of Table 9 reports the results of another analyst
characteristic using an indicator variable where an analyst is a female (female). yes (no) indicates when the report is issued by a female (male) analyst. Kumar (2010) finds that a female stock analyst issues more accurate forecasts than a male one, suggesting that her upgrade is more credible than a male’s. Thus, I expect less (more) report length effect in a female (male) group.