experience of software, designed for the usability evaluation of the higher educational websitesin order to enhance the usability. This will provide usinformation of the overall impact of software onend users or developers which will help us to analyze the usability level of our software.
Key words: Usability User experience Higher educational websites
INTRODUCTION [11]. The best method used for the quantitative approach User Experience (UX): According to ISO CD 9241-210, to do such measurement.
the user experience can be defined as “all aspects of the The questionnaire is a quick approach for the user’s experience when interacting with the product, assessment of user experience of any application. service, environment or facility”[1]. We are using a wide range of scale for the questionnaire There is no such agreed definition of UX [2] but most to cover a comprehensive impression of user of the researchers agree that it’s all about usefulness and experience. The format of the user experience supports to usability of software [3,4,5]. Moreover, it can be affected express user’s feeling, attitude and impression by the users’ present state, emotions and perceptions for immediately.
that software [3,4]. According to [6] “Every aspect of the
user's interaction with a product, service, or company that Automated Usability Tool: Following we have defined the makes up the user's perceptions of the whole”. functionality of our tool.
Why to Measure UX:According to Nigel Bevan [7], the Broken Link Checker: We have designed a tool having major reason to measure the usability of any software is the functionality to check the broken links of the to obtain complete understanding of user’s need and to websites, means those links, which cannot be improve the software in order to provide the better UX. redirected on the specified path. We have provided a Measuring UX: There are different UX testing methods as address and search the broken links. We have also given discussed in [8, 9, 10] used to assess the real thoughts of options to check the nested links of websites and also an the end users what they feel about the software. To know option to remove duplicate links found wheearching the value of your application whether it’s better than the broken links. Finally, the tool will search the all others or the development efforts spent on it increases possible links present on the website and broken links. the user experience really paid off?.Therefore, if we want The result will be given in numbers such as 10 broken to know the answers of such questions we need to adopt links found etc. The Fig 1, shows the screen shot of this a quantitative approach to measure the user experience feature.
is questionnaire which efficient and inexpensive method
Fig. 1: Screen shot of broken link checker feature of tool
Fig. 2: Screen shot of "Availability of pages" feature of tool
Fig 3: Screen shot of tool checking links on word "Click here" and "more" feature of tool
Page Availability Test:The page availability feature of In this feature of tool we have given the options to tool will search the following pages in the website. check the nested links and to remove duplicate links for Sitemap page, Contact page, Home page, About us checking the nested links, we have coded in such a way page, News page, Results page, Publication page, that once you have checked the nested links in the broken Research page, Search page, Scholarships page links module then you don’t need to waste the time again better results. To save the evaluation time consumed in
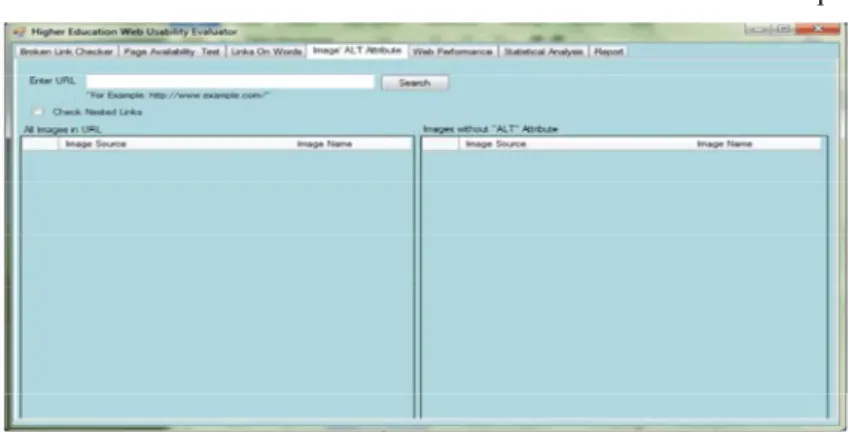
for this module, which will search each word separately in Statistical Analysis: There is need to check the usability its own section. To make this module more efficient we level against these features, therefore we have designed have given the option to search ant other word having a module “Statistical Analysis”. In this module, the total links on it. Here also we can check the nested links for usability score will be calculated which would be out of better results. Finally, the result will be in total number of 16. It was very difficult task to calculate the usability level. links found in each section. The Fig 3, shows the screen There were few usability factors, which were necessary shot of this feature. for the website such as home, contact, about us, sitemap Checking Images Missing “ALT” Attribute: This the part of the website and their presence decreases the module will check those images, which are missing “ALT” usability of the websites such as broken links, images attribute in its source code. We have also given the missing ALT tag and links on some words. Therefore, we option to show the list of all possible images found. Here calculated the usability level as mentioned below. also we can check the nested links for better results. The
result will also be shown in numbers. The Fig 4, shows the If the website contains broken links it should be
screen shot of this feature. given 0 number else 1.
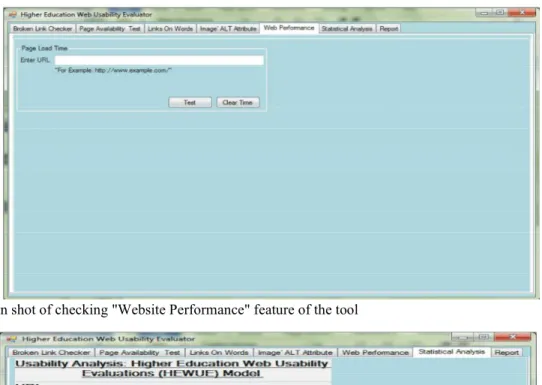
Checking Website Performance:This module will show get 1 else 0, same for all pages.
the loading time of a website. Following there is the If the website contains links on word “click here” it screen shot of this module.In this model, we have set should get 0 else 1, same for all words.
parameters to measure the web performance. The If the website contains images which are lacking alt performance measurement depends on the time required attribute it should get 0 else 1.
to load a website. The Fig 5, shows the screen shot of this For website performance, it is not included in this
feature. module and it is measured separately.
pages while there were a few factors which need not to be
If the website contains a Home page option it should
Fig. 5: Screen shot of checking "Website Performance" feature of the tool
Fig 6: Screen shot of "Statistical Analysis" feature of tool
consisting of few usability factors.They concluded their spanned by the two adjectives on a 7 point scale.Finally research on development in theory and practices in user we validated the results after receiving the response from
experience. the users’.
Angeli [13] worked on the usability evaluation of the
two informative websites. The usability scale was Structure of the Questionnaire: The user consisting of usability factors and user experience factors. experience questionnaire [19] contains 5 scales with 15 Usability measures and expressive aesthetics were items total.
significant predictors of overall preference in their
research. Attractiveness: General impression towards the product.
Lindgaard [14] in his research involves the end users Do users like or dislike the software? SelectedItems: to inspect the given websites of B2C. He also used the annoying / enjoyable, good / bad, unlikable / pleasing, usability and aesthetic factors to evaluate the usability of friendly / unfriendly
the websites.he involved the given factors for inspection;
Perceived usability, Aesthetics, Emotion, Likeability, Efficiency: Is it possible to use the product fast and Expectation and WAMMI standards to measure the efficient? Does the user interface looks organized? users’ satisfaction.
Schenkman [15] used the sample of 13 websites of SelectedItems: Fast / slow, organized / cluttered different domain to check its similarity, complexity,
beauty, meaningfulness and overall impression scale. He Perspicuity: Is it easy to understand how to use the concluded that the beauty was a primary predictor of product? Is it easy to get familiar with the product? overall impression and preferences of websites.
Lavie [16] also worked on usability and aesthetic SelectedItems: not understandable / understandable, factors of 10 websites of different domains. The easy to learn / difficult to learn, complicated / easy, clear evaluation parameters were playfulness and service of / confusing
quality.
Ben-Bassat[17] worked on usability and aesthetic Stimulation: Is it interesting and exciting to use the factor of computerized phonebook. The objectives were product? Does the user feel motivated to further use the to evaluate the performance, preferences, economic product?
measures, usability and aesthetic factors. He found that
there is no effect on user preferences while the auction bis SelectedItems: valuable / inferior, boring / exiting, not has no effect on usability but has aesthetic effect on the interesting / interesting.
product.
Chawda [18] Worked on the Search tool and Novelty: Is the design of the product innovative and evaluated the visual and search tasks of the tool. They creative? Does the software grab users attention? also used questionnaire to evaluate the product. He found
that there is strong relation between pre-use aesthetic and SelectedItems: Creative / dull, conservative /
RESULTS CONCLUSION We sent the questionnaire with the tool to measure
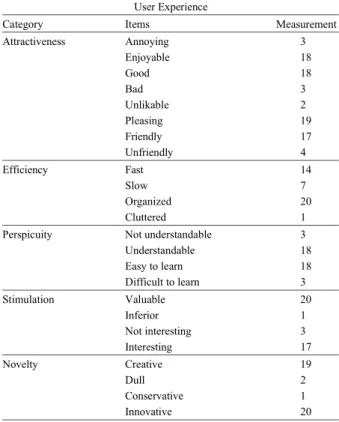
the user experience but we received the results only from 21 developers. They filled the questionnaire and sent back to us. We evaluated and validated the results to measure the user experience. We have shown the graphical representation of the users’ feedback which shows the overall user experience of our usability tool. To answer such questions, it is sufficient to validate the UX results, if the 20 to 30 users of the software fill out the form and send their feedback [20].We have shown the user experience measurement in Table 1 and graphical representation of overall user experience impact on end user in Fig 8.
Fig 8: Graphical representation of measurement of UX Table 1: Measurement of user experience
User Experience
Category Items Measurement
Attractiveness Annoying 3 Enjoyable 18 Good 18 Bad 3 Unlikable 2 Pleasing 19 Friendly 17 Unfriendly 4 Efficiency Fast 14 Slow 7 Organized 20 Cluttered 1
Perspicuity Not understandable 3 Understandable 18 Easy to learn 18 Difficult to learn 3 Stimulation Valuable 20 Inferior 1 Not interesting 3 Interesting 17 Novelty Creative 19 Dull 2 Conservative 1 Innovative 20
The overall feedbacks received from the developers have shown that the usability tool used for evaluation of higher educational websites has good user experience and they feel happy to use this software. Moreover, the feedback also show that still the efficiency of the software needs improvements in order to increase its user experience in terms of usability. They found the software innovate and helpful to evaluate the websites which can evaluate the websites in an organized way. They also appreciated this idea which is innovative used to enhance the usability of the educational websites. Finally they found the tool valuable and innovative.
REFERENCES
1. ISO CD 9241-210, 2008. Ergonomics of human-system interaction. Part 210: Human-centred design process for interactive systems. ISO.
2. Law, E., V. Roto, A. Vermeeren, J. Kort and M. Hassenzahl, 2008. Towards a Shared Definition for User Experience. Special Interest Group in CHI’08. Proc. Human Factors in Computing Systems, pp: 2395-2398.
3. Alben, L., 1996. Quality of Experience: Defining the Criteria for Effective Interaction Design. Interactions, 3(3): 11-15.
4. Hassenzahl, M. and N. Tractinsky, 2006.User Experience-a Research Agenda. Behaviour andInformation Technology. 25(2): 91-97.
5. UPA (Usability Professionals’ Association), 2008. “Usability Body of Knowledge”, http://www. usabilitybok. org/glossary.
6. Mäkelä, A. and J. Fulton Suri, 2001. Supporting Users’ Creativity: Design to Induce Pleasurable Experiences. Proceedings of the International Conference onAffective Human Factors Design, pp: 387-394.
7. Nigel, B., 2008.Classifying and Selecting UX and Usability Measures, VUUM 2008, Reykjavik, Iceland. 8. Laugwitz, B., T. Held and M. Schrepp, 2008. Construction and evaluation of a user experience questionnaire. In: Holzinger, A. (Ed.): USAB 2008, LNCS 5298, pp: 63-76.
9. Laugwitz, B., M. Schrepp and T. Held, 2006. KonstruktioneinesFragebogenszurMessung der User Experience von Softwareprodukten [Construction of a questionnaire to measure the user experience of software products]. In: A.M. Heinecke, H. Paul (Eds.): Mensch und Computer imStrukturwandel. Oldenbourg Verlag. pp: 125-134.
Arnold Vermeeren, Marc Hassenzahl, and Mark the User Experience Questionnaire (UEQ). CIST,
Blythe (Eds.), Lancaster, UK. pp: 471-476.
13. Angeli, D., A. Sutcliffe and J. Hartmann, 2006. 20. Laugwitz, B. ,U. Schubert, W. Ilmberger, N. Tamm, Interaction, usability and aesthetics: What T. Held and M. Schrepp, 2009. “Subjektive influences users' preferences? In Proc. DIS 2006, Benutzerzu friedenheit quantitativer fassen:
Penns. USA. Erfahrungenmitdem User Experience Questionnaire
14. Lindgaard, G. and C. Dudek, 2003. What is this UEQ [Quantitative measurement of subjective user evasive beast we call user satisfaction. Interacting satisfaction: Experiences with the user experience withComputers, 15: 429-452. questionnaire UEQ]“. Usability Professionals, 15. Schenkman, B. and F. Jönsson, 2000. Aesthetics and pp: 220 - 225.
preferences of web pages. Behaviour and InformationTechnology, 19(5): 367-377.