28.75%
8.34%
0% 20% 40%
URMs as percentage of US population URMs as percentage of STEM PhD recipients
Minority Students Severely Underrepresented in
Science, Technology Engineering and Math
Simeon P. Slovacek, Alan R. Peterfreund Glenn D. Kuehn,
Jonathan C. Whittinghill Susan Tucker Kenneth A. Rath Yvonne G. Reinke
California State University E&D Associates Peterfreund Associates New Mexico State UniversityIntroduction
Minority students, Asians excepted, are
se-verely underrepresented in the fields of science,
technology, engineering, and math (STEM) at the national level in the United States [23], [25], 26]. Overall, these students encounter greater
difficulties in obtaining undergraduate and grad -uate degrees [25] and typically take longer to graduate than their Caucasian and Asian peers. Furthermore, minority students enter college less prepared than non-minority students [4],
21]. Data from the National Science Founda
-tion as of 2006 on underrepresented minorities (URMs) receiving doctorates in STEM fields is presented in Figure 1 below. The propor
-tion of doctorates awarded to URMs lags far behind their representation in the general US population. Only 8.34% of the STEM doctorates awarded in 2006 were given to URMs, despite making up approximately 28% of the US popu -lation.
Furthermore, a report to Congress by the United States Government Accountability Of
-fice [36] noted that while the percentage of un
-derrepresented minorities nationwide increased from 13% (1994-95) to 19% (2002-03), the total number of STEM doctorates awarded to the same group dropped during this period from 8,335 to 7,310.
In response to the chronic
under-represen-tation of minorities in the sciences, the National Institute of General Medical Sciences (NIGMS)
created the Minority Opportunities in Research (MORE) Division and similar academic
interven-tion programs. The amount of funds dedicated to these programs reflects the commitment of the MORE Division in addressing this problem. In 2007, NIGMS’ annual budget was $1.9 bil
-lion, of which nearly $126 million was spent on
its MORE programs [22]. This amount includes the Minority Biomedical Research
Support-Research Initiative for Scientific Enhancement
(MBRS-RISE) program, the Minority Access to
Research Careers (MARC), Post-baccalaure -ate Research Education Program (PREP), and the Bridges to the Baccalaureate and Bridges to the PhD programs. The present study
exam-ined the components and the effectiveness of large MORE programs at three public universi
-ties which have been supported by a variety of NIH and NSF sources.
Background to the Study: MORE programs and Effective Interventions
The MORE programs are comprised of four
primary components: research experience, mentoring and advisement, supplemental
in-struction and workshops, and financial support.
Research experiences are the cornerstone
Figure 1. Underrepresented minorities as a percentage of the US population and of STEM doctorates recipients
of the MORE programs; all students work on-campus in faculty-run labs. Students are paid through these research placements, freeing them from having to take part-time work off
campus. All research activities are supervised
by faculty, who will also often serve as mentors and advisors for the students. There are also opportunities for students to take part in supple -mental instruction sessions to complement their
courses, and workshops related to career op -tions, graduate study, and test preparation. Research experience in the undergraduate
years can be a means to encourage students to think of themselves as scientists [13], [31], and to aid students in solidifying career plans in the sciences [16], [15], [18]. Research was also found to be a positive predictor of a sense of “belonging” among URMs in Hurtado et al [14], who investigated the college transition experi
-ence of URMs in the biomedical and behavioral
sciences. In examining a summer
undergradu-ate research experiences at four liberal arts colleges, Hunter, Laursen, and Seymour [13] reported that 92% of participating students re
-ported gains stemming from the research ex
-perience, with a substantial proportion of those gains reflecting their ability to think and work like scientists. This finding was corroborated by a survey of the faculty advisors, who also observed large gains in those areas.
Beyond their impact on student perception,
research experience can also have a profound
impact on academic achievement and student
retention. In their evaluation of the Biology Un -dergraduate Scholars Program (BUSP) at the
University of California, Davis, an undergradu -ate research program targeted at URMs,
Bar-low and Villarejo [3] reported higher retention
rates among program participants than those in
the control group. Nagda et al [20] had similar results in investigating the impact of an under -graduate research program on student
reten-tion. In particular, they found that the research program benefited African-American students most strongly, especially those whose GPAs were lower than the median for all
African-American students. Both Astin and Astin [2] and
Wright et al [37] also found research experience to be positively associated with persistence, retention, and academic performance within STEM majors.
Multiple studies (e.g., [8], [10], [28], and oth
-ers) stress the importance of student-faculty
interaction on retention and student success.
As with the research experiences themselves, relationships with faculty mentors can aid in the incorporation of students into the academic/sci
-entific community. For minority students whose
mentor is also a minority, that relationship can
serve as a powerful reminder that the prevail
-ing stereotypes of minorities in the sciences can be overcome [34]. Beyond retention, Hill, Pettus, and Hedin [12], analyzing three studies investigating minority attitudes towards science careers, found that the most significant factor in making science-related career choices was an acquaintance with a practicing scientist. Faculty mentors can fulfill multiple roles for students not just as teachers and research advisors, but also
as role models and career inspirations.
The benefits of supplemental instruction are discussed in Peterfreund et al [29] and Rath et al [30], both of which examine the impact of the supplemental instruction on URM performance
at San Francisco State University. Over a six
year period, participants were found to be more
likely to pass the corresponding courses than
those who did not receive supplemental instruc
-tion [30]. Students who partook in supplemental instruction also demonstrated better progres
-sion through subsequent courses [29]. The impact of this intervention was particularly pro
-nounced for URMs.
Financial support is of particular importance given that while URMs are more likely to receive
aid than their Caucasian or Asian peers, the aid
they receive is on average less [24]. Hurtado et al [14] found that URMs were frequently impacted by financial and family pressures, and were likely to be more concerned with the ability to finance college. The National Sci
-ence Foundation [24] reported that low-income students, which include many URMs, typically have $3,500 in unmet aid each year, which is often made up through part-time work. Gardner and Broadus [7], in investigating the factors re -lated to retention in the engineering program at
Michigan State University, reported that African American students on average worked twice as many hours outside the university to finance their education, which negatively impacted their
studies as a result.
The importance of financial support not
-withstanding, Fenske, Porter and DuBrock [6] studied the impact of aid on the retention of
science and engineering students at a large
public university and found that even the com -paratively large aid packages granted to URMs
are not sufficient to curb the attrition amongst this population. They cite the need for “…early
intervention and orientation programs, and
other academic and social support resources,” (p. 85) to further promote retention and degree completion for underrepresented minorities.
Supporting URMs in the sciences requires
more than just a financial investment; programs and interventions must be tailored to address the unique challenges they face.
In addition to the individual impact of each of the above interventions, of equal importance is the impact and interaction of multiple interven
-tions and environmental factors regarding stu -dent outcomes. Research into similar programs containing multiple interventions demonstrates
that the interactions between components are crucial to understanding the impact of the pro
-gram as a whole. Astin [1] identified interaction between faculty and students as having a posi
-tive impact on student performance; however, the students’ perception of their performance was often dependent on the type of faculty. Those faculty rated as more “student-centered” were associated with students having more posi
-tive perceptions of their academic performance, whereas faculty seen as “research-centered” were associated with negative perceptions. Gilmer [9] also examined a multiple-component STEM education program, and found differing levels of impact for each of the program com
-ponents. The Summer Bridge component for incoming freshman, for instance, was found to have a substantial impact on academic perfor -mance.
The primary focus of the majority of re
-search into the effectiveness of interventions has been academic performance and student
retention [2], [3], [8], [11], [32]. While
reten-tion is indeed of vital importance with respect to increasing the number of underrepresented minorities entering the STEM fields, it is not the only consideration. Of equal, if not greater, im
-portance is the ability of interventions to propel URMs beyond undergraduate study into mas
-ter’s and PhD programs, and ultimately into
careers as research scientists. Some studies
(e.g. [3], [17], [19]) do examine the impact of
undergraduate research programs on graduate
program entrance with positive results; howev -er, more research is needed in order to develop
a more comprehensive model of those factors that influence the entrance of URMs into gradu
-ate study and beyond. To address that need,
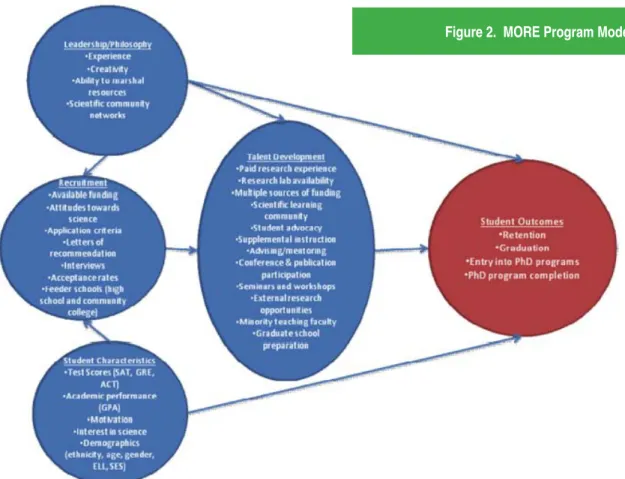
Slovacek et al. [33] developed a model
relat-ing student outcomes to specific interventions,
student characteristics, university recruitment strategies and program leadership. That model
is reproduced below and serves as the theoreti
-cal basis for the current study.
Methodology
Previous research strongly suggests that
research-based interventions like the MORE
programs can have a positive impact on student
achievement. The current need is for research investigating the impact of multiple, simultane -ous interventions on their target populations.
Studying multiple interventions not only better
mimics the academic environment that many
underrepresented minorities exist in, but will allow institutions to better leverage resources
and curricula to increase student success.
Furthermore, a shift in emphasis away from re
-search regarding student retention and towards
student entrance into and success in PhD
pro-grams would provide institutions with informa
-tion regarding the more long-term impacts of
their programs. To that end, the current study
is concerned with the following research ques -tion:
What program interventions and other fac
-tors contribute the most toward underrepre
-sented minority college students’ progress in biomedical fields toward earning their Ph.D.s?
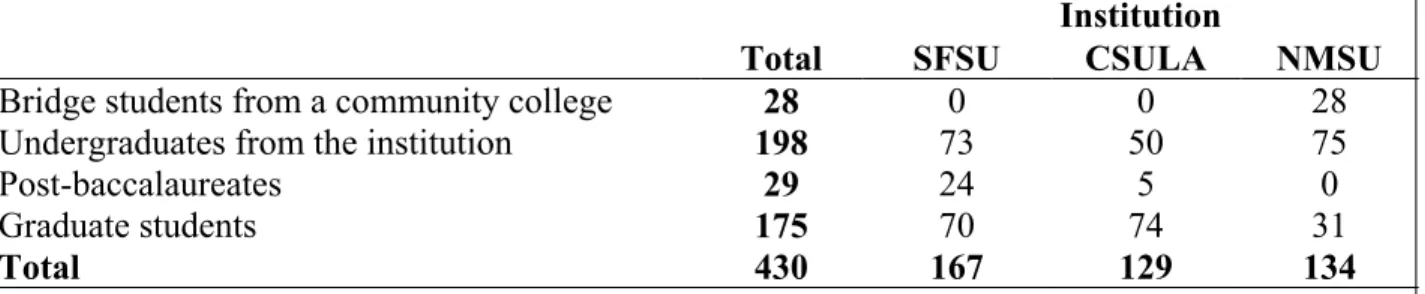
Participants
The participants in this study were drawn from three public universities: California State University, Los Angeles (CSULA), New Mexico State University (NMSU) and San Francisco
State University (SFSU). The current study
involved the participation of 430 undergradu -ate and gradu-ate students enrolled at the three
universities and funded by at least one of the MORE programs. Data was initially to be col -lected on all MORE students enrolled at the
three universities between 2004 and 2007, though some students were excluded due to opting out of the data collection process. Table 1 provides the breakdown of students by institu -tion and student status.
Both CSULA and SFSU are part of the Cali
-fornia State University system and offer both undergraduate and master’s level programs. NMSU offers programs up to and including the
doctoral level, and all three serve large
popula-tions of minority students. These three universi
-ties were selected because of their capacity to sustain funded support programs for minority
students in the biomedical fields during the past 15 to 35 years and for their ability to success
-fully prepare students for doctoral studies. To test the overall impact of the MORE logic model (see Figure 2 above), Slovacek et al. [33] found that in 2005-2006 87% of graduates from the
MORE programs continued on to an advanced
degree program (PhD, MD, or MS), with the majority opting to begin work towards a PhD. At the time the data were collected, the stu -dents in the study had a median age ranging
from 26 to 30 at the three institutions, (average age was 27). The majority (60%) was female, and largely Hispanic (42%) though there were significant minorities of Pacific Islanders, Afri
-can Ameri-can and Native Ameri-can students. All participants were students supported through NIH MORE funded programs. Students
could participate in more than one MORE
pro-gram over the course of their time at the insti
-tution (the average number was 1.5 funding programs for the whole set of participants), and many graduate students had received funding from MORE or similar programs as undergradu
-ates as well.
Data Collection
Data collection consisted of two stages. The authors first collected information on students’ backgrounds, demographics and academic
history, and program participation. The
sec-ond stage focused on students’ current highest level of education, as well as applications and
entrance into PhD programs.
Data on student background demographics, in -terest in the sciences, motivation, participation and experiences in the various MORE program
interventions was collected from a series of surveys taking place between 2005 and 2007. Specifically, the project employed the following surveys to gather student information:
• Three student surveys
• Institutional student portfolios with student background data from university records
Total
SFSU
Institution
CSULA
NMSU
Bridge students from a community college
28
0
0
28
Undergraduates from the institution
198
73
50
75
Post-baccalaureates
29
24
5
0
Graduate students
175
70
74
31
Total
430
167
129
134
Table 1. Breakdown of Students in the Study by Institution and Student Status
Instrument Date Students completing Student characteristics Data Categories Collected Research
interventions Academic indicators Other CSULA SFSU NMSU Gender Ethnicity institution
Pre-history
Program
support Research activities completion Course GPA Standardized test scores toward Ph.D.s Success Student Survey Fall 05 38 52 49 Student survey Spr 06 47 80 29 Student survey Spr 07 67 32 60 Institutional portfolio Spr 07 103 120 123 Background data form Spr 06 64 101 53 Institutional portfolio Spr 07 86 56 122 Research advisory survey Spr 06 53 34 30 Research advisory survey Spr 07 41 25 36 Student Degree Status
and Progress Wint 08 107 128 101
• Two surveys of the students’ faculty re -search advisors
Information on student degree status and academic achievement was acquired from both
institutional records kept at each university as
well as records from each of the MORE program offices. All surveys and forms were developed by the research team expressly for this project, drawn from the case studies, previous evalu
-ative surveys, and other work performed prior to the receipt of the grant. As per Institutional Review Board requirements, only students from whom consent forms were obtained are includ
-ed in the studi-ed database. A summary of the data collected through each instrument can be found in Table 2.
The types of questions asked on each of the
three student surveys varied depending on the
time at which they were administered; the 2005 Fall Survey focuses on background information while the 2006 Spring Survey focused more on end-of-year reflections. The 2007 Spring Survey was designed to include information from both the previous Spring Survey as well as the Fall Survey. Response rates for each of the surveys varied by campus, and most students supplied unique identifiers which allowed surveys to be linked across administrations while preserving
anonymity.
Students’ research advisors (generally fac
-ulty members who ran the labs in which the students worked) were also surveyed to gather their opinions regarding students’ ability to ob
-tain an advanced degree, as well as to reflect
on their experiences working with the students in a research setting. The background data form collected data on participation in specific MORE interventions, conference attendance and journal publications, as well as their history in attending institutions of higher education. Updates regarding students’ current level of education and progress towards a PhD were made through each of the MORE program offic
-es. Information included graduation dates, the highest degree attained, whether the student had applied or been accepted into a graduate degree program. Variables included status to
-wards each type of degree (baccalaureate, Masters, PhD) and whether or not the student was still pursuing education in the sciences. Data from all surveys was combined with that from institutional and program records to create a single dataset. Survey data was
updated as necessary using unique student
identifiers, and in the case of questions asked over multiple surveys, preference was given
to the most recent data. The resulting dataset
contained 430 students funded by the MORE programs. Variables were then organized into four groups corresponding to the four factors outlined in Figure 2 above.
Analysis
To facilitate analysis, a single outcome vari
-able was calculated, coded as follows: 0: The student does not plan on getting a PhD
(includes both current students and gradu
ates)
1: The student plans on getting a PhD, but has
not entered a doctoral program
2: In the process of completing a doctoral pro -gram,
3: Completed a doctoral program.
The variable was designed as such to in
-clude both students who had sufficient time over the research period to graduate from their
respective programs and enter PhD study, and
those who have not yet finished their programs
at the three participating universities.
Multiple linear regression analysis was per
-formed using the above dependent variable to determine which variables most strongly pre
-dicted the planning of, acceptance into, and completion of a PhD program in the biomedical sciences. To test the model shown in Figure 2, independent variables were first organized into three of the four major blocks of the MORE
model: Talent development, Student
charac-teristics, and Leadership/philosophy as dis
-cussed above. Variables related to the fourth block, Recruitment and Intake, were not col
-lected during this phase of the study. Stepwise regression was then performed in each block separately to determine which variables within each block contributed most to the variance in
the outcome variable. Variables were entered
into the regression model provided the F-ratio
was significant at the .05 level, and removed if the F-ratio significance level rose above .10. A second stepwise regression was then conduct
-ed containing only those variables which had been significant in each block, again using the same criteria for entrance and removal. After determining which variables were no longer sig
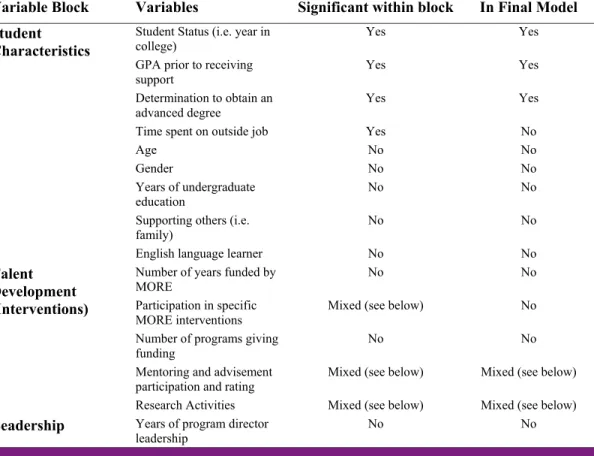
-nificant predictors in this second model, a third and final linear regression was performed using only those variables which were significant at the .05 level in both previous models. Table 3 gives the variables used in each block, as well as whether it was significant within its block and whether it was retained in the final regression model. In all three models, missing cases were removed from the analyses via pair-wise dele
-tion of variables for subjects with missing data. There were a number of variables which coded participation in each of specific interven
-tions, as well as mentoring and advisement and specific research activities. Some of the variables within these groups were significant within their block, though none of the variables related to participation in specific interventions were retained in the final regression model. The results section below details the variables in
-cluded in the final model.
Variable Block Variables Significant within block In Final Model Student
Characteristics Student Status (i.e. year in college) Yes Yes GPA prior to receiving
support Yes Yes
Determination to obtain an
advanced degree Yes Yes
Time spent on outside job Yes No
Age No No
Gender No No
Years of undergraduate
education No No
Supporting others (i.e.
family) No No
English language learner No No
Talent Development (Interventions)
Number of years funded by
MORE No No
Participation in specific
MORE interventions Mixed (see below) No Number of programs giving
funding No No
Mentoring and advisement
participation and rating Mixed (see below) Mixed (see below) Research Activities Mixed (see below) Mixed (see below)
Leadership Years of program director
leadership No No
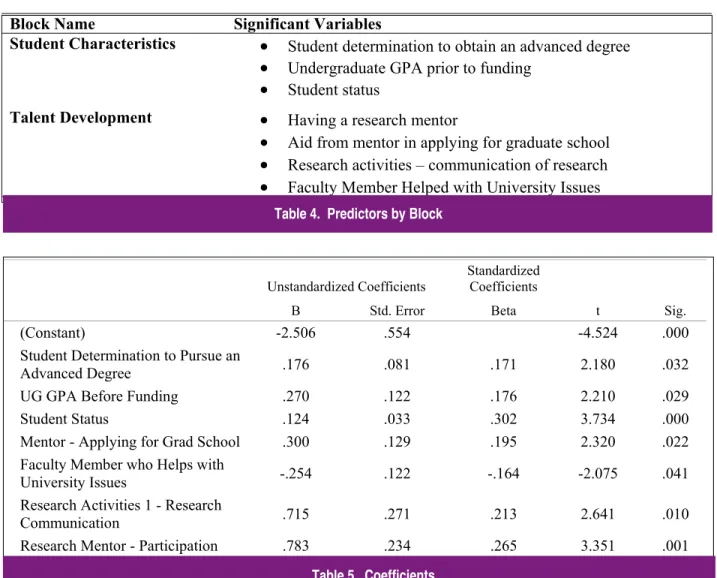
Block Name Significant Variables
Student Characteristics
Student determination to obtain an advanced degree
Undergraduate GPA prior to funding
Student statusTalent Development
Having a research mentor
Aid from mentor in applying for graduate school
Research activities – communication of research
Faculty Member Helped with University IssuesResults
The final regression model contained seven variables among two blocks. Table 4 below dis
-plays these variables by block. Within the tal
-ent developm-ent block, three of the m-entoring variables, (having a mentor, receiving aid from that mentor in applying for graduate school, and having a faculty member who helped deal with university issues), and one of the research ac
-tivity variables (participating in communicating research to others) were significant predictors of the outcome variable. Likewise a student’s own rating of their determination to obtain an
advanced degree, their GPA prior to receiving
funding, and their student status were also sig
-nificant predictors.
Standardized and unstandardized beta weights, along with t-scores and significance levels for each of the variables in the regression model are given below in table 5.
Given that all variables were significant at the p < .05 level, it is unlikely that their status as
predictors is due to chance or sampling error.
Note that all variables were positive predictors of the outcome variable, with the exception of having a faculty member who helped with uni -versity issues.
Table 6 details the results of the regression analysis as each block was entered into the
Unstandardized Coefficients Standardized Coefficients
t Sig. B Std. Error Beta
(Constant) -2.506 .554 -4.524 .000
Student Determination to Pursue an
Advanced Degree .176 .081 .171 2.180 .032
UG GPA Before Funding .270 .122 .176 2.210 .029
Student Status .124 .033 .302 3.734 .000
Mentor - Applying for Grad School .300 .129 .195 2.320 .022
Faculty Member who Helps with
University Issues -.254 .122 -.164 -2.075 .041
Research Activities 1 - Research
Communication .715 .271 .213 2.641 .010
Research Mentor - Participation .783 .234 .265 3.351 .001
Block
R
R Square
Adjusted R
Square
Std. Error of
the Estimate
Student Characteristics
.527
.278
.257
.666
Talent Development
.668
.447
.407
.595
Table 4. Predictors by Block
Table 5. Coefficients
model. At the final step of the model, the ad
-justed R2 was .407, meaning that the ad-justed model was able to account for approximately 41% of the variance in the outcome variable.
Discussion
The independent variables in the regression model indicate several important factors in in
-creasing the likelihood of a student pursuing a PhD. The first is that while all MORE program
students are required to participate in some
form of research, certain activities have a great -er impact than oth-ers in motivating and
prepar-ing a student towards doctoral graduate study. In our analysis, students who participated in
communicating their research experience and
findings through a poster or a talk at a confer
-ence were more likely to plan on and pursue
PhDs. This is perhaps not surprising as this sort
of activity is precisely what students know will be expected of them in graduate doctoral stud
-ies. Secondly, having a faculty member act as
a research mentor to guide the student through
the research experiences made a significant
impact on student outcomes. While having a
mentor itself was clearly important, being able to use the mentor as a source for information and advice regarding applying for graduate school was also a strong indicator of student
success.
Another related variable in the interventions block was having a faculty member who helped
students navigate university-related issues and
challenges. This would include cutting through “red tape,” for instance regarding registering for classes, receiving promised financial aid checks, and generally dealing with the type of bureaucracy found at universities. This vari
-able contributed negatively to the regression; its presence was more strongly associated with those students who chose not to pursue PhD
study. This result suggests that those students
who encountered such serious issues that they needed help from a faculty member to resolve were less likely to plan on or pursue a higher
degree.
In addition to the MORE program
interven-tions, a student’s own determination to obtain an advanced degree proved to be a strong predictor of PhD study. This is promising in that among the goals of the MORE programs, and of
many academic interventions, is increasing that
determination. However, that goal is based on
the assumption that individual determination is
in fact correlated with future success, which this analysis shows to be the case. Two additional
variables in the regression model reflect this de
-termination: academic background and current level of education.
The students’ undergraduate GPA prior to
entering the MORE program played a role in predicting eventual PhD study, and likely serves
as an indicator for those who are academically successful enough to get into doctoral programs in the biomedical sciences. The student status variable encodes the current educational status of each student (years of undergraduate and
graduate study), and is used in this analysis as
a form of control with respect to time. The time limitations of the data collection were such that it was not possible to allow time for all students
involved in the study to have the opportunity to
apply for and complete a PhD. Therefore the student status variable serves to control for those students who remained undergraduates at the last time of data collection, and hence were not yet eligible for PhD study.
Excluded Variables
Given that the database used in this analy
-sis included approximately 200 unique vari
-ables, of which only seven remained in the analysis, some mention should be given to those excluded variables. Among the variables not found to be significant predictors of PhD study were age, ethnicity (all the participants were underrepresented minorities), parents’ educational background, having to provide sup
-port to family members while in school, work
-ing outside of school, standardized test scores
(SAT, ACT, GRE, and AP credits), and several
other MORE interventions. Reasons for exclu -sion varied. While it is certainly the case that
some variables simply had no impact on stu
-dents’ plans, others may have been excluded due to multicollinearity or a lack of variance in
response. All students involved in the analysis
were funded by MORE or similar programs, and therefore most would give similar responses to, for instance, variables relating to participation
in MORE program interventions. Participation in
research, for example, was answered in the af
-firmative by nearly all of the 430 students in the analysis, and as such was of limited use in the
analysis.
The final reason a variable might have been excluded from model was an excessive number of missing values. While the response rate on the combined survey data was generally fa
-vorable, approaching 85%, data on academic characteristics collected from university records were more sparse. In particular values for stan
for in the final database, thus limiting the predic
-tive power of those variables.
Further Research
The authors concur with the recommenda
-tions in the NIGMS white paper addressing
MARC programs [27] suggesting that more
research is needed to better understand the effectiveness of interventions. The next logi
-cal step in the research based on these find
-ings is to conduct a longitudinal study of these
students and graduates, tracking their progress in graduate studies at the doctoral level and through their careers as scientists. The
cur-rent study was limited in scope to the years for which data were available; this meant there was an insufficient amount of time to longitu
-dinally track the majority of students as they earned their baccalaureates and pursued, then
completed an advanced PhD. degree. A study
which examines students as they begin their studies within MORE funded programs and fol
-lows a cohort(s) to the completion of PhD study would yield more thorough evidence regarding the effectiveness of research interventions than this study is capable of offering. Although there have been numerous publications that address the issue of a lack of under-represented minor -ity students pursuing or completing advanced
degrees [5] few research studies have been conducted on the career paths of those who
have earned advanced (doctoral) degrees in
the biomedical sciences. Such research of
underrepresented minorities on PhD. holders
would be a step forward. The research team is currently conducting a resume analysis [35] of over 100 MORE RESULTS students who have completed their doctorates in order to better un -derstand their career arcs.
A final suggestion for broadening this line of research would be to include more universities
and colleges that provide support programs in
the sciences for under-represented minority students. This would enhance the generaliz
-ability of this work.
References
1. Astin, Alexander. (1993). What matters in college? Four critical years revisited.
Jossey-Bass: San Francisco.
2. Astin, A. W., & Astin, H. S. (1992). Under
-graduate science education: The impact of different college environments on the edu
-cational pipeline in the sciences. Los An
-geles: University of California, Los Angeles, Higher Education Research Institute.
3. Barlow, E. L., & Villarejo, M. (2004). Mak
-ing a difference for minorities: Evaluation of an educational enrichment program. Journal of Research in Science Teaching, 41(9), 861-881.
4. Campbell, J. R., Hombo, C. M., and Mazzeo, J. (2000). NAEP 1999 trends in academic progress: Three decades of stu
-dent performance. Washington DC: U.S. Department of Education’s Office of Educa
-tional Research and Improvement. NCES 2000-469.
5. Chapa, J., & De La Rosa, B. (2006). The problematic pipeline: Demographic trends
and latino participation in graduate science, technology, engineering, and mathematics
programs. Journal of Hispanic Higher Edu
-cation, 5(3), 203-221.
6. Fenske, R. H., Porter, J. D., DuBrock, C. P. (2000) Tracking financial aid and per
-sistence in women, minorities, and needy
students in science, engineering, and
mathematics. Research in Higher Educa
-tion, 41(1), 67-94.
7. Gardner, P.D., Broadus, A. (1990). Pursu -ing an engineer-ing Degree: An examination
of issues pertaining to persistence in engi -neering. Collegiate Employment Research Institute, Michigan State University.
8. Gerdes, H., Mallinkrodt, B. (1994) Emo
-tional, social, and academic adjustment of college students: A longitudinal study of retention. Journal of Counseling and Devel -opment, 72, (3), 281-288.
9. Gilmer, C. T. (2007). An understanding of the
improved grades, retention and graduation
rates of STEM majors at the Academic Invest -ment in Math and Science (AIMS) program
of Bowling Green State University (BGSU). Journal of STEM Education, 8(1), 11-21. 10. Griffith, K. (1996). First-year composi
-tion and student reten-tion: The neglected goal. Paper presented at the Annual
Meeting of the Conference on College
Composition and Communication,
Mil-waukee, WI. Available online at http:// www.eric.ed.gov/contentdelivery/servlet/ ERICServlet?accno=ED397412.
11. Harter, J., Szurminski., M (2001). PASS program (Project Assuring Student Suc
-cess) Mercy College of northwest Ohio. Unpublished paper. Abstract available at: http://www.eric.ed.gov/ERICWebPortal/ custom/portlets/recordDetails/detailmini. jsp?_nfpb=true&_&ERICExtSearch_Sea rchValue_0=ED453887&ERICExtSearc h_SearchType_0=no&accno=ED453887
12. Hill, O.W., Pettus, W.C., & Hedin, B.A. (1990). Three studies of factors affecting the attitudes of blacks and females toward the pursuit of science and science-related careers. Journal of Research in Science Teaching, 27(4), 289-314.
13. Hunter, A., Laursen, S. L.,Seymour, E. (2007). Becoming a scientist: The role of undergraduate research in students’ cog
-nitive, personal, and professional develop
-ment. Science Education, 91(1), 36-74. 14. Hurtado, S., Han, J. C., Saenz, V. B., Es
-pinosa, L. L., Cabrera, N. L., & Cerna, O.S. (2007). Predicting transition and adjust
-ment to college: Minority biomedical and behavioral science students’ first year of college. Research in Higher Education,
48(7), 841–887.
15. Kardash, C. M. (2000). Evaluation of an
undergraduate research experience:
Per-ceptions of undergraduate interns and their faculty mentors. Journal of Educational Psychology, 92(1), 191–201.
16. Kinkead, J. (2003). Learning through inqui
-ry: An overview of undergraduate research. New Directions for Teaching and Learning, 93, 5–17.
17. Lewis, D. J. (1991). Mathematics and women: The undergraduate school pipe
-line. Notices, 38(7), 721-723.
18. Lopatto, D. (2004). Survey of undergradu -ate research experiences (SURE): First
findings. Cell Biology Education, 3(4), 270–
277.
19. Maton, K. I., Hrabowski, F. A., & Schmitt, C. L. (2000). African American college stu -dents excelling in the sciences: College
and postcollege outcomes in the Meyerhoff Scholars Program. Journal of Research in Science Teaching, 37(7), 629–654. 20. Nagda, B. A., Gregerman, S. R., Jonides,
J., von Hippel, W., & Lerner, J. S. (1998). Undergraduate student–faculty research partnerships affect student retention. The Review of Higher Education, 22(1), 55-72. 21. National Assessment of Educational Prog
-ress. (2001). The nation’s report card sci
-ence. Online: http://nces.ed/gov/nation
-sreportcard/science (Dec, 2001)
22. National Institute of General Medical Sci
-ences (2008). National Institute of Gen
-eral Medical Sciences Fiscal Year 2009 Budget: Budget authority by program. Retrieved July 3, 2008, http://publications. nigms.nih.gov/cjs/2009/budget_act.html.
23. National Science Foundation (NSF). (2007). Women, minorities, and persons
with disabilities in science and engineer
-ing, 2007. Arlington, VA: Author. NSF
07-315.
24. National Science Foundation (NSF). (2003). Women, minorities, and persons with disabilities in science and engineer
-ing, 2002. Arlington, VA: Author. NSF
03-312.
25. National Science Foundation (NSF). (2000). Women, minorities, and persons with disabilities in science and engineer
-ing, 2000. Arlington, VA: Author. NSF
00-327.
26. National Science Foundation (NSF). (1999). Women, minorities, and persons with disabilities in science and engineer
-ing, 1998. Arlington, VA: Author. NSF 99-97.
27. NIGMS Division of Minority Opportunities in Research (2006, January) “White Pa
-per” on the MARC undergraduate student
training in academic research (U*STAR)
program. National Institutes of Health. 28. Pascarella, E.T., Terenzini, P.T. (1980).
Predicting freshman persistence and vol
-untary dropout decisions from a theoretical model. Journal of Higher Education, 51, 60-75.
29. Peterfreund, A. R., Rath, K. A., Xenos, S. P., & Bayliss, F. (2008). The impact of
supplemental instruction on students in
STEM courses: Results from San Fran
-cisco State University. Journal of College Student Retention, 9 (4), 487-503. 30. Rath, K., Peterfreund, A., Xenos, S., Bay
-liss, F., Carnal, N., (2007). Supplemental
instruction in Introductory Biology I:
En-hancing performance and retention of
underrepresented minority students. CBE-
Life Sciences Education, 6, 203-216. 31. Seymour, E., Hunter, A., Laursen, S. L., &
Deantoni, T. (2004). Establishing the ben
-efits of research experiences for under
-graduates in the sciences: First findings from a three-year study. Science Educa
-tion, 88(4), 493–594.
32. Seymour, E., Hewitt, N.M. (1997) Talking about leaving: Why undergraduates leave the sciences. Westview Press: Boulder,
CO.
33. Slovacek, S.P., Tucker, S. & Whittinghill,
J. (2008). Modeling minority opportunity programs: Key interventions and success indicators. Journal of Education and Hu -man Development, 2(1). Online: http:// www.scientificjournals.org/journals2008/ articles/1329.pdf
34. Steele, C. (1997) A threat in the air: How
stereotypes shape intellectual identity and
performance. American Psychologist, 52(6), 613-629.
35. Tucker, S & Slovacek, S. (2007, Novem
-ber). Learnings from Resume-Analysis of STEM minority students: A tool to analyze career pathways and evaluate doctoral
programs. Paper presented at the annual
meeting of American Evaluation Associa -tion, Baltimore, MD.
36. United States Government Accountability Office. (2005). Report to the Chairman, Committee on Rules, House of Represen
-tatives. Higher education: Federal science,
technology, engineering, and mathematics
programs and related trends. (GAO Publi
-cation number GAO-06-114). Washington, DC: Government Printing Office.
37. Wright, A. S., Wu, X., Frye, C. A., Mathur, A. B., Patrick, C. W. (2007) A ten-year assessment of a biomedical engineer
-ing summer research internship within a comprehensive cancer center. Journal of STEM Education, 8(3), 28-39.
Acknowledgements
This research was funded as part of an Na
-tional Institutes of Health research grant (MORE R.E.S.U.L.T.S. -Research and Evalu
-ation of Students Using Long-Term Studies), #5R01GM071982-04 and funded in part by
the San Francisco State University MARC
T34-GM08574, MBRS-RISE R25-GM059298, and Bridge R25-GM48972 training grants. We would to thank the following individuals for their assistance in the data collection efforts: Laura Flenoury & Lisa Bautista (California State Uni
-versity, Los Angeles), and Lynn Anderson (San Francisco State University). We would also like to thank the MORE Program Directors’, Carlos Gutierrez (California State University, Los An -geles) and Frank Bayliss (San Francisco State
University) for sharing extensive student partici
-pant data and for making this project possible
through their counsel and cooperation, every
step of the way.
Correspondence should be addressed to
Simeon P. Slovacek, Applied & Advanced
Stud-ies in Education, California State University, Los Angeles, 5151 State University Drive, Los Angeles, California 90032. sslovac@calstatela.
Jonathan Whittinghill
is employed as a research associate in the Program Evaluation andResearch Collaborative at CSU Los Angeles. He received his Masters in Education with a focus in evaluation and research from CSU Los Angeles in 2008; his chief research interests are assessment research, English language learners, and school accountability. He has conducted research on the advancement of underrepresented minorities in science degree programs and the reform of algebra
instruction in public high schools. He has worked as an external evaluator on grants funded the Na
-tional Institutes of Health, the Na-tional Science Foundation, and the US Department of Education.
Dr. Glenn D. Kuehn
is a Regents Professor of Biochemistry in the Department of Chemistry and Biochemistry at New Mexico State University, Las Cruces, where he has been a faculty member since 1970. He has authored 92 publication on topics related to his research interests in oxidative stress and polyamine metabolism. He has served as principal investigator for many grant-funded projectsover the past 35 years, which have sought to enhance the advancement of ethnic minorities into re
-search careers in the biomedical sciences. He has mentored 13 minority PhD recipients of Hispanic, African-American, and Native American heritages.
Alan Peterfreund
is Executive Director of SageFox Consulting Group, a research, evaluation and custom software solution firm located in Amherst Massachusetts. Alan has a Ph.D. in Geology from Arizona State University, and has been a research faculty member at Brown University. Alan supports higher education partners in projects that address broadening participation in the sciences, graduatestudent development, curriculum innovation, instructional technology, teacher professional develop
-ment and other education reforms.
Kenneth Rath
has been professionally involved in educational evaluation and research since1999 and has been an employee of Peterfreund Associates, the former incarnation of SageFox Con
-sulting Group, since 2003. He received his PhD in Educational Psychology from the University of Massachusetts Amherst in 2002. Since beginning in the field of educational evaluation, Ken has been involved in over 50 projects, ranging from broad programs dedicated to helping underrepresented minority students succeed in the sciences to specific interventions designed to improve learning of
particular topics.
Simeon P. Slovacek
, Ph.D., is a faculty member in the Charter College of Education at Cali-fornia State University, Los Angeles. Prior to joining CSULA, he earned his Master’s and Doctorate degrees in the field of educational research and evaluation methodology at Cornell University. As Principal Evaluator of the Program Evaluation & Research Collaborative (PERC) office at Cal State LA, Dr. Slovacek has conducted numerous evaluations and research grants/contracts over the years. He currently serves as Principal Investigator on an R01 grant from the National Institutes of Health. Dr. Slovacek also serves as a founding board of trustee member for 3 non-profit organizations.
Dr. Susan Tucker
, President of Evaluation & Development Associates LLC, has been conductingimprovement-oriented program evaluations since 1975. This evaluation consulting ranges from uni
-versities, medical schools, school districts, state departments of education, federal programs, foun
-dations, and the private sector. She has been a teacher, principal and associate superintendent of schools as well as professor with teaching responsibilities in the areas of needs assessment, program
evaluation, learning theory, tests & measurements, and qualitative research. She concentrates on
evaluating partnership projects such as USDE’s Teacher Quality partnership programs, NSF Math Science Partnerships, and instructional technology projects.