http://jom.sagepub.com/
Journal of Management
http://jom.sagepub.com/content/early/2012/03/06/0149206311429378
The online version of this article can be found at: DOI: 10.1177/0149206311429378
published online 5 January 2012
Journal of Management
Marc van Essen, Jordan Otten and Edward J. Carberry
Understanding the Determinants of CEO Compensation
Assessing Managerial Power Theory: A Meta-Analytic Approach to
Published by:
http://www.sagepublications.com
On behalf of:
Southern Management Association
can be found at: Journal of Management
Additional services and information for
http://jom.sagepub.com/cgi/alerts Email Alerts: http://jom.sagepub.com/subscriptions Subscriptions: http://www.sagepub.com/journalsReprints.nav Reprints: http://www.sagepub.com/journalsPermissions.nav Permissions: What is This? - Jan 5, 2012
OnlineFirst Version of Record
- Mar 13, 2012
OnlineFirst Version of Record
Assessing Managerial Power Theory:
A Meta-Analytic Approach to Understanding the
Determinants of CEO Compensation
Marc van Essen
Utrecht UniversityJordan Otten
Edward J. Carberry
Erasmus University
Although studies about the determinants of CEO compensation are ubiquitous, the balance of evidence for one of the more controversial theoretical approaches, managerial power theory, remains inconclusive. The authors provide a meta-analysis of 219 U.S.-based studies, focusing on the relationships between indicators of managerial power and levels of CEO compensation and CEO pay-performance sensitivities. The results indicate that managerial power theory is well equipped for predicting core compensation variables such as total cash and total compensation but less so for predicting the sensitivity of pay to performance. In most situations where CEOs are expected to have power over the pay setting process, they receive significantly higher levels of total cash and total compensation. In contrast, where boards are expected to have more power, CEOs receive lower total cash and total compensation. In addition, powerful directors also appear to be able to establish tighter links between CEO compensation and firm performance and can accomplish this even in the face of powerful CEOs. The authors discuss the implications for theory and research regarding the determinants of executive compensation.
Keywords: executive compensation; managerial power theory; agency theory; corporate governance; meta-analysis
1 Acknowledgments: We would like to thank the editor Yasemin Kor, two anonymous reviewers, Tammo Bijmolt, Chris Doucouliagos, Peter Jan Engelen, Inge Geyskens, Pursey Heugens, Michel Lander, Hans van Oosterhout, Taco Reus, Pushpika Vishwanathan, and David Wilson for their helpful comments and suggestions and Anna Doubrovskaia for her research assistance.
Corresponding author: Jordan Otten, Rotterdam School of Management, Erasmus University, Room T7-17, Burgemeester Oudlaan 50, 3062 PA Rotterdam, Netherlands
E-mail: [email protected]
Vol. XX No. X, Month XXXX xx-xx DOI: 10.1177/0149206311429378 © The Author(s) 2012 Reprints and permission: http://www. sagepub.com/journalsPermissions.nav
Although research on CEO compensation continues to proliferate (Barkema & Gomez-Mejia, 1998; Devers, Cannella, Reilly, & Yoder, 2007; Finkelstein & Hambrick, 1988, 1989; Mejia & Wiseman, 1997; Murphy, 1999; Tosi, Werner, Katz, & Gomez-Mejia, 2000), there remains a lack of interdisciplinary consensus regarding the primary forces shaping observable patterns of executive compensation. The lack of consensus is most visible between scholars in economics and finance who advocate for the primacy of market-based explanations (e.g., Jensen & Meckling, 1976; Murphy, 2002; Murphy & Zábojník, 2004) and scholars outside of these two disciplines who have challenged these explanations and some of their underlying assumptions by highlighting the importance of power (Bebchuk & Fried, 2004), social-psychological processes (O’Reilly & Main, 2010), and the institutional environment (Diprete, Eirich, & Pittinsky, 2010) in the creation of compensation practices. This division has generated much productive discussion, although it is but the latest manifestation of long-running debates between neoclassical and managerialist traditions examining executive compensation (Finkelstein, Hambrick, & Cannella, 2009).
The most prominent recent challenger to purely market-based explanations is managerial power theory (MPT) advanced by Bebchuk and Fried (Bebchuk & Fried, 2004; Bebchuk, Fried, & Walker, 2002). At the core of this framework is a direct challenge to the common assumption within agency theory of optimal contracting, that is, that boards engage in arm’s-length transactions with executives over compensation arrangements and that such transactions help mitigate agency problems by creating compensation practices that more closely align the interests of executives and shareholders. In contrast, Bebchuk and Fried (2004) argue that boards rarely engage in arm’s-length transactions because CEOs often have power over board members because of specific structural and social-psychological mechanisms that have an important influence over board-level decision-making processes about executive compensation. These mechanisms create few incentives for directors to challenge compensation arrangements that are more in the interest of executives than shareholders, that is, higher levels of compensation and compensation that is less sensitive to performance. The goal of MPT, however, is not to refute agency theory but to deepen it by arguing that managerial power and its influence on executive compensation cast doubt on the assumption of optimal contracting. According to MPT, managerial power over pay-setting processes results in executive compensation practices that often function not as solutions to agency problems within large publicly listed firms, as agency theorists have argued, but that are in fact manifestations of these problems.
Some scholars in finance and economics have, in turn, critiqued MPT, drawing on various types of evidence. First, these critiques have pointed to the simultaneous increase in CEO pay and independence of boards of directors during the 1990s as inconsistent with MPT. If boards were becoming more independent, these critics argue, MPT would predict that CEOs would have actually been less able to influence the pay-setting process and thus less able to realize increasing levels of pay (Conyon, 2006; Hall & Murphy, 2003; Murphy, 2002; Murphy & Zábojník, 2004). Second, critics of MPT have argued that the increase in both the hiring rate and pay levels of externally hired CEOs relative to internal candidates goes against MPT’s claim that incumbent CEOs have more power than externally hired CEOs (Hall & Murphy, 2003; Murphy, 2002; Murphy & Zábojník, 2004). Third, challengers to MPT have argued that the low incidence of indexed stock options can be attributed more to
their accounting treatment (at least before 2004) than to managers being able to use their power to negotiate for less risky and more accounting-friendly “plain vanilla” stock options (Conyon, 2006). Fourth and finally, recent critiques of MPT have pointed to other trends in executive compensation, such as aggregate-level associations between corporate performance and compensation as well as the shortening of CEO tenures over time, as evidence against MPT (Kaplan, 2008). Critics of MPT have used this evidence to claim that MPT is not supported by the empirical evidence (Murphy, 2002).
In assessing these critiques, it is clear that they raise important questions about the extent and influence of managerial power. However, they do not provide sufficient evidence to make definitive claims about the validity of MPT. Although Bebchuk and Fried (2004) have raised counterarguments to some of these critiques directly, a more fundamental point is that most of these challenges have not been based on direct tests of the relationship between indicators of managerial power and compensation outcomes at the firm level (although for important exceptions, see Conyon, 2006; Conyon & He, 2004). Instead, these critiques have tended to focus on aggregate-level trends relating to board independence, compensation, firm performance, and CEO turnover. We contend, however, that the two core questions for testing the validity of MPT should be the following: (a) Do CEOs who have more power over their boards have higher compensation levels than CEOs with less power? and (b) Do CEOs who have more power over directors have compensation that is less sensitive to firm performance than that of CEOs with less power? Analyzing aggregate-level trends is suggestive but does not provide sufficient evidence to rigorously evaluate these two questions.
Fortunately, a large and diverse number of studies have examined these relationships empirically at the firm level. The literature, however, remains inconclusive and is characterized by divergent and conflicting findings that have allowed both proponents and opponents of MPT to put forward evidence to support different claims (O’Reilly & Main, 2010). For example, several studies find that CEO duality, a manifestation of CEO power, is related to higher pay (e.g., Yermack, 1996), whereas other studies find no such relationship between CEO duality and pay at all (e.g., Boyd, 1994). Therefore, what is needed at this stage is a more rigorous assessment of the existing literature, one that consolidates the mixed empirical findings and assesses the general explanatory validity of MPT regarding levels of compensation and the sensitivity of compensation to firm performance.
In this article, we offer both a consolidation and an assessment of this literature with the help of meta-analytic methods. Meta-analyses have become increasingly common in management research (Carney, Gedajlovic, Heugens, van Essen, & van Oosterhout, 2011; Dalton, Daily, Ellstrand, & Johnson, 1998; Deutsch, 2005; Heugens & Lander, 2009; Tosi et al., 2000) as a useful and robust way to analyze relationships between variables that have been examined in a large number of studies. Despite scores of empirical studies examining managerial power, the evidence and results remain subject to much ambiguity and controversy. In situations where there are large numbers of studies with mixed and conflicting findings, meta-analytic techniques can play an important role in providing a comprehensive and rigorous assessment of the balance of evidence with data that are closer to definitive than those reported in any single primary study (C. C. Miller & Cardinal, 1994).
We use these techniques to assess the accumulated evidence of 219 studies that measure the influence of managerial power directly on both CEO compensation levels and the relationship between corporate performance and CEO pay. Since the vast majority of studies have focused on the United States, we limit our sample to this context. Although testing managerial power was not necessarily the primary focus of every study in our data set, all of them have examined relationships between specific variables that allow us to test MPT using meta-analytical techniques. In addition to providing a meta-analytic assessment of MPT, we update Tosi et al. (2000), the first meta-analysis of the executive compensation literature, which provided a key assessment of the effects of firm size and performance on CEO pay. Their study, however, focused on these two determinants of executive pay separately and did not examine the influence of corporate governance variables, such as board and firm ownership structures, that are indicators of the power of different actors over the pay-setting process. We specifically investigate the possible moderating effects of these variables on performance–pay relationships, which Tosi et al. (2000) indicated as missing components of their analysis. Furthermore, Tosi et al.’s (2000) study was conducted over a decade ago and included 42 studies. Our analysis includes 219.
In addition, this article extends the application of meta-analytical methodology for management and organizational research in three ways (Combs, Ketchen, Crook, & Roth, 2011). First, our study is among the first in management research to use partial correlations as effect sizes (Carney et al., 2011). Using partial correlations allows us to incorporate studies from disciplinary domains such as finance and economics in which bivariate effect size information is not commonly reported and to control for the direction of causality between firm performance and CEO compensation (Sánchez-Ballesta & García-Meca, 2007). Moreover, we run bivariate and partial Hedges and Olkin–type meta-analyses (HOMA; Hedges & Olkin, 1985) to assess the balance of evidence regarding the antecedent variables and different CEO pay components. A second extension is that we employ meta-analytic regression analyses (MARA; Lipsey & Wilson, 2001) to model the moderating effects of a broad range of managerial power and control variables on the focal relationship between performance and pay (Doucouliagos & Ulubaşoğlu, 2008). Finally, we make use of meta-analytic structural equation modeling (MASEM; Cheung & Chan, 2005) to test the direct effect of all indicators of power on the level of CEO compensation.
Ultimately, the primary goal of this article is to help advance the debate about MPT by using the methodological power of meta-analytical techniques to assess the accumulated evidence to date. Our goal is not to argue that finance and economics scholars have been wrong in their critiques of MPT but that their evidence does not go far enough in its assessment of MPT. We believe that testing MPT requires more rigorous analysis and that meta-analytic techniques provide a powerful set of tools that have yet to be used to assess MPT. Ultimately, such an assessment will help us assess whether and how MPT expands agency theory explanations of the antecedents of executive compensation.
Manifestations of Managerial Power
Bebchuk and Fried (2004) argue that when CEOs have more power over the board of directors, they will be better positioned to negotiate for compensation arrangements that
serve their own interests, that is, they will be better able to negotiate for higher pay and pay that is less sensitive to their firm’s performance. This fundamental claim of MPT rests on a challenge to the common optimal contracting assumption within agency theory, which posits that managers and boards negotiate in arm’s-length transactions over compensation, with directors acting as selfless agents of shareholders and negotiating for compensation arrangements that serve the interests of shareholders rather than executives. However, if we assume interested behavior by executives, it is also logical to assume possible self-interested behavior by directors, such that delegating decision-making responsibilities to boards of directors may also lead to agency problems between shareholders and the board.
Bebchuk and Fried (2004) highlight a number of reasons why directors might not have the incentives to negotiate in the interests of shareholders and, in fact, may have incentives to go along with compensation arrangements that favor executives. First, since directors’ positions confer status, connections, and compensation, most directors will want to keep their positions and be reelected, and CEOs will exert a powerful influence over director selection (also see Main, O’Reilly, & Wade, 1995). Second, social and psychological mechanisms that have been found to be common within small groups, such as friendship, loyalty, and collegiality, are also common to boards and make directors less likely to challenge CEOs (O’Reilly & Main, 2010). Third, CEOs are in positions to reward directors directly through higher compensation, new business, and charitable contributions. These incentives make it likely that executives who wield power over board members will be better positioned to negotiate for compensation arrangements that are in their favor.
The recognition of such incentives challenges the assumption of arm’s-length transactions that represent the core insights of MPT. However, as Bebchuk and Fried (2004) and others (Finkelstein et al., 2009) have pointed out, MPT is in line with a long history of work stretching back to Berle and Means (1932) that has attended to the role of social and political forces in shaping executive compensation. Like earlier work, MPT has proven to be provocative and has generated a number of critics (e.g., Conyon, 2006; Kaplan, 2008; Murphy, 2002; Murphy & Zábojník, 2004). Although most of these critiques, as noted above, have not tested MPT directly by examining the firm-level relationships between managerial power compensation and performance, MPT provides a simple prediction that is empirically testable: If executives have more power over the board, they will have more power to influence the design of their compensation arrangements. Since executives prefer more compensation and less risky arrangements (Baker, Jensen, & Murphy, 1988), when they have power over the board we would expect executives to receive higher pay and pay that is less sensitive to performance (Bebchuk & Fried, 2004). In addition, since social psychologists and sociologists have long viewed power as a relationship (Blau, 1964; Emerson, 1962; Pfeffer & Salancik, 1978), MPT also leads to the opposite prediction: When boards have more power over CEOs, CEOs will have lower compensation and pay that is more sensitive to corporate performance.
Hence, the core prediction of MPT can be tested directly in two ways: by examining the power that a CEO has over the board and by examining the power that boards have over CEOs. If our analysis finds higher levels of pay and pay that is less sensitive to performance when executives have more power, and the opposite when directors have more power, this will provide empirical evidence in favor of MPT. To test these predictions, scholars have
relied on a number of different indicators of CEO and board power (Finkelstein et al., 2009), each of which has been linked to specific theoretical mechanisms. In this section, we hypothesize the primary ways in which managerial and board power manifests itself and can influence the level of executive compensation and its relationship with firm performance. We focus on the two sets of mechanisms on which researchers have focused most frequently when analyzing managerial power: board structures (Dalton et al., 1998; van Essen, van Oosterhout, & Carney, in press) and ownership characteristics (Dalton, Daily, Certo, & Roengpitya, 2003; Hambrick & Finkelstein, 1995). We hypothesize that the effect that each mechanism will have on the ability of managers to receive both higher pay levels and pay that is less sensitive to firm performance.
Board Characteristics
Structural features of boards of directors can constrain or enable managerial power in the pay-setting process. The common agency theory assumption of optimal contracting sees boards as representatives of shareholders and therefore able and willing to monitor and constrain managerial power (e.g., Conyon & Peck, 1998; Finkelstein, 1992; Yermack, 1996). Managerial power theorists, however, have challenged this assumption that boards of directors engage in arm’s-length transactions in which they will act as selfless agents of shareholders (Bebchuk & Fried, 2004). A more nuanced view would be that under certain conditions boards will be more or less influenced by executives and hence more or less able to constrain executive power in the compensation-setting process. We focus on four firm-level characteristics that allow us to predict when directors will be more or less influenced by CEOs and consequently be less or more able to constrain managerial power: CEO duality, CEO tenure, size of the board, and the percentage of independent directors.
A key structural governance feature is CEO duality, in which an individual has the roles of both CEO and board chairman. MPT predicts that the concentration of decision-making power in one individual leads to more power, for several possible reasons (Finkelstein & D’Aveni, 1994). First, since the CEO–chairman is responsible for organizing board meetings and setting the agendas of these meetings, the CEO–chairman is able to control the information provided to the board of directors (Bebchuk & Fried, 2004; Pearce & Zahra, 1991). Second, CEO duality increases the CEO’s influence over the nomination process of new directors (Westphal & Zajac, 1995). Third, the dual role of CEO and chairman can be considered as the highest rank in the corporate hierarchy. This figurehead status, with more mandate and power, can lead to more influence over the pay setting process (Ungson & Steers, 1984). We therefore hypothesize,
Hypothesis 1a: CEO duality is positively associated with the value of total CEO compensation. Hypothesis 1b: In the presence of CEO duality, the association between corporate performance and
CEO compensation will be weaker.
The length of a CEO’s tenure is also likely to be an important determinant of managerial power. Longer tenured CEOs can be expected to have more influence over board members and their decisions because they have more status and more experience with the company
and its board (Bebchuk & Fried, 2003, 2006). The collaboration among board members and bonds of collegiality intensify over time, and CEOs with longer tenure have more time to influence this process (Bebchuk & Fried, 2004; Macey, 2008). CEOs with longer tenure can also be more influential over the remuneration committee directly. Evidence pointing in this direction shows that remuneration committees whose chairs have been installed later than the CEO tend to pay more (Main et al., 1995). Furthermore, other research has found that the relationship between firm performance and CEO pay weakens as tenure increases (Hill & Phan, 1991). CEOs with longer tenure are therefore expected to have more power, and therefore we hypothesize,
Hypothesis 2a: CEO tenure is positively associated with the value of total CEO compensation. Hypothesis 2b: In the presence of CEOs with longer tenure, the association between corporate
performance and CEO compensation will be weaker.
The size of the board in terms of the number of directors is also likely to enable or constrain managerial power. Although monitoring requires capacity, large boards can be ineffective at constraining managerial power because larger boards require more time and effort to build consensus and generate the social cohesion of smaller boards (Zahra & Pearce, 1989). In addition, larger boards can become ineffective because of internal coordination and communication problems (Bebchuk & Fried, 2004). Therefore, the in-group monitoring and collective action problems of larger boards may provide executives with more power over the pay-setting process (Eisenberg, Sundgren, & Wells, 1998; O’Reilly & Main, 2010; Pfeffer, 1972; Yermack, 1996). We therefore hypothesize,
Hypothesis 3a: Board size is positively associated with the value of total CEO compensation. Hypothesis 3b: In the presence of larger boards, the association between corporate performance and
CEO compensation will be weaker.
Finally, the composition of the board in terms of the percentage of independent directors may also influence managerial power. Directors are considered independent if they are not currently or have never been employees of the company and have no other relationship with the firm, such as business contracts (Bebchuk & Fried, 2004). Agency theorists have argued that boards should be composed of independent directors (Zahra & Pearce, 1989) who are less sensitive to the influence of corporate insiders and free of conflicts of interest (Dalton et al., 1998). In turn, this provides them with an incentive to protect their own reputations as expert independent decision makers and focus on improving corporate performance (Fama & Jensen, 1983). However, MPT has highlighted a number of ways that independent directors can actually lose independence and become vulnerable to managerial influence, such as the role of CEOs in director selection, the close connections and bonds of shared interests and collegiality among board members, and the dependence of independent directors on managers for information (Bebchuk & Fried, 2004). Moreover, the collaboration among independent board members and managers may intensify over time (Bebchuk & Fried, 2004; Macey, 2008). In such situations, independent directors can become less willing to challenge executive compensation arrangements. Nevertheless, we expect independent directors in general to be better able to constrain executive power as opposed to directors
who have been executives of the firms themselves or have some other relationship with the firm. We therefore hypothesize,
Hypothesis 4a: The percentage of independent directors is negatively associated with the value of total CEO compensation.
Hypothesis 4b: At higher levels of board independence, the relationship between corporate performance and CEO compensation will be stronger.
Ownership Characteristics
Both MPT and agency theory argue that the ownership structure of the corporation can enable or constrain the power of CEOs (Tosi et al., 2000). For example, large, concentrated owners often have both the means and incentives to monitor management effectively (Bebchuk & Fried, 2004; Shleifer & Vishny, 1986, 1997). More specifically, since these owners have large investment stakes, they are more dependent on the performance of the firm. In addition, large owners are more able to protect their interests by means of both formal influence, such as the nomination of and voting for directors, and informal communication with management (Smith, 1996). In contrast, for dispersed shareholders, who own only a small percentage of a firm, the costs of close monitoring may be too high relative to the possible gains produced by such monitoring. Instead of trying to steer managerial decisions directly, these shareholders are more inclined to “vote with their feet” and sell their shares if they disagree with executives or when the firm’s performance falls below expectations (Heugens, van Essen, & van Oosterhout, 2009; Hirschman, 1970). Moreover, dispersed shareholders are likely to have dispersed strategies and goals for increasing firm value, leaving management with more influence to make their own calls (Thomsen & Pedersen, 2000). Earlier studies have also shown that the level of executive compensation is negatively associated with block holders who have holdings of 5% or more (e.g., Core, Holthausen, & Larcker, 1999; Khan, Dharwadkar, & Brandes, 2005; Lambert, Larcker, & Weigelt, 1993; Mehran, 1995). The association between performance and pay (i.e., performance–pay sensitivity) is also more likely to be stronger at higher levels of concentrated ownership as these owners are expected to monitor management more closely and ensure executives make value-enhancing decisions (Bebchuk & Fried, 2004; Shleifer & Vishny, 1986, 1997). We therefore expect that corporations with more concentrated ownership structures will be better able to constrain managerial power and hypothesize,
Hypothesis 5a: Higher levels of concentrated ownership is negatively associated with the value of total CEO compensation.
Hypothesis 5b: At higher levels of concentrated ownership, the association between corporate performance and CEO compensation will be stronger.
In addition to the concentration of ownership, the identity of a firm’s owners can also constrain or enable managerial power over executive compensation practices. For example, one of the most important governance changes in the past 20 years has been the dramatic increase in the holdings and number of institutional investors (Useem, 1996). Although their status as institutional investors does not give them more formal power than other investors,
they often have substantial holdings and fiduciary obligations to their investors to improve the returns to their clients. Therefore, institutional investors tend to more actively monitor management than individual investors and may be more able to constrain executive power in setting compensation (Bebchuk & Fried, 2004; David, Kochhar, & Levitas, 1998; Hartzell & Starks, 2003). We therefore predict that institutional investors will act more often as a constraint on, instead of an enabler of, managerial power and hypothesize,
Hypothesis 6a: Higher levels of institutional ownership is negatively associated with the value of total CEO compensation.
Hypothesis 6b: At higher levels of institutional ownership, the association between corporate performance and CEO compensation will be stronger.
Method and Data
Sample and Coding
To identify the population of studies on CEO compensation in the U.S. context, we used five complementary search strategies (Heugens et al., 2009). First, we consulted several review articles (Barkema & Gomez-Mejia, 1998; Devers et al., 2007; Gomez-Mejia & Wiseman, 1997; Murphy, 1999) and two published meta-analyses (Deutsch, 2005; Tosi et al., 2000). Second, we located additional articles using five electronic databases, (a) ABI/INFORM Global, (b) EconLit, (c) Google Scholar, (d) JSTOR, and (e) SSRN, and the following search terms: bonus, compensation, incentive, long-term incentive plan (LTIP), pay, remuneration,
salary, and stock option. Third, we conducted a manual search of 25 journals in the fields of accounting, economics, finance, and management. Fourth, after collecting an initial set of studies, we traced backward all references reported in the articles and traced forward all articles that cited the original articles using Google Scholar. Fifth, we corresponded with 82 researchers who had previously written one or several articles on the focal relationship in which effect size information was not reported or whose studies we could not retrieve, asking them for a correlation table and regression output. This strategy yielded a final sample of 219 primary studies, which consisted of 169 journal articles, 47 working papers, and 3 doctoral dissertations (see Appendix A).
In terms of samples used in the studies that we analyzed (see Table 1), about one third (32.42%) relied on an index from Standard and Poor’s (S&P). In our sample, 8.22% of the studies used the S&P 500, 10.96% used the S&P 1500, and 13.24% of the studies indicated that they used the S&P but did not specify which particular index. Another one quarter of the studies (26.94%) analyzed samples based on lists published in Forbes, Fortune, or Business Week. The Fortune 500 comprises the 500 largest firms traded on U.S. stock exchanges in terms of revenues, and although Forbes and BusinessWeek have published different lists over the past 20 years, they primarily include the largest publicly traded companies. Another one quarter (26.48%) of the studies did not specify their samples, whereas the remainder used a mix of samples (7.31%) or some other sample (6.85%). Hence, despite the accessibility of the ExecuComp database, which is based on the S&P 1500, only a little more than one third of the studies used it as their only sample. Nevertheless, a majority of the studies have been based on large, publicly traded companies.
Table 1
Data Sources, Industries, and Sample Periods of Primary Studies Category % Of Total Number Of Studies Index Used For Study Sample
S&P 32.42%
Forbes 11.87%
Fortune 10.96%
Business Week 4.11%
Other single index 6.85%
Mixed 7.31%
Not specified/ No specific index 26.48% Source Compensation Data
Execucomp 36.99 %
Proxy statements 30.14 %
Forbes 9.59 %
Business Week 2.74 %
Individual Survey 1.83 %
Other single data sources 2.28 %
Mixed Execucomp & proxy statements 5.48 % Mixed Forbes & proxy statements 0.91 %
Mixed Forbes & Execucomp 0.91 %
Mixed Forbes & Fortune 0.91 %
Mixed other combinations 6.85 %
Not specified 1.37 %
Industry
Airline 0.91%
Banking & Financial services 6.85 %
Computer software 0.46 %
Electric 0.46 %
Healthcare & Pharmaceuticals 2.28 %
Leisure 0.91 %
Oil & Gas 0.46 %
Real estate 1.83 %
Retail 0.46 %
Mixed (studies with at least 4 different industries) 85.39 % Number Of Years Covered In Study Sample
Years 1 2 3 4 5 6 7 8 9 10 11 12 13 14 15 >15 Articles 34 18 22 20 20 25 17 10 7 14 6 8 5 2 3 8
Number Of Samples Per Time Period ≤/ 1965 1966/ 1970 1971/ 1975 1976/ 1980 1981/ 1985 1986/ 1990 1991/ 1995 1996/ 2000 2001/ 2005 2006 / Samples started in period 4 4 6 15 20 33 87 35 14 1 Samples ended in period 1 1 3 4 12 33 40 64 58 3 Samples covering period 4 7 12 24 40 61 115 110 61 3
Table 1 also reports the frequency of the data sources used in the primary studies. More than one third of our sample (36.99%) collected data from ExecuComp, which itself collects data from publicly available proxy statements. Another 30% of the studies in our sample used proxy statements, and about 13% of our sample used data published by Forbes or
Business Week. Since these periodicals also draw on proxy statements, the vast majority of the studies in our sample relied on publicly available information about executive compensation available through proxy statements. Few researchers surveyed companies directly (1.83%). In terms of industries sampled, 85% of the studies in our sample analyze four or more industries. Finally, as can be seen in Table 1, the primary studies included in our analyses covered different, but sometimes overlapping, time periods, with most studies beginning between 1991 and 1995 and ending between 1996 and 2000.
After reading the articles, we developed a coding protocol (Lipsey & Wilson, 2001) for extracting data on relevant variables. Table 2 provides a description of the variables collected from the primary studies that are included in our meta-analyses. The coding protocol allowed us to differentiate between two types of firm financial performance, accounting performance and market performance, and among the most frequently used measures of CEO compensation, including salary, cash bonus, total cash (i.e., the sum of salary and cash bonus), LTIPs, and total compensation. LTIPs include long-term equity-based compensation (stock options, restricted stock units, and other long-term compensation) earned by the CEO during the year (e.g., Balkin, Markman, & Gomez-Mejia, 2000).
For testing Hypotheses 1a, 2a, 3a, 4a, 5a, and 6a, we collected effect size information for all the variables predicted to influence CEO total compensation and the interrelationships among all dependent, independent, and control variables used in our analyses. More specifically, we collected Pearson product–moment correlations coefficients (r)and sample sizes among all the variables. To test Hypotheses 1b, 2b, 3b, 4b, 5b, and 6b, we used partial correlation coefficients (rxy.z) between firm performance and CEO total compensation. We
computed these from the multivariate t statistics and degrees of freedom of the sampled regression analyses. To test our hypotheses, we also collected information about the study characteristics, methodological artifacts, and whether a particular variable was included in a study’s regression model. This allowed us to test the impact of these characteristics on the strength of the performance to pay relationship (Bahadir, Bharadwaj, & Parzan, in press; Doucouliagos & Ulubaşoğlu, 2008).
One author coded all effect sizes. To assess agreement in extracting information from primary studies, another author independently coded a subsample of 512 randomly selected effect sizes. We then computed the percentage agreement and a chance agreement-corrected measure of reliability (Cohen’s kappa coefficient; Cohen, 1960). The percentage agreement and kappa value we obtained were .93 and .90, respectively, signifying a very high degree of reliability.
MASEM Procedure
We used MASEM (Cheung & Chan, 2005) to test Hypotheses 1a, 2a, 3a, 4a, 5a, and 6a. The MASEM procedure combines the techniques of structural equation modeling with those of meta-analysis (Cheung & Chan, 2005). The technique is ideally suited to test these
(continued) Table 2
Description of Variables
Variable Description
CEO salary Measures the annual base salary earned by the CEO during the year (e.g., Khan, Dharwadkar, & Brandes, 2005)
CEO cash bonus Measures the annual cash bonus earned by the CEO during the year (e.g., Gray & Cannella, 1997)
CEO total cash Measures the annual total cash earned by the CEO during the year, defined as the sum of salary and cash bonus (e.g., Nourayi & Mintz, 2008)
CEO long-term incentive plan (LTIP)
Measures long-term equity-based compensation (stock options, restricted stock, and other long-term compensation) earned by the CEO during the year (e.g., Balkin, Markman, & Gomez-Mejia, 2000)
CEO total pay Measures the total annual compensation of the CEO; CEO total pay is the sum of total salary, cash bonus, and long-term compensation (grants of restricted stock, stock options, stock appreciation rights, and performance plans) in a year (e.g., David, Kochhar, & Levitas, 1998)
Firm performance Any indicator of the financial performance of the firm, including both accounting-based measures and market-accounting-based measures of firm value
Accounting performance Any indicator of the financial performance of the firm that is expressed in the form of an accounting-based measure of firm profits (return on assets, return on equity, earnings per share, and profit margin [PM])
Market performance Any indicator of the financial performance of the firm that is expressed in the form of a market-based measure of firm value (stock returns, market to book [MB], Tobin’s Q)
CEO duality Measures whether the CEO is also the chairman of the board of directors (e.g., Grossman & Cannella, 2006)
CEO tenure CEO tenure is operationalized as the number of years the executive has been CEO (e.g., Finkelstein & Hambrick, 1989)
Board size Measures total numbers of directors who serve on the board (e.g., Staw & Epstein, 2000)
Board independence A variable that reflects the degree to which the board of directors operates independently from corporate insiders, commonly measured as the ratio of outside board members to the total number of board members (e.g., Berrone & Gomez-Mejia, 2009)
Ownership concentration Measures the extent to which the firm’s outstanding stock is in the hands of large block holders and reflects the percentage of the firm’s ownership held by those who own at least 5% of the firm’s outstanding shares (e.g., Grossman & Cannella, 2006) Institutional ownership This variable represents the equity position held by all institutional investors and
assumes a positive value (either 1 in the case of dummy operationalizations or a percentage in case the degree of institutional owners is known) when the owner is an institutional investor (e.g., public or company pension funds, mutual funds, insurance services; e.g., David et al., 1998)
Firm size An indicator of the size of the firm, commonly measured as a firm’s total assets, sales, or employees (e.g., Finkelstein & Hambrick, 1989)
Firm debt A variable that reflects the degree of leverage of the firm, commonly measured as ratio of total debts to total assets (e.g., Grossman & Cannella, 2006)
Firm diversification A variable that reflects the degree to which firms are simultaneously active in many different businesses (entropy index, Herfindahl index, or number of segments; e.g., Carpenter, Sanders, & Gregersen, 2001)
Firm risk A variable that reflects the degree to which the financial valuation of a firm’s stock varies in relation to movements of the broader market; a commonly used measure of such risk is the beta of a firm’s stock, computed by regressing a firm’s monthly stock return on the corresponding country’s market index return (e.g., J. S. Miller, Wiseman, & Gomez-Mejia, 2002)
Variable Description
Firm R&D A variable that reflects the degree of R&D expenditures of the firm, commonly measured as the ratio of research and development expenditure to total sales (e.g., Carpenter et al., 2001)
CEO age Measured as the number of years (e.g., Attaway, 2000)
Inside ownership Measures the extent to which a firm’s outstanding stock is in the hands of directors and officers (e.g., Grossman & Cannella, 2006)
Table 2(continued)
hypotheses because it allows us to analyze the direct effect of our indicators of managerial and director power on CEO total compensation. We used MASEM to avoid biased estimates resulting from possible correlations among independent variables. This can be a problem if the standard HOMA approach (Hedges & Olkin, 1985) is used by itself. We conducted our structural equation modeling by using a two-stage procedure (Carney et al., 2011).
In the first stage, we used HOMA to compute the meta-analytic Pearson product–moment correlation (r) between independent and dependent variables as well as the corresponding confidence interval. This produced a meta-analytic correlation table. Since HOMA procedures assume that effect sizes are normally distributed, we used Fisher’s (1928) Zr transformation to correct for possible skewness in the effect size distribution (Hedges & Olkin, 1985).1 In
line with current conventions among meta-analytic researchers, we used random effects HOMA for combining study estimates (Geyskens, Krishnan, Steenkamp, & Cunha, 2009).2
To estimate the mean effect size appropriately, differences in precision across effect sizes had to be accounted for, so we weighted effect sizes by their inverse variance weight (w), that is, the inverse of their squared standard error (Hedges & Olkin, 1985).3 We also used
these weights to calculate the standard error of the mean effect size and its confidence interval.4
In the second stage, this meta-analytic correlation matrix was treated as the observed correlation matrix and subjected to regular maximum likelihood structural equation modeling routines to test the aforementioned hypotheses (Cheung & Chan, 2005). In this procedure, the harmonic mean number of observations from all studies was treated as the number of observations. In this way, correct and conservative t values for the model parameters were estimated (Geyskens, Steenkamp, & Kumar, 2006). The data were analyzed using the full information maximum likelihood method with the LISREL 8.80 software package.
MARA Procedure
We tested Hypotheses 1b, 2b, 3b, 4b, 5b, and 6b using MARA (Lipsey & Wilson, 2001). In our MARA analyses, the dependent variable is neither pay nor performance but an estimate of the associational strength of the focal relationship (i.e., the relationship between performance and pay) in a given sample. We use partial correlation coefficients (rxy.z) as our
effect size estimates for the MARA procedure, and in our case it captures the association between firm performance and CEO total compensation, given a set of n control variables.
It can be computed from the t statistics and degrees of freedom reported in primary studies (Greene, 2008).5 Similar to multiple regression approaches, MARA analyses construct a
linear regression model involving a set of predictors, which in this case are the potential moderators of the performance–pay relationship (i.e., managerial power variables and our control variables) on the dependent variable (i.e., the effect size). We weighted these effect sizes by their inverse variance weight to account for differences in the precision of the information contained in them (Aguinis, Gottfredson, & Wright, in press). In other words, the primary-level study effect sizes are regressed onto a set of predictors (i.e., moderators) of the performance–pay relationship (Carney et al., 2011; Doucouliagos & Ulubaşoğlu, 2008; Lipsey & Wilson, 2001; Stanley & Jarrell, 2005). Following current standards in the meta-analytic literature (Geyskens et al., 2009), we used random effects estimation methods in our MARA analyses, which are more conservative than conventional fixed effects methods. Specifically, this yielded the following regression equation,
Ri = y0 + ymDi + bmSi + jRI + ui
where Ri is the partial correlation between firm performance and CEO total compensation,
y0 is the constant term, D is a vector of whether a particular variable is included in a
regression or not, Sis a vector of measurement artifacts, R is a vector of study characteristics, and ui is the random component.
To test the moderating effects of the indicators of CEO and board power on the performance–pay relationship, we included in the D vector a set of dummy variables indicating whether the following variables were included in the regression (0) or not (1): CEO duality, CEO tenure, board size, board independence, ownership concentration, and institutional ownership. We also included dummy variables indicating whether the following control variables were included in the regression (0) or not (1): firm size, firm risk, firm diversification, firm R&D level, firm debt level, CEO age, and inside ownership.
To control for the influence of measurement artifacts on effect sizes, we included in the S vector several control variables. More specifically, to test for the moderating effect of focal variable operationalizations, we added dummy variables indicating whether firm performance was measured as accounting (1) or as market (0) performance and whether the effect size was derived from a study investigating changes in performance and changes in compensation (1) or was derived from a study investigating absolute levels of performance and compensation (0). To test for the moderating effect of methodological artifacts, we included a dummy variable indicating whether a given effect size was based on panel (1) or cross-sectional (0) data. We also included a dummy variable coded as (1) when an effect size was derived from a study controlling for the possible endogeneity of firm performance on executive compensation and as (0) otherwise.6 In addition, we controlled for the number of variables in
the regression and whether a study controlled for year and industry effects. To control for the influence of study artifacts, we included in the R vector three other control variables. To test for the “file drawer problem” (Rosenthal, 1979), we included a dummy variable denoting whether a study was published (1) or not (0). To control for the possibility that the focal relationship weakened or strengthened over time (Gregg, Machin, & Szymanski, 1993), we
added the median year of the sample window. Finally, we included each publication’s 5-year ISI impact factor to control for publication outlet status effects (Carney et al., 2011).
Results
CEO Total Compensation
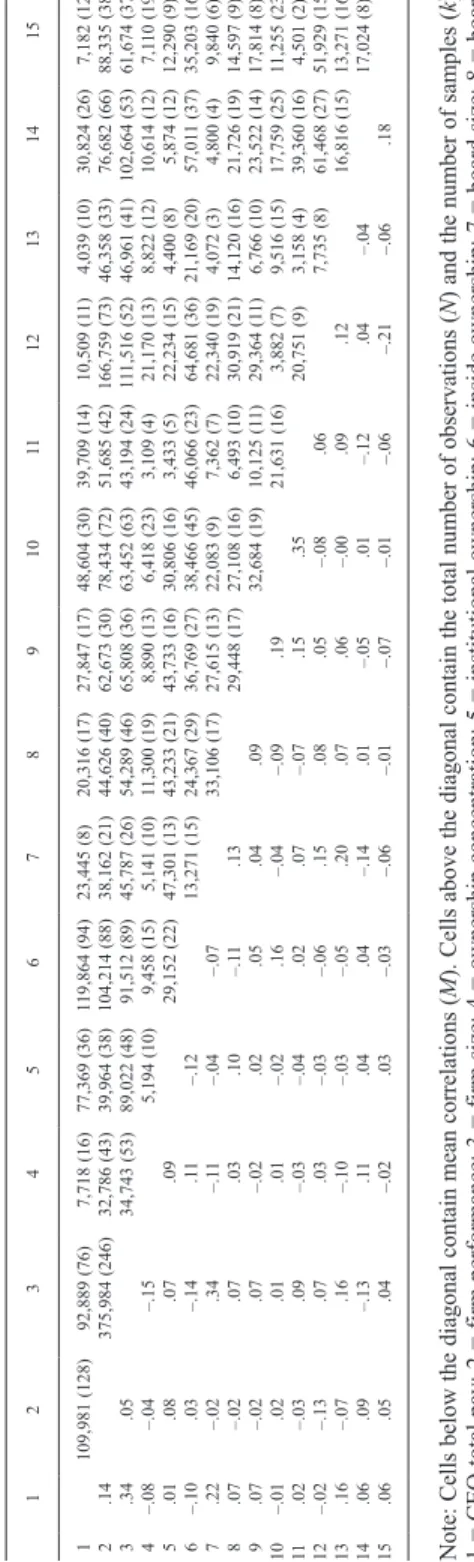
Tables 3 and 4 report the results pertaining to Hypotheses 1a, 2a, 3a, 4a, 5a, and 6a. Table 3 depicts the meta-analytic correlation matrix. The cells below the diagonal represent 105 separate HOMA meta-analyses and report the meta-analytic mean correlation for each relationship, which we use to run the MASEM analyses. Above-diagonal cells report the number of observations (N) and the number of samples (k) on which the meta-analytic mean is based. Table 4 contains MASEM results. The model fits the data well (c2 = 1,205.77,
root mean square error of approximation [RMSEA] = .09, root mean square residual [RMSR] = .03).
Hypothesis 1a, which predicts that CEO duality is positively related to the level of total CEO compensation, is confirmed by the results in Table 4. We find that CEO duality is positively related to CEO total pay (b= .02, p< .05). We find no support for Hypothesis 2a that CEO tenure is positively related to CEO compensation levels (b= –.00, p> .05). We find clear support for Hypothesis 3a, as the size of boards is associated with higher levels of total pay (b= .12, p< .01). In fact, after firm size, board size has the largest impact on total pay. In contrast to the prediction of Hypothesis 4a, the degree of board independence is positively related to total pay levels (b= .06, p< .01). Our findings also provide support for Hypothesis 5a: As hypothesized, concentrated ownership is negatively related to the level of total CEO compensation (b= –.04, p< .01). Finally, we find support for Hypothesis 6a that the presence of higher levels of institutional ownership is associated with lower levels of total pay (b= –.03, p< .01).
Table 4 also reports the results for the control variables. We find that firm performance (b= .12, p< .01), firm size (b= .28, p< .01), firm diversification (b= .02, p< .05), firm risk (b= .11, p< .01), and firm R&D level (b= .03, p< .01) are all positively related to total CEO compensation. However, firm debt level (b= –.10, p< .01), CEO age (b= –.06, p<
.01), and inside ownership (b= –.02, p< .05) are all negatively related to total pay levels. The results confirm previous research that firm size is the most important antecedent variable to explain CEO total compensation (Tosi et al., 2000).
In Appendices B, C, and D we report the HOMA results of the levels of both total CEO compensation and a breakdown of the levels of other pay components of CEO compensation (i.e., salary, cash bonus, total cash, and LTIPs) in relationship to board and CEO characteristics (Appendix B), ownership concentration and institutional ownership (Appendix C), and firm performance (Appendix D). We present the HOMA results in two panels. Panel 1 contains a set of r-based HOMA results (Pearson product–moment correlations), and Panel 2 contains the corresponding rxy.z-based HOMA findings (partial correlations). In addition to the
16 T able 3 Meta-Analytic Corr elation Matrix 1 2 3 4 5 6 7 8 9 10 11 12 13 14 15 1 109,981 (128) 92,889 (76) 7,718 (16) 77,369 (36) 119,864 (94) 23,445 (8) 20,316 (17) 27,847 (17) 48,604 (30) 39,709 (14) 10,509 (1 1) 4,039 (10) 30,824 (26) 7,182 (12) 2 .14 375,984 (246) 32,786 (43) 39,964 (38) 104,214 (88) 38,162 (21) 44,626 (40) 62,673 (30) 78,434 (72) 51,685 (42) 166,759 (73) 46,358 (33) 76,682 (66) 88,335 (38) 3 .34 .05 34,743 (53) 89,022 (48) 91,512 (89) 45,787 (26) 54,289 (46) 65,808 (36) 63,452 (63) 43,194 (24) 11 1,516 (52) 46,961 (41) 102,664 (53) 61,674 (37) 4 –.08 –.04 –.15 5,194 (10) 9,458 (15) 5,141 (10) 11,300 (19) 8,890 (13) 6,418 (23) 3,109 (4) 21,170 (13) 8,822 (12) 10,614 (12) 7,1 10 (19) 5 .01 .08 .07 .09 29,152 (22) 47,301 (13) 43,233 (21) 43,733 (16) 30,806 (16) 3,433 (5) 22,234 (15) 4,400 (8) 5,874 (12) 12,290 (9) 6 –.10 .03 –.14 .11 –.12 13,271 (15) 24,367 (29) 36,769 (27) 38,466 (45) 46,066 (23) 64,681 (36) 21,169 (20) 57,01 1 (37) 35,203 (16) 7 .22 –.02 .34 –.1 1 –.04 –.07 33,106 (17) 27,615 (13) 22,083 (9) 7,362 (7) 22,340 (19) 4,072 (3) 4,800 (4) 9,840 (6) 8 .07 –.02 .07 .03 .10 –.1 1 .13 29,448 (17) 27,108 (16) 6,493 (10) 30,919 (21) 14,120 (16) 21,726 (19) 14,597 (9) 9 .07 –.02 .07 –.02 .02 .05 .04 .09 32,684 (19) 10,125 (1 1) 29,364 (1 1) 6,766 (10) 23,522 (14) 17,814 (8) 10 –.01 .02 .01 .01 –.02 .16 –.04 –.09 .19 21,631 (16) 3,882 (7) 9,516 (15) 17,759 (25) 11,255 (23) 11 .02 –.03 .09 –.03 –.04 .02 .07 –.07 .15 .35 20,751 (9) 3,158 (4) 39,360 (16) 4,501 (2) 12 –.02 –.13 .07 .03 –.03 –.06 .15 .08 .05 –.08 .06 7,735 (8) 61,468 (27) 51,929 (15) 13 .16 –.07 .16 –.10 –.03 –.05 .20 .07 .06 –.00 .09 .12 16,816 (15) 13,271 (16) 14 .06 .09 –.13 .11 .04 .04 –.14 .01 –.05 .01 –.12 .04 –.04 17,024 (8) 15 .06 .05 .04 –.02 .03 –.03 –.06 –.01 –.07 –.01 –.06 –.21 –.06 .18
Note: Cells below the diagonal contain mean correlations (
M
). Cells above the diagonal contain the total number of observations (
N
) and the number of samples (
k
).
1 = CEO total pay; 2 = firm performance; 3 = firm size; 4 = ownership concentration; 5 = institutional ownership; 6 = inside ow
nership; 7 = board size; 8 = board
independence; 9 = CEO duality; 10 = CEO tenure; 1
Table 4
Meta-Analytic Structural Equation Modeling Results CEO Total Pay
Predictor b t CEO duality .02* 1.82 CEO tenure –.00 –0.29 Board size .12** 14.46 Board independence .06** 3.09 Ownership concentration –.04** –4.24 Institutional ownership –.03** –3.69 Firm performance .12** 15.68 Firm size .28** 33.76
Firm debt level –.10** –10.23
Firm diversification .02* 2.10
Firm risk .11** 13.97
Firm R&D level .03** 3.21
CEO age –.06** –7.88 Inside ownership –.02* –2.23 Harmonic mean N 14,349 c2 1,205.77 RMSEA .09 RMSR .03 *p < .05. **p < .01.
standard error of the mean effect size (SE), Cochran’s homogeneity test statistic (Q test),7
and the explained variance (EV). When a blank line appears in a table, it is because there were not enough effect sizes available to estimate the particular relationship. In addition to these results, we ran different robustness checks (not reported) on subsets of our data to investigate possible time and primary study sampling effects. These tests revealed similar results as the results reported here.8
Performance–Pay Sensitivity
Table 5 presents the MARA results, which relate to Hypotheses 1b, 2b, 3b, 4b, 5b, and 6b. In the MARA analyses, the dependent variable is neither pay nor performance but the partial correlation between firm performance and CEO total compensation. We report in Table 5 the effect of studies that fail to control for each specific indicator of CEO or board power relative to those studies that do control for a specific indicator. For example, some studies do not control for board independence in their regression analyses whereas others do. Therefore, if we report a positive and significant coefficient for a variable, this indicates that studies that did not include this variable reported a stronger relationship between firm performance and CEO total compensation than studies that did control for the variable. Hence, this variable has a positive moderation effect on the focal relationship. We also analyzed the effects of a number of control variables in the same way. Overall, the model fits the data reasonably well (R2 = .27).
The MARA results, as reported in Table 5, do not provide support for Hypothesis 1b. CEO duality has no significant moderating effect on the performance–pay relationship. We find support for Hypothesis 2b, which predicts that the presence of CEOs with longer tenure negatively moderates the performance–pay relationship. The results show that studies that fail to control for CEO tenure in their regression analyses find a weaker performance–pay relationship (Doucouliagos & Ulubaşoğlu, 2008). Hence, in the presence of CEOs with
Table 5
MARA Partial Correlation Coefficient Resultsa, b
Variable Model (1)
Managerial power indicators
CEO duality 0.00 (0.01) CEO tenure -0.04 (0.01)** Board size 0.06 (0.02)** Board independence 0.03 (0.01)** Ownership concentration 0.01 (0.01) Institutional ownership 0.03 (0.01)* Control variables Firm size 0.03 (0.01)* Firm risk 0.01 (0.01) Firm diversification 0.03 (0.02)
Firm R&D level 0.02 (0.02)
Firm debt level -0.02 (0.02)
CEO age 0.01 (0.01)
Inside ownership -0.02 (0.01)
Focal variable operational
Accounting performance -0.07 (0.01)** Change variables used -0.04 (0.01)** Methodological artifacts
Panel design -0.01 (0.01)
Endogeneity check 0.00 (0.00)
Number of variables in regression 0.00 (0.00) Control year effect 0.02 (0.01)* Control industry effect -0.04 (0.01)** Study artifacts
Published 0.03 (0.01)*
Median year sample window -0.00 (0.00) Five-year ISI impact factor 0.00 (0.00)
R2 0.27
K 554
QModel (p) 244.86 (0.00)**
QResidual (p) 673.89 (0.00)**
V 0.00391
aUnstandardized regression coefficients are presented for study moderators and substantive moderators with stan-dard errors in parentheses. k is the total number of effect sizes; Q is the homogeneity statistic with its probability in parentheses; v is the random effects variance component.
longer tenure, the association between firm performance and CEO compensation becomes weaker. In contrast to Hypothesis 3b, we find that in the presence of larger boards, the association between firm performance and CEO compensation actually becomes stronger. We find support for Hypothesis 4, that board independence positively moderates the performance–pay relationship. However, we find no moderating effect of ownership concentration on the performance–pay relationship, as hypothesized by Hypothesis 5b. Finally, we find support for Hypothesis 6b, as institutional ownership positively moderates the performance–pay relationship.
In terms of our control variables, the only significant finding was a positive effect for the firm size variable, which suggests that firm size positively moderates the performance–pay relationship. In terms of the indicators that measure the operationalizations of specific variables, we find a negative significant result for compensation changes to performance changes, which indicates that studies using absolute levels of compensation tend to identify stronger performance–pay relationships than those using changes in the levels of performance and compensation. We also find a negative effect for accounting performance, implying that studies that use accounting-based measures tend to find weaker performance–pay relationships than studies that use market-based measures as indicators for firm performance. Of the methodological moderators, our findings suggest that studies that control for the effects of time show stronger associations between firm performance and CEO compensation and studies that control for industry effects tend to find weaker associations. Finally, in terms of study artifacts, the significant positive effect for the published variable indicates that the “file drawer problem” (Rosenthal, 1979) is present in the executive pay field, implying that studies reporting greater effects have a better chance of being published.
As a robustness check of the MARA results, we examined the effects of the indicators of CEO and board power on the proportion of LTIPs to total compensation using the HOMA procedure. Examining the proportion of LTIPs relative to total compensation serves as a robustness check for our analyses of performance–pay sensitivities because LTIPs are usually based on firm performance. Therefore, the proportion of LTIPs to total compensation can be seen as an indicator of how performance and total pay are linked. Similar to the performance–pay sensitivities analyzed in the MARA results, we expect that more powerful CEOs will have a lower proportion of LTIPs to total compensation. In contrast, we expect that stronger boards will be associated with higher proportions of LTIPs. Appendix E presents the HOMA results, and as expected, they are identical to those of the MARA results in terms of their direction and statistical significance.
Discussion
Over the past decade, MPT has generated productive debates about the determinants of executive compensation by challenging the core assumption of agency theory that executive pay is set through arm’s-length contracting between executives and boards of directors (Bebchuk & Fried, 2004). Although MPT has been provocative, the empirical evidence has been mixed, allowing both proponents and opponents of MPT to argue in favor of and against it (O’Reilly & Main, 2010). In this article, we used a range of meta-analytic techniques to consolidate the often mixed empirical findings of 219 studies and provide a more definitive
Table 6
Summary of Predictions and Results Total Pay
Performance–Pay Sensitivity Indicator of Power Predicted Actual Predicted Actual
CEO duality (Hypothesis 1) + + – ns
CEO tenure (Hypothesis 2) + ns – –
Board size (Hypothesis 3) + + – +
Board independence (Hypothesis 4) – + + +
Ownership concentration (Hypothesis 5) – – + ns Institutional ownership (Hypothesis 6) – – + +
assessment than those reported in any single primary study (C. C. Miller & Cardinal, 1994). In this section, we describe the contributions of our study and discuss avenues for future research.
Implications for Managerial Power Theory
Our tests of MPT focused on examining firm-level relationships between six different measures of managerial power and two outcomes: CEO total compensation levels and performance–pay sensitivities. We find support for MPT, but our findings do not allow us to say unequivocally that MPT holds across all conditions. Table 6 summarizes our predictions and findings.
In assessing the evidence regarding the relationship between managerial power and total compensation levels, we find overall support for MPT. Two of the three indicators of CEO power (board size and CEO duality) are positively associated with total pay, suggesting that in most situations where CEOs are expected to have more power over the pay setting process, they have higher levels of total compensation. Similarly, two out of the three indicators of board power (ownership concentration and institutional ownership) are negatively associated with total pay, suggesting that in most situations where boards have more power over the pay setting process, CEOs have lower total compensation. The two exceptions to these patterns are that board independence is positively associated with total compensation and the effect of CEO tenure is not significantly related to total compensation.
The results for performance–pay sensitivities provide less support for MPT. Only one of the indicators of CEO power (CEO tenure) is statistically significant and in the expected negative direction, whereas CEO duality is not significant, and board size is significant but in the opposite (positive) direction. However, two out the three indicators of board power (board independence and institutional ownership) are significant and in the expected positive direction, but ownership concentration is not significant. These results suggest that MPT is better able to explain total pay levels than performance–pay sensitivities. They further suggest that even powerful CEOs have a difficult time mitigating the performance– pay link.
Our total compensation measure may, however, obscure variation in the effects of the indictors of CEO and director power on different forms of compensation. For example, since CEOs may, like most employees, tend to prefer less risky forms of compensation, it is likely that powerful CEOs will have higher levels of cash compensation and have less pay at risk, such as LTIPs (Conyon & Murphy, 2000). To further examine the ability of MPT to account for the influence of CEO and board power on the level of different types of executive compensation, we ran additional MASEM models with the value of total cash compensation and LTIPs as dependent variables (see Appendix F). We find that all three of the indicators of CEO power are associated with higher levels of total cash compensation, whereas only one of the indicators of board power (ownership concentration) is associated with lower levels of total cash compensation. Two other indicators of board power, board independence and institutional ownership, are insignificantly related. Turning to LTIPs, the results reveal that two out of the three indicators of board power (ownership concentration and institutional ownership) are associated with higher levels of LTIPs, whereas board independence is negatively related. Two out of three indicators of CEO power (board size and CEO duality) are also associated with higher levels LTIPs, whereas CEO tenure is negatively related. These results suggest that powerful CEOs have more influence over setting cash compensation levels (even over more powerful boards) and powerful boards have more influence over linking pay to performance (even over powerful CEOs). These supplementary results suggest a more nuanced version of MPT in which different types of actors are able to use their power to influence different types of executive compensation outcomes.
Overall, the meta-analytic evidence reveals that MPT is well equipped for explaining levels of total cash and total compensation but less so for explaining pay at risk and performance–pay sensitivity. Although powerful CEOs seem well positioned to realize higher levels of cash compensation, powerful directors seem to be able to negotiate for higher levels of pay at risk and tighter links between firm performance and CEO compensation. Moreover, the findings suggest that directors can realize these preferences even in the face of powerful CEOs. This is contrary to what MPT predicts and is evidence that executives are not able to use their power unilaterally to influence all outcomes in their favor.
One possible explanation for director power with respect to pay at risk lies in the broader acceptance of the practice of linking pay to performance that emerged during the 1990s, the sample period of most of the studies in our meta-analyses. During this period, LTIPs were increasingly considered more appropriate by shareholders, who became more interested in making links between performance and pay (Zajac & Westphal, 2004), and even among some executives who saw them as another potential mechanism of wealth generation (Bebchuk & Fried, 2004). The institutionalization of practices such as stock options and other forms of LTIPs during this period might have provided directors a solid foundation from which to negotiate, even in the face of powerful CEOs.
An alternative explanation for why we did not find a negative effect of our CEO power indicators on performance–pay sensitivities is that the incentives of directors and CEOs for performance–pay relationships may have actually been aligned, that is, some CEOs may have preferred more performance–pay sensitivity. Such a preference could have been the result of the increased acceptance of such practices noted above, or, since preferences for and perceptions of risk may vary across individuals (Pablo, 1997; Sanders, 2001), it could
have been the result of some executives preferring riskier arrangements or misperceiving the riskiness of their arrangements.
Yet another explanation for the observed variation in the settings where CEOs and directors seem to be able to wield power could lie in the very nature of negotiation itself. Given that both executives and directors want to achieve their objectives but may not be able to obtain everything they seek, the ultimate result may be that although powerful CEOs end up with higher pay levels, they have to accept that their pay is to some extent at risk and more sensitive to performance. This may reflect a payoff in which executives are compensated for taking on other forms of riskier compensation and indicate that executives and directors arrive at solutions in which they both realize some of their objectives.9
Ultimately, our data do not allow us to adjudicate between these and other possible explanations, but the findings highlight the necessity of future research to pay close attention to analyzing the influence of managerial and director power on different types of pay, the preferences of different parties for different forms of pay, and the ratio of pay at risk to total compensation as a dependent variable. The latter would also allow us to better understand the relative importance and implications of pay at risk, which remain understudied (Murphy, 1999).
It is important to note the results that diverge from our primary interpretation. Board power measured by board independence, for example, is influential only in the case of performance–pay sensitivities. More independent boards appear to strengthen performance– pay relationships, but they do not appear to be able to limit the level of cash compensation, nor increase the level of LTIPs. One possible explanation is that independence may be an imprecise measure of board power. Independent directors, for example, may be prone to CEO influence because of the role of CEOs in director selection, the bonds of shared interests and collegiality among board members, and their dependence on executives for information (Bebchuk & Fried, 2004). In addition, independent directors are often outsiders who have limited inside information on the firm or on the day-to-day operations of its chief executive. For them, the choice between monitoring behavior and rewarding outputs may be decided in favor of the latter, as direct monitoring is less practical for them. This highlights the need for future research to develop better theoretical conceptualizations and measures of board independence.
The findings for CEO tenure also diverge from the overall pattern. Tenure is negatively associated with levels of LTIPs and lower performance–pay sensitivity, contrary to our main findings that powerful CEOs have a difficult time negotiating for exactly these outcomes. A reasonable interpretation of this is that CEOs with longer tenure are closer to retirement and that boards recognize this and may reduce longer-term incentives, focusing more on cash and shorter term incentives (Nourayi & Mintz, 2008). This may also explain why we do not find a significant positive association between CEO tenure and total compensation but do find a significant positive association with total cash compensation. Another explanation could be that CEO power increases cash compensation because extended tenure prevents CEOs from receiving higher pay that is associated with the premiums paid by hiring firms to motivate CEOs to give up their firm-specific human capital and take on the risk of moving to another firm where they lack this kind of capital (Harris & Helfat, 1997).