Biomass Sustainability
Analysis
An assessment of Ontario-sourced forest-based
biomass for electricity generation
FINAL REPORT
Revision CMike Kennedy
Rich Wong, Andrew Vandenbroek, Dave Lovekin, Marlo Raynolds
Kennedy, Mike
Biomass Sustainability Analysis –rC April 2011
Editor: Roberta Franchuk ©2011 The Pembina Institute The Pembina Institute
Box 7558
Drayton Valley, Alberta Canada T7A 1S7 Phone: 780-542-6272 Email: [email protected]
About the Pembina Institute
The Pembina Institute is a national non-profit think tank that advances sustainable energy solutions through research, education, consulting and advocacy. It promotes environmental, social and economic sustainability in the public interest by
developing practical solutions for communities, individuals, governments and businesses. The Pembina Institute provides policy research leadership and education on climate change, energy issues, green economics, energy efficiency and conservation, renewable energy, and environmental
governance. For more information about the Pembina Institute, visit www.pembina.org or contact [email protected]. Our engaging monthly newsletter offers insights into the Pembina Institute’s projects and activities, and highlights recent news and publications. Subscribe to Pembina eNews: http://www.pembina.org/enews/subscribe.
About the Authors
Mike Kennedy
Mike served as a senior researcher with the Pembina Institute on this project. His specialization is in the economic dimensions of environmental and natural resource management, including market-based instruments, renewable energy policy, ecosystem service management and valuation, sustainability indicators and oil and gas tax policy.
Mike has completed policy analysis in the areas of biomass sustainability, policy instruments for land and resource conservation, ecological governance, oilsands- and mining-related
environmental liabilities, and socio-economic impacts of resource developments on local and regional communities. Mike holds a B.Sc. and an M.Sc. from the University of New Brunswick and has worked on natural resource management issues in Canada, Mexico and Costa Rica.
Rich Wong
Rich is one of the Pembina Institute's lead quantitative modellers and has led major life cycle and greenhouse gas (GHG) emissions quantification initiatives modelling industrial and commercial processes. He has developed key GHG tools such as the Excel-based Climate Smart tool, the CoolTool and Pembina's OneLessTonne.ca tool designed for commercial and residential users. Rich also specializes in GHG accounting, GHG calculators and GHG offsets.
Rich has completed extensive technical research into the areas of biomass cogeneration systems, ethanol production, waste-to-energy processes, tire recycling, Canadian nuclear power, coal gasification (IGCC), carbon capture and storage in Canada, and the costs of carbon neutrality in the Alberta oil and gas sector. He holds a Bachelor of Chemical Engineering and Society from McMaster University and has a professional background in automation and process control systems within the steel-manufacturing sector.
Andrew Vandebroek (The Silvacom Group)
Andrew served as Silvacom's project manager/lead for a team of analysts and GIS specialists supporting the sustainability analysis portion of this project. Andrew has over 5 years of consulting experience with the Silvacom Group fulfilling many roles from a very technical Resource Analyst function, performing mathematical modeling and advanced statistical analysis in the areas of forest mensuration and biometrics, to more traditional Business Analyst roles for many large scale projects, and culminating more recently to managing a variety of major projects for Forestry, Energy, and Utility companies.
Dave Lovekin
Dave Lovekin is with Pembina Corporate Consulting and is certified in GHG accounting and GHG project-level accounting through the Greenhouse Management Institute. Dave’s works with stakeholders in businesses, industry and NGOs in renewable energy technologies, including solar, wind, geothermal, small-scale hydro, bioenergy (biomass, biogas and biofuels), alternative
technologies and energy efficiency solutions, providing technical assessments on the technical and economic feasibility of renewable energy options.
Since joining Pembina in 2008, his key work components include managing various technical projects specific to PCC’s Climate Change services, life cycle assessment and renewable energy. Dave has also been involved in various policy projects related to national energy strategies, renewable energy, carbon capture and storage, and cumulative environmental effects. Dave has a master’s degree in systems design engineering from the University of Waterloo.
Marlo Raynolds
Dr. Marlo Raynolds is senior advisor to the Pembina Institute, and held the position of Executive Director until January 2011. He has worked with the Institute since 1995 in the development and practical application of triple-bottom-line decision-making tools, strategies for sustainability, and policy research and advocacy. Marlo has worked with a wide range of clients including many of the large Canadian energy companies. He holds a PhD in mechanical engineering (University of Alberta), a B.Sc. in systems design engineering (University of Waterloo), and a master's degree in management and leadership for the voluntary sector (McGill University). He is also an adjunct assistant professor of sustainable development at the Haskayne School of Business, University of Calgary and was recognized as one of Canada's "Top 40 Under 40" for 2008.
Acknowledgements
This report was developed as part of a consulting contract for the Ontario Power Generation. An undertaking of this size requires the support and advice of a number of people. The authors would like to thank the following people.
Brad Dollevoet Glen Foley Werner Kurtz Eric Nielson John Parkins Mike Patriquin Dan Rouillard Silvia Stroble Bill White
This report benefited from the participation of the project’s Technical Advisory Committee, funding, input and guidance from Ontario Power Generation, and the expert advice of the people mentioned above. This report is better because of this wide variety of input; however, the authors acknowledge their responsibility for any errors or omissions.
Biomass Sustainability
Analysis
An assessment of Ontario-sourced forest-based
biomass
Contents
Executive summary ... 1
1. Introduction ... 4
1.1 Purpose and scope ... 4
1.2 Defining biomass sustainability ... 8
1.3 Assumptions and limitations ... 9
1.4 Outline of report ...10
2. Background: Measuring biomass sustainability ...11
2.1 Defining biomass sustainability criteria and an indicator framework ...11
3. Modelling framework ...14
3.1 Future biomass sustainability scenarios ...14
3.2 Potential sources of biomass volume for wood pellet production ...17
3.3 Biomass sustainability modelling methodology ...18
3.3.1 Life cycle activity map – Biomass combustion for electricity ...19
3.3.2 Provincial Impact Assessment Model ...21
3.3.3 Life cycle analysis of biomass supply chain ...22
3.3.4 Forest carbon accounting framework ...23
3.3.5 Costs and revenue estimations ...26
3.3.6 Social well-being modelling ...27
4. Sustainability analysis results: Environmental indicators ...31
4.1 Total carbon stored in Crown land forests ...31
4.2 Total biomass tonnage available and harvested ...34
4.3 Life cycle GHG emissions for the biomass pathway ...36
4.3.2 GHG Emissions for the MSH Scenario ...38
4.4 Biomass pathway versus natural gas pathway ...39
4.4.1 BAU + 2M ODT scenario ...40
4.4.2 MSH scenario ...42
5. Sustainability analysis results: Social well-being indicators ...45
5.1 Social well-being impacts — BAU + 2 M ODT Scenario ...45
5.1.1 Maintain or enhance socio-economic well-being ...45
5.1.2 Biomass production contributes to local and national prosperity ...48
5.2 Social well-being impacts — MSH Scenario ...48
5.2.1 Maintain or enhance socio-economic well-being ...48
5.2.2 Biomass production contributes to local and national prosperity ...49
6. Discussions and Recommendations ...51
6.1 Summary of key findings ...51
6.2 Discussion ...52
6.3 Recommendations for biomass sustainability ...53
6.3.1 Recommendations for Ontario Power Generation ...54
6.3.2 Recommendations for the Ontario Government ...54
6.4 Further research and analysis ...55
Appendix A. Technical Advisory Committee ...57
Appendix B. Biomass sustainability indicator framework ...59
Appendix C. Modelling constraints and assumptions ...72
Appendix D. Supporting information for Provincial Planning Model ...74
Appendix E. GHG life cycle assessment supporting information ...75
Appendix F. GHG and economic cost coefficients ...80
Appendix G. Sustainability analysis – detailed results ...83
Appendix H. Age class structure of the Boreal and GLSL forests ... 106
Appendix I. Addendum – Analysis of pellet production for the northwest region of Ontario ……….109
List of Figures
Figure 1. Geographic scope of the Biomass Sustainability Analysis ... 6
Figure 2. Locations of the proposed pellet plans by forest management administrative unit. ... 7
Figure 3. Outline of the modelling framework used for the OPG Biomass Sustainability Analysis ...14
Figure 4. Timber harvest level assumptions for the BAU and BAU + 2 M ODT scenarios. ...15
Figure 5. Timber harvest rates for the MSH scenario. ...17
Figure 6. Biomass pellet life cycle activity map...20
Figure 7. Total carbon stored in Ontario’s Crown land forests for all four scenarios ...32
Figure 8. Total tonnage (M ODT/year) of biomass available and harvested for the BAU +2M ODT and MSH scenarios ...35
Figure 9. Proportion of GHG emissions by activity type for the BAU + 2 M ODT scenario ...36
Figure 10. Total greenhouse gas emissions (CO2e/10 year period) for the BAU + 2 M ODT scenario ...37
Figure 11. Proportion of GHG emissions by biomass activity type for the MSH scenario ...38
Figure 12. Total greenhouse gas emissions (CO2e/10 year period) for the MSH scenario ...39
Figure 13. Comparison of GHG emissions produced for the biomass and NGCC pathways for the BAU + 2 M ODT scenario. ...41
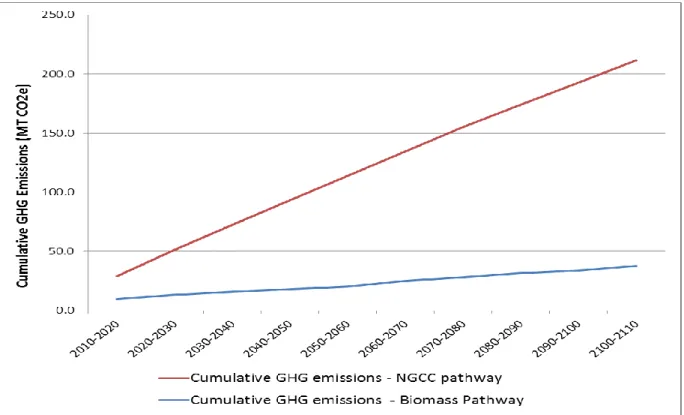
Figure 14. Cumulative GHG emissions for the biomass and NGCC pathways for the BAU + 2M ODT scenario ...42
Figure 15. Comparison of GHG emissions produced for the biomass and NGCC pathways for the MSH scenario ...43
Figure 16. Cumulative GHG emissions of the biomass and NGCC pathways for the MSH scenario ...44
Figure 17. Average annual burn fraction applied to the modelling scenarios ...74
Figure 18. Total carbon stored in the Boreal forest for the No Harvest scenario ...83
Figure 19. Total carbon stored in the GLSL forest region for the No Harvest scenario ...84
Figure 20. Total carbon stored in the Boreal and GLSL forest region for the No Harvest scenario ...84
Figure 21. Periodic change in Boreal forest carbon for the No Harvest scenario ...85
Figure 22. Periodic change in GLSL forest carbon for the No Harvest scenario ...85
Figure 23. Periodic change in Boreal and GLSL forest carbon for the No Harvest scenario ...86
Figure 24. Total carbon stored in the Boreal Forest region by product pool for the BAU Scenario ...86
Figure 25. Total carbon stored in the GLSL forest region by product pool for the BAU scenario87 Figure 26. Total carbon stored in the Boreal and GLSL forest regions for the BAU scenario ...87
Figure 27. Periodic change in Boreal forest carbon stored for the BAU scenario...88 Figure 28. Periodic change in GLSL forest carbon stored for the BAU scenario ...88 Figure 29. Periodic change in carbon stored for the Boreal and GLSL forest regions ...89 Figure 30. Change in Boreal forest carbon stored between the ―no harvest‖ and the BAU
scenarios ...89 Figure 31. Change in GLSL forest carbon stored between the No Harvest and the BAU
scenarios ...90 Figure 32. Change in Boreal and GLSL forest carbon between the No Harvest and the BAU
scenarios ...90 Figure 33. Total carbon stored in the Boreal forest region by product pool for the BAU + 2 M
ODT scenario ...91 Figure 34. Total carbon stored in the GLSL forest region by product pool for the BAU + 2 M
ODT scenario ...91 Figure 35. Carbon stored in the Boreal and GLSL for the BAU + 2 M ODT scenario ...92 Figure 36. Periodic changes in Boreal forest carbon stored for the BAU + 2 M ODT scenario ..92 Figure 37. Periodic changes in GLSL forest carbon stored for the BAU + 2 M ODT scenario ....93 Figure 38. Periodic changes in Boreal and GLSL forest carbon stored in the BAU + 2M ODT
scenario ...93 Figure 39. Periodic change in Boreal forest carbon stored between the BAU and BAU + 2 M
ODT scenarios ...94 Figure 40. Periodic change in GLSL forest carbon stored between the BAU and BAU + 2M ODT scenarios ...94 Figure 41. Periodic change in Boreal and GLSL forest carbon stored between the BAU and BAU
+ 2 M ODT scenarios ...95 Figure 42. Total tonnage (ODT) of available biomass for pellet production in the Boreal forest
region for the BAU + 2M ODT scenario ...95 Figure 43. Total tonnage (ODT) of available biomass for pellet production in the GLSL forest
region for the BAU + 2M ODT scenario ...96 Figure 44. Total tonnage (ODT) of available biomass for pellet production in the Boreal and the
GLSL forest regions for the BAU + 2M ODT scenario. ...96 Figure 45. Total tonnage (ODT) of biomass harvested for pellet production in the Boreal forest
region for the BAU + 2M ODT scenario ...97 Figure 46. Total tonnage (ODT) of biomass harvested for pellet production in the GLSL forest
region for the BAU + 2M ODT scenario ...97 Figure 47. Total tonnage (ODT) of biomass harvested for pellet production in the Boreal and
GLSL forest regions for the BAU + 2M ODT scenario ...98 Figure 48. Total carbon stored in the Boreal forest region by product pool for the MSH scenario
...98 Figure 49. Total carbon stored in the GLSL forest region by product pool for the MSH scenario
Figure 50. Total carbon stored in the Boreal and GLSL forest region by product pool for the
MSH scenario ...99
Figure 51. Periodic changes in Boreal forest carbon stored for the MSH scenario ... 100
Figure 52. Periodic changes in GLSL forest carbon stored for the MSH scenario ... 100
Figure 53. Periodic changes in Boreal and GLSL forest carbon stored for the MSH scenario . 101 Figure 54. Periodic change in Boreal forest carbon stored between the BAU and MSH scenarios ... 101
Figure 55. Periodic change in GLSL forest carbon stored between the BAU and MSH scenarios ... 102
Figure 56. Periodic change in Boreal and GLSL forest carbon stored between the BAU and MSH scenarios ... 102
Figure 57. Total tonnage (M ODT) of available biomass for pellet production in the Boreal forest region for the MSH scenario. ... 103
Figure 58. Total tonnage (M ODT) of available biomass for pellet production in the GLSL forest region for the MSH scenario. ... 103
Figure 59. Total tonnage (M ODT) of available biomass for pellet production in the Boreal and the GLSL forest regions for the MSH scenario... 104
Figure 60. Total tonnage (M ODT) of biomass harvested or pellet production in the Boreal forest region for the MSH scenario. ... 104
Figure 61. Total tonnage (M ODT) of biomass harvested for pellet production in the GLSL forest region for the MSH scenario. ... 105
Figure 62. Total tonnage (M ODT) of biomass harvested for pellet production in the Boreal and the GLSL forest regions for the MSH scenario... 105
Figure 63. Age class of the Boreal Forest in 2010 ... 106
Figure 64. Age class of the Boreal Forest in 2050 ... 106
Figure 65. Age class of the Boreal Forest in 2110 ... 107
Figure 66. Age class of the GLSL Forest in 2010 ... 107
Figure 67. Age class of the GLSL Forest in 2050 ... 108
Figure 68. Age class of the GLSL Forest in 2100 ... 108
Figure 69. Forest Management Units for the Atikokan 100K scenario ... 110
Figure 70. Forest Management Units for the Atikokan 200K scenario ... 110
Figure 71. Forest Management Units for the Atikokan-Thunder Bay 500K scenario ... 111
Figure 72. Total carbon stored for the Atikokan 100K, Atikokan 200K and Atikokan-Thunder Bay 500K scenarios... 112
Figure 73. Total biomass inventory and harvested for Atikokan 100K, Atikokan 200K and Atikokan-Thunder Bay 500K scenarios ... 113
Figure 74. Proportion of GHG emissions by activity type for the Atikokan 100K scenario ... 114
Figure 76. Proportion of GHG emissions by activity type for the Atikokan 200K scenario ... 115 Figure 77. Life cycle GHG emissions for the Atikokan 200K scenario ... 116 Figure 78. Proportion of GHG emissions by activity type for the Atikokan-Thunder Bay 500K
scenario ... 117 Figure 79. Life cycle GHG emissions for the Atikokan-Thunder Bay 500K scenario ... 118 Figure 80. Comparison of GHG emissions produced for the biomass and NGCC pathways for
the Atikokan 100K scenario. ... 119 Figure 81. Cumulative GHG emissions of the biomass and NGCC pathways for the Atikokan
100K scenario ... 120 Figure 82. Comparison of GHG emissions produced for the biomass and NGCC pathways for
the Atikokan 200K scenario. ... 121 Figure 83. Cumulative GHG emissions of the biomass and NGCC pathways for the Atikokan
200K scenario ... 121 Figure 84. Comparison of GHG emissions produced for the biomass and NGCC pathways for
the Atikokan-Thunder Bay 500,000 scenario. ... 122 Figure 85. Cumulative GHG emissions of the biomass and NGCC pathways for the
List of Tables
Table 1. Scenarios included in the sustainability analysis ... 4
Table 2. Criteria and indicators to estimate environmental sustainability ...12
Table 3. Criteria and indicators to estimate socio-economic well-being ...12
Table 4. Breakdown of 2M ODT of biomass ...16
Table 5. Potential sources of forest-based biomass for wood pellet production ...17
Table 6. Summary of data sources for the Provincial Planning Model ...21
Table 7. Forest carbon pools included in this analysis...24
Table 8. Sensitivity analysis on the definition of forest dependence ...28
Table 9. Descriptive statistics of the social well-being model (using 5% labour force cut off) ...29
Table 10. Drop in total carbon stored from BAU to BAU + 2M ODT scenario and from BAU to MSH scenario ...33
Table 11. GHG emissions (CO2e/year) by biomass activity type for the BAU + 2 M ODT scenario ...37
Table 12. Annual GHG emissions by biomass activity type for the MSH scenario for the Boreal and GLSL forest regions ...39
Table 13. Description of carbon account framework used to compare biomass and natural gas scenarios ...40
Table 14. Labour force (LF) contribution for the BAU + 2M ODT scenario ...45
Table 15. Social well-being results for the BAU + 2 M ODT scenario ...46
Table 16. Estimated GDP contribution ($ millions/year, discounted at 4%) from the biomass sector to Ontario’s GDP for the BAU + 2 M ODT scenario ...48
Table 17. Labour force (LF) contribution (full-time equivalents) from the MSH scenario. ...48
Table 18. Social well-being results for the MSH scenario ...49
Table 19. Estimated GHG contribution ($ millions/year, discounted at 4%) from the MSH scenario ...49
Table 20. List of TAC members that participated in this project. ...57
Table 21. C&I for management planning, monitoring and compliance ...60
Table 22. C&I for renewable resource use ...61
Table 23. C&I for greenhouse gas emissions and forest carbon cycle ...62
Table 24. C&I for air emissions ...62
Table 25. C&I for soil quality and site productivity ...63
Table 26. C&I for hydrology and water quality ...64
Table 27. C&I for biodiversity and terrestrial habitat ...65
Table 29. C&I for indigenous people’s rights ...69
Table 30. C&I for community engagement ...70
Table 31. Environmental modelling – Main assumptions ...72
Table 32. Socio-economic Modelling Assumptions ...73
Table 33: List of material, energy and distance inputs used in the LCA ...76
Table 34. Life cycle GHG coefficients ...80
Table 35. Cost coefficients ...81
Table 36. FMU numbers for each scenario ... 111
Table 37. Change in total carbon stored for the Atikokan 100K, Atikokan 200K and Atikokan-Thunder Bay 500K scenarios ... 112
Table 38. Annual GHG emissions by biomass activity type for the Atikokan 100K scenario .... 115
Table 39. Annual GHG emissions by biomass activity type for the Atikokan 200K scenario .... 116
Table 40. Annual GHG emissions by biomass activity type for the Atikokan-Thunder Bay 500K scenario ... 118
Table 41. Estimated contribution ($ millions/year, discounted at 4%) from the biomass sector to Ontario’s GDP for the Atikokan 100K scenario ... 124
Table 42. Labour force contribution for the Atikokan 100K scenario ... 124
Table 43. Estimated contribution ($ millions/year, discounted at 4%) from the biomass sector to Ontario’s GDP for the Atikokan 200K scenario ... 124
Table 44. Labour force contribution for the Atikokan 200K scenario ... 125
Table 45. Estimated contribution ($ millions/year, discounted at 4%) from the biomass sector to Ontario’s GDP for the Atikokan-Thunder Bay 500K scenario ... 125
Executive summary
The Government of Ontario has committed toeliminating coal-fired power by end of 2014 as a step towards meeting Ontario’s
commitment to fighting climate change. Because of this mandate, Ontario Power Generation (OPG) is evaluating the feasibility of converting coal-fired electricity generating units to fire (or to co-fire with natural gas) Ontario-sourced renewable biomass. In response to a Request For Proposals bid, the Pembina Institute was selected to analyze existing data sources and information and report on the economic, social and
environmental sustainability of electricity generation from renewable forest-based biomass. This sustainability analysis is conducted in the context of four scenarios, chosen by OPG, for the timeframe 2015 to 2115.
To guide the sustainability modelling and analysis it is critical to define what is meant by ―biomass sustainability.‖ The definition of renewable biomass that was adopted for this report is defined by the United Nations Framework Convention on Climate Change. The sustainability analysis studies four scenarios in total; two baseline scenarios and two future scenarios where forest-based biomass would be harvested to supply biomass feedstock for pellet production. The first future scenario is to supply two million oven dried tonnes (ODT) of wood pellets as a co-product to a ―business as usual‖ (BAU) forest industry (herein referred to as the BAU + 2 M ODT scenario). The other future biomass scenario is to examine the maximum volume of wood pellets that can be
co-produced from forest operations on Ontario’s Crown land while still meeting the definition
of renewable biomass (herein referred to as the MSH scenario). Under both of these scenarios timber harvesting was assumed to take place under an environmental policy whereby the total forest carbon stock cannot decline over the planning horizon. Also, it is assumed throughout this analysis that the wood pellets would be used to supply four electricity generation stations in the province: Atikokan, Thunder Bay, Nanticoke and Lambton.
Two baseline scenarios provide estimates of forest carbon without an incremental wood pellet industry. The first baseline scenario examines the trends in forest carbon in the absence of any harvesting (i.e. no forest industry) (herein referred to as the No Harvest scenario) and the second scenario examines the trends in forest carbon under the current business-as-usual harvest rates in the province (herein referred to as the BAU scenario). Evaluating the sustainability of OPG’s
proposed use of forest-based biomass involves defining and modelling a range of forest, carbon and operational parameters for the forest landbase being considered — specifically the forest management units (FMUs) operating in the Boreal and Great Lakes–St. Lawrence (GLSL) forest regions of Ontario. This required the use of the Ontario Ministry of Natural Resources’ (OMNR) Provincial Impacts Assessment Model that incorporates forest carbon pools, life cycle GHG emissions coefficients and direct cost, revenue and employment multipliers to provide outputs for the sustainability criteria and indicators. The results for these indicators are presented in Chapter 4.
To assess the potential impacts of using forest-based biomass on forest-dependent
communities, we have developed a social well-being modelling framework to estimate a suite of socio-economic indicators that
contribute to a community’s well-being. The results for these indicators are presented in Chapter 5.
The results of this analysis contribute to the on-going discussion related to biomass sustainability specific to OPG’s interests in utilizing biomass for electricity generation. As well, given the focus of this analysis and its relevance to the business strategy of OPG and policymaking in this area for the Government of Ontario, it is important to highlight the most salient findings from this work. The following key findings are supported by this analysis:
Harvesting of forest biomass for electricity production can be done in such a way as to not systematically decrease forest carbon stores over time (Figure 7). This outcome is consistent with the UNFCCC definition of renewable biomass.
This analysis validated that the availability of renewable biomass for pellet production is directly tied to current harvesting
activities on Crown land. Further, the future supply of renewable biomass for pellet production is constrained to a sustainable harvest level of 16 Mm3/year for the first five years of the analysis (2015 to 2020) and 20.1 Mm3/year for the remaining time periods in the planning horizon.
In Ontario, there is a sustainable long-term flow of 2.9M ODT at existing harvest rates in the Boreal and GLSL forest regions (Figure 44). Further, additional biomass at an average of 3.1 M ODT, is harvested at a rate of 20.1 Mm3/year (Figure 59).
There are a variety of biomass resource types available for pellet production in the province and these resource types have unique impacts on forest carbon, life cycle GHG emissions and costs. This analysis indicates that the priority biomass sources include: sawmill waste, forest residues from logging, low-grade wood volumes, and salvage wood volumes post-fire. High-grade timber volumes are not specifically targeted to be a resource for energy production in this study. All biomass resources are composed of waste (forest residues and sawmill waste), low-grade timber volumes and
non-merchantable timber volume in clearcut stands.
The use of biomass for electricity generation at a level of 2M ODT/year produces an average net contribution of 0.26 MT CO2e/year (Figure 13) taking into account both life-cycle emissions to produce and transport biomass as well as net changes in forest carbon compared to BAU. Therefore, under the assumptions laid out in the BAU + 2M ODT scenario, biomass for electricity generation is renewable but on a life-cycle basis is a net source of GHG emissions.
Relative to a natural gas pathway, using biomass for electricity generation at an annual consumption rate of 2M ODT/year (BAU + 2 M ODT scenario) reduces emissions by 106.0 MT CO2e over the 100-year planning horizon or on average 1.0 MT CO2e reduction annually. This represents an 80% reduction from the natural gas pathway.
The social well-being impacts associated with introducing a biomass sector to the province (as per the BAU + 2 M ODT and MSH scenarios) is not expected to make a substantial impact on the social outcome variables examined. However, a biomass
sector in the province (as per the BAU + 2 M ODT and MSH scenarios) would create more than 3,569 and 5,779 new full-time jobs (Table 14 and Table 17), respectively over 15 years (2015-2030).
As well, from the BAU + 2 M ODT and MSH scenarios we could expect an average annual contribution to GDP of $590 million (Table 16) and $729 million (Table 19), respectively.
There are a number of business and
sustainability recommendations that can be made from this analysis:
Using biomass for wood pellet production as a substitute fuel source for coal and natural gas will lead to meaningful
reduction in GHG emissions. As such, the focus of new generation station conversion should consider biomass as a priority feedstock.
If OPG chooses to proceed further with converting additional coal power plants to utilize renewable biomass, consideration should be given to sourcing some volumes of biomass from sustainably-managed private lands and agriculture resources to ensure the long-term viability of biomass supplies, in the event that the forest industry does not recover.
To enhance the local economic
development potential of using renewable biomass for electricity production, OPG should encourage pellet providers to locate their pellet plants in communities,
including Aboriginal communities. Many of these communities are forest dependent, and focusing long-term investments in the biomass industry in these communities is likely to provide the most benefit for each dollar invested in a biomass sector.
While not examined in this analysis, it is to be expected that OPG and the Province of
Ontario will experience economic gains from using an energy resource that can be
sustainably sourced within Ontario rather than importing fossil fuels. As such, there will be additional financial resources available that could be considered for investment in research and development to drive improvements in biomass processing, more efficient
combustion technologies, and innovations along the biomass supply chain — all of which will enhance the overall viability of biomass as a long-term source of energy for Ontario.
1. Introduction
1.1 Purpose and scope
The Government of Ontario has committed to eliminating coal-fired power by the end of 2014 as a step towards meeting Ontario’s commitment to fighting climate change1
. Because of this mandate, Ontario Power Generation (OPG) is evaluating the feasibility of converting coal-fired electricity generating units to fire (or to co-fire with natural gas) with Ontario-sourced renewable biomass.
In response to a Request For Proposals bid, The Pembina Institute was selected to research and analyze existing data sources and information and report on the economic, social and
environmental sustainability of electricity generation from renewable forest-based biomass. This sustainability analysis, is conducted in the context of four scenarios, chosen by OPG, for the timeframe 2015 to 2115. The four scenarios are presented in Table 1.
Table 1. Scenarios included in the sustainability analysis2 Scenario Abbreviation Objective
No harvest NH To understand the long-term (100-year) trends in forest ecosystem carbon and forest volumes in the absence of on-going human disturbance. Historical harvest rates BAU To understand the long-term trends (100-year) in
forest carbon and forest volumes with the presence of traditional forest sector activity (i.e. pulp and paper and wood product manufacturing sectors).
Historical harvest rates with biomass wood pellet production (2 million oven-dried tonnes (ODT) per year) 3
BAU + 2M ODT To understand the long-term trends (100-year) in forest carbon and other environmental indicators with the presence of traditional forest sector activity and an integrated wood pellet supply chain.
To understand the short-term (15-year) socio-economic implications of introducing an integrated wood pellet supply chain in Ontario.
1 For more information on Ontario’s coal phase out commitment, please visit
http://news.ontario.ca/mei/en/2009/09/ontarios-coal-phase-out-plan.html.
2 A more detailed account of these scenarios is provided in Section 3.1.
3 At a rate that sustains a non-declining forest carbon balance over time relative to BAU.. It is also important to note
that to meet a 2 million ODT target requires a harvest of 2.3 million ODT of pellets as 15% of wood pellets are consumed in the drying process.
Maximum sustainable harvest4
MSH To understand the long-term (100-year) trends in forest carbon and other environmental indicators with the presence of traditional forest sector activity and an integrated wood pellet supply chain.
To understand the short-term (15-years) socio-economic implications of introducing an integrated wood pellet supply chain in Ontario.
OPG commissioned the Pembina Institute to conduct a sustainability analysis of four scenarios in total: two future scenarios where forest-based biomass would be harvested to supply feedstock for pellet production and two scenarios that serve as baseline estimations of forest carbon5. The wood pellets would be used to supply four electricity generation stations in the province, located in Atikokan, Thunder Bay, Nanticoke and Lambton.
These generating stations are located in two regions of Ontario: the boreal northwest region of the province and in southern Ontario. The harvesting and pellet production are to be conducted within the forest management units of the province, Figure 1 shows the distribution of the current forest managements units in the province (46 in total).
4 At a rate that sustains a non-declining forest carbon balance over time relative to BAU. The Maximum sustainable
harvest scenario defined here should not be confused or compared with Ontario’s maximum annual harvest level.
5 Forest carbon is defined as the amount of carbon stored in living and dead forest biomass. This includes carbon
stored in above-ground biomass, below-ground biomass and conventional wood product pools (lumber, paper and fibreboard)
Figure 1. Geographic scope of the Biomass Sustainability Analysis
(Source: OMNR 2010).
Figure 2 shows the location of the pellet plants and generating stations in the future scenarios used to inform the scenario modelling. The modelling framework is described in more details in Chapter 3.
Figure 2. Locations of the proposed pellet plans by forest management administrative unit.
One of the main drivers for OPG to consider the use of biomass for electricity generation is continuous improvement in managing greenhouse gas emissions - as indicated in OPG’s Sustainable Development policy6. As such, a number of key questions related to the GHG balance of this initiative are addressed in this analysis. These questions, taken from OPG’s Request For Proposal, include:
Do Ontario’s forests serve as a carbon sink under all future biomass harvesting scenarios?
Are there circumstances where forest harvest to supply biomass for electricity production causes the level of carbon stocks to systematically decrease over time? Are there circumstances where forest carbon stocks decline in absolute terms? To address these questions, biomass sustainability indicators and supporting modelling frameworks were developed with special attention given to defining the GHG emissions and forest carbon indicators in a way that adequately addresses the above questions.
Further, the sustainability analysis is expected to evaluate a number of social, economic and environmental aspects of sustainability.
The scope of the sustainability analysis includes Ontario-sourced forest based biomass from existing forest operations. The sources of biomass, discussed in more detail in Table 5, that are assessed within this study include:
forest residues (logging slash): tops, limbs, branches from the Boreal and GLSL forest regions
non-merchantable wood from the Boreal forest region and GLSL forest regions low-grade merchantable wood volume from the GLSL and Boreal forest region surplus sawmill residues in all forest management units (i.e., currently unutilized residues)
salvage logging from burned forest stands7 in the Boreal and GLSL forest regions In order to keep the scope of this analysis manageable the following applies:
The focus of the analysis is on the production of wood pellets within industrial managed forests. As such, single-species and mixed-species plantations (e.g. willow, hybrid poplar and genetically modified forest plantations),8 afforestation,9 and agro-forestry activities10 are considered out of scope.
The expected combustion technology being considered by OPG is fixed in the short term; therefore an extensive review of best available technologies for using wood-based pellets is out of scope.
Only wood-based pellets from Ontario are within the scope of OPG’s project (i.e.
imports of wood pellets outside of Ontario are not considered); therefore when assessing sustainability aspects of biomass harvesting and transportation activities and co-firing, only data and information pertaining to Ontario operations is included.
High grade timber volumes are not specifically targeted to be a resource for energy production in this study. All biomass resources are composed of waste (forest residues and sawmill waste), low-grade timber volumes and non-merchantable timber volumes (i.e. pulpwood).
1.2 Defining biomass sustainability
To guide the sustainability modelling and analysis it is critical to define what is meant by ―renewable biomass.‖ The definition of renewable biomass that was adopted for this report is defined by the United Nations Framework Convention on Climate Change, which reads:11
7 The types of natural disturbances in our modelling were restricted to burned forest stands as this was a modelling
component available from OMNR.
8 Natural Resources Canada, ―Canada’s Forests (Glossary)‖, 2010, http://canadaforests.nrcan.gc.ca/glossary/p.
9 Intergovernmental Panel On Climate Change, ―Glossary of Terms used in the IPCC Fourth Assessment Report,‖ in
Contribution of Working Group III to the Fourth Assessment Report of the Intergovernmental Panel on Climate Change, ed. L.A. Meyer B. Metz, O.R. Davidson, P.R. Bosch, R. Dave (Cambridge, United Kingdom and New York, NY, USA: Cambridge University Press, 2007), http://www.ipcc.ch/pdf/glossary/ar4-wg3.pdf.
10
Agriculture and Agri-food Canada, ―Agroforestry‖, 2010, http://www4.agr.gc.ca/AAFC-AAC/display-afficher.do?id=1177431400694&lang=eng.
Biomass from forest lands is “renewable” if one of the following two conditions applies: 1. The biomass is originating from land areas that are forests where:
(a) The land area remains a forest; and
(b) Sustainable management practices are undertaken on these land areas to ensure, in particular, that the level of carbon stocks on these land areas does not systematically decrease over time (carbon stocks may temporarily
decrease due to harvesting); and
(c) Any national or regional forestry and nature conservation regulations are complied with
2. The biomass is a biomass residue and the use of that biomass residue in the project activity does not involve a decrease of carbon pools, in particular dead wood, litter or soil organic carbon, on the land areas where the biomass residues are originating from.
This definition is used to guide the development of the potential sources of biomass for wood pellet production.
1.3 Assumptions and limitations
When examining the four scenarios, it is important to consider that a number of assumptions are required to enable a macro-scale view of how the scenarios are likely to occur. As is always the case with projections of the future, policy shifts, technological changes and global market shifts can occur to alter actual outcomes on the ground.
Where appropriate, conservative assumptions possible were made in this analysis. These include: Forest management policy in the province of Ontario captures the essence of
sustainability.12 Therefore, critiquing existing forest management policy and practices in the province is out of scope of this work.
The use of the coal power plants (Atikokan, Thunder Bay, Nanticoke and Lambton) remains to be defined by the province of Ontario and OPG. However, to examine the depth and breadth of impacts on sustainability, OPG has outlined four scenarios to review. These scenarios are intended to represent the ―book-ends‖ of sustainability for using forest-based biomass co-firing electricity production.
The biomass thermal combustion technologies for electricity generation, for the purpose of this analysis, is fixed. This report does not examine other wood pellet-based
technologies, nor other forms of renewable energy. This report assumes that the two fuel types available for the four generation stations outlined above are natural gas and wood pellets.
12 Government of Ontario. ―Crown Forest Sustainability Act, 1994‖ available online:
This report assumes that the current forest industry in the province has been in decline for at least the past five years. This decline has driven down the actual Crown land harvest level and nearly eliminated the pulp and paper industry. However, government intervention via the wood competitiveness process is expected to lead to full production being reached in the forest sector by 203513. Estimations for available biomass are based on future harvest levels and these assumptions are captured in Section 3.1.
Low-grade14 timber volumes in GLSL region are currently not commercially viable for traditional wood product markets, therefore harvesting and using this volume of timber for wood pellet production is not expected to impact any existing or future markets for conventional wood products.
Sawmill residue, in the present and future, is available beyond the current level of consumption by the pulp and paper industry15. Therefore any surplus volume of sawmill waste will be directed to bioenergy production.
The assessment and comment on Aboriginal treaty rights related to resource development are beyond the scope of this report.
1.4 Outline of report
This report is structured into five sections:
Chapter 2 provides a summary of the sustainability analysis framework used to evaluate the environmental and social well-being aspects of biomass sustainability.
Chapter 3 provides details on the environmental and social well-being modelling frameworks used for the sustainability analysis.
Chapter 4 discusses and summarizes the environmental indicator results from the analysis.
Chapter 5 discusses and summarizes the social well-being indicator results from the analysis.
Finally, Chapter 6 provides a comprehensive summary of key findings, discussion and recommendations to OPG and the Province of Ontario on the overall results of this analysis. The chapter concludes with recommendations for further research and analysis that will provide further advancements on the knowledge, benefits and costs of using forest-based biomass for electricity production.
13 This assumption is not based on any market analysis information but by the expectations of future forest sector
growth, as indicated by the project Technical Advisory Committee and Ontario Ministry of Natural Resources.
14
Low-grade is equivalent to pulp-grade wood products.
2. Background: Measuring
biomass sustainability
2.1 Defining biomass sustainability criteria and an indicator
framework
In work preceding this report, OPG commissioned the Pembina Institute to develop a biomass sustainability criteria and indicator framework based on the leading peer-reviewed sources. Appendix B presents the full criteria and indicator framework that was developed.
Unfortunately, data availability constrains the ability for this analysis to include the full suite of comprehensive criteria and indicators. To transparently choose which indicators would be reported on in this sustainability analysis, and to create a manageable and representative sustainability indicator framework, the following set of guiding principles was developed:16
- Meaningful: the criteria and indicator provides critical information to guide OPG’s decision-making related to using biomass co-firing for electricity generation.
- Measurable: the indicator can be measured with existing data sources or within the existing modelling framework.
- Variable: the criteria and their ensuing indicators are directly responsive to changes in the forest biomass supply-chain. Indicators that are constant over the time frame (e.g. resource efficiency) are not considered in the sustainability analysis.
- Validated: modelling inputs are gathered from peer-reviewed sources and expert opinion and the results are assessed against credible published sources and expert opinion.
- Appropriate to scale: modelling results, and the variables driving the modelling results, are appropriate to the spatial and temporal scales of the aspect of sustainability being considered. For example, socio-economic impacts are centred on forest-dependent communities in regions where the majority of the biomass harvesting is likely to take place.
Using the above principles, modelling criteria and indicator frameworks were developed to evaluate the environmental sustainability and socio-economic well-being of using forest-based biomass. Table 2 and Table 3 provide a summary of the criteria and indicator used in this analysis.
To ensure clarity, the terms used in the following tables are defined here:
Criteria – conditions that have to be fulfilled for an operation to be considered
sustainable or to be eligible for certification.17 Criteria are linked to objectives and have to be operational and measurable.
Indicators – metrics that are used for the measurement of criteria to verify whether criteria are met and principles are observed.18
As in all modelling exercises, it is important to consider the units of all indicators. This is true for the indicators presented in the tables below. When the units are expressed quantitatively (tonnes CO2e/year), those indicators are directly estimated in the model. Where the units are expressed qualitatively (Yes/No) the indicator is met through a modelling constraint.
Table 2. Criteria and indicators to estimate environmental sustainability Criteria Indicator Units
Forest-based biomass use for electricity generation is at a minimum, carbon neutral over the life of the project
Direct GHG emissions from forest-based biomass supply-chain
Tonnes CO2e / year
Change in carbon stored Tonnes CO2e / year
Carbon balance of forest-based biomass
Tonnes CO2e / year
Biomass production does not lead to soil degradation
Dead organic matter Yes / No
(non-declining volume constraint)
Maintenance of high natural value areas
Serial stage distributions19 Yes / No
(area target based on existing policies) Habitat distributions20 Yes / No
(area target based on existing policies) Natural disturbance processes are
accounted for
Timing and intensity of natural disturbances are accounted for
Yes / No
(area target based on existing policies)
Table 3. Criteria and indicators to estimate socio-economic well-being
Criteria Indicator Units
Maintain or enhance socio- Employment benefits Number of people
17 A minimum of Forest Stewardship Council certification is assumed to be a baseline industry standard.
18 J Vandam, M Junginger, et al., ―Overview of recent developments in sustainable biomass certification,‖ Biomass
and Bioenergy 32, no. 8 (August 2008): 749-780, doi:10.1016/j.biombioe.2008.01.018, http://linkinghub.elsevier.com/retrieve/pii/S0961953408000147.
19 Serial stage distributions are outlined in OMNR’s Landscape Guides:
http://www.mnr.gov.on.ca/en/Business/Forests/2ColumnSubPage/258507.html
20 Habitat distributions are outlined in the OMNR’s Landscape Guides:
economic well-being employed by sector Median and family income $ / person,$ / family Contribution to educational
attainment
% increase Prevalence of poverty % of homeowners
spending more than 30% of income on major payments Contribution to unemployment rates % change Biomass production contributes
to local and national prosperity
3. Modelling framework
A modelling framework provides the ability to use existing data sources to estimate the potential outcomes in key environmental and socio-economic indicators. The models presented measure the trends and annual or periodic (by decade) changes in key indicators — in this case, forest use impacts from electricity generation using Ontario-sourced forest biomass. Figure 3 presents the modelling framework defined for the biomass sustainability analysis.
Figure 3. Outline of the modelling framework used for the OPG Biomass Sustainability Analysis
Using Figure 3 as a guide to the modelling framework, the sections below outline the following: Future biomass sustainability scenarios
Potential sources of biomass volume for input into wood pellet production
Biomass sustainability modelling methodology – describes the models and data inputs used to estimate the variables needed to estimate the Biomass Sustainability indicator framework (as detailed in Table 2 and Table 3)
Outlines model validation process used to test the confidence of the modelling results.
3.1 Future biomass sustainability scenarios
OPG defined the following scenarios to be evaluated through this sustainability analysis to provide an indication of the impact of biomass co-firing:
Scenario 1: No Harvest (NH)
Examines the long-term trends in forest and forest carbon dynamics over the 100 year planning horizon when there is no harvesting on the Crown land base.
Includes impact of forest fire disturbances using an average annual burn fraction (See Appendix D).
Scenario 2: Business as Usual (BAU)
Examines the long-term trends in forest and forest carbon dynamics over the 100 years planning horizon with the existence of a traditional forest industry harvesting for the current wood products: (lumber, pulp and paper and oriented strand board (OSB). Harvest level of 15 million cubic meters per year (Mm3/year) for the first 5 years starting in 2015, increasing to a harvest level of 20 Mm3/year for the remainder of the 100-year planning horizon, as shown in Figure 4. This projected harvest level is based on expert opinion and feedback from the project’s Technical Advisory Committee. Includes the impact of forest fire disturbances using an average annual burn fraction. Provides a harvest volume and forest carbon baseline to assess changes in the remaining scenarios.
Figure 4. Timber harvest level assumptions for the BAU and BAU + 2 M ODT scenarios.21
21 It should be noted that the biomass volume would need to be added to the timber harvest level to obtain a total
Scenario 3: BAU plus 2M ODT biomass (BAU + 2M)
Examines the long-term trends in forest and forest carbon dynamics over a 100 years planning horizon with the existence of a traditional forest industry at a provincial Crown land harvest level as described above.
Includes the additional harvest of 2M oven dried tonnes (ODT) of wood pellets from forest biomass from the least-cost biomass sources described in Section 3.2. The breakdown of the 2M ODT of biomass for each of OPG’s four generation stations is shown in Table 4.
Includes the impact of forest fire disturbances using an average annual burn fraction.
Table 4. Breakdown of 2M ODT of biomass Plant Pellet volume requirement
(ODT/year) Percent of total volume required Number of pellet plants required Atikokan 200,000 10% 2 Thunder Bay 300,000 15% 3 Nanticoke 1,125,000 56% 9 Lambton 375,000 19% 3 Total 2,000,000 100% 17
Scenario 4: Maximum sustainable harvest (MSH)
Examines the long-term trends in forest and forest carbon dynamics over time with the existence of a traditional forest industry that is at full capacity with a provincial Crown land harvest level of 16 Mm3/year for the first five years of the planning horizon and 20.1
Mm3/year for the remaining 95 years of the planning horizon (as depicted in Figure 5). Includes the harvest of a resulting volume of forest biomass for wood pellet production (million ODT) from the least-cost biomass sources as described in Section 3.2.
Figure 5. Timber harvest rates for the MSH scenario.
The choice of future biomass supply scenarios is meant to provide the book-ends for potential environmental and socio-economic impacts from employing forest-based biomass for electricity generation.
3.2 Potential sources of biomass volume for wood pellet
production
Through the literature review and discussions with the project Technical Advisory Committee, a list of potential sources of biomass have been defined for the Boreal and GLSL forest regions. Table 5 provides a description of the potential sources of biomass for pellet production that were examined in this study. Section 3.3.1 provides details on how each of these sources of wood biomass contributes to the economics of the biomass supply chain and GHG emissions.
Table 5. Potential sources of forest-based biomass for wood pellet production Forest
Region
Source of Biomass
Description
Boreal Forest harvest residue
Road-side slash from whole tree harvested stands and non-merchantable biomass from whole tree harvested stands. This study assumes that clearcutting is the dominant harvest technique in Ontario’s boreal region.
Low-grade timber volume
Low-grade timber volume in the Boreal forest region refers to white birch wood volumes.
Post-fire salvage
50% of the volume from burned stands is assumed to be available for wood pellet production.
Sawmill waste Saw-dust, chips and bark are a low-cost source of biomass for wood pellets.
The volume available for wood pellet production is assumed to be that volume which is above the level currently consumed by the pulp and paper industry22 for co-generation. Sawmill waste is used as a source of biofibre in Scenario 4 only.
GLSL Forest harvest residue
50% of the bundled slash from tree-length harvest operations in the GLSL forest region is assumed to be available for wood pellet production. This study assumes that selection and shelterwood is the dominant harvest technique in Ontario’s GLSL region. Low-grade
timber volume
Low-grade timber volume in the GLSL forest region refers to 70% pulp-grade wood volume of white birch, 50% of poplar and 75% of tolerant hardwood.
Post-fire salvage
50% of the volume from burned stands is assumed to be available for wood pellet production.
Sawmill waste Sawdust, chips and bark are a low-cost source of biomass for wood pellets.
The volume available for wood pellet production is assumed to be that volume which is above the level currently consumed by the pulp and paper industry for co-generation. Sawmill waste is used as a source of biofibre in Scenario 4 only.
Based on the cost and life cycle GHG assumptions incorporated into the modelling, the biomass resource will are prioritized in the following order:
1. Sawmill waste
2. Forest residues from the Boreal 3. Forest residues from the GLSL 4. Low-grade residues from the Boreal 5. Low-grade timber volume from the GLSL 6. Post-fire salvage volume from Boreal or GLSL. These assumptions align with similar studies on this topic.23
3.3 Biomass sustainability modelling methodology
Evaluating the sustainability of OPG’s proposed use of forest-based biomass involves defining and modelling a range of forest, carbon and operational parameters for the forest landbase being considered – specifically the FMUs operating in the Boreal and GLSL forest regions. This requires the use of OMNR’s Provincial Impacts Assessment Model that incorporates forest carbon pools, life cycle GHG emissions coefficients and direct cost, revenue and employment multipliers to provide outputs for the indicators presented in Chapter 4.
22 The level of volume currently consumed by the pulp and paper industry is defined by historical wood flow data
provided by Ontario Ministry of Natural Resources.
23 Jon McKechnie et al. ―Forest Bioenergy or Forest Carbon? Assessing the Trade-offs in Greenhouse Gas
This section provides an overview of the models used in this analysis to estimate the range of environmental and socio-economic indicators.
3.3.1 Life cycle activity map – Biomass combustion for electricity
Figure 6 displays a life cycle activity map for the activities included in this analysis. The coloured activities (grey and orange) denote those activities that have been excluded from the analysis. The clear activities denote those activities that are specific to the biomass supply chain and represent the incremental activities associated with harvesting biomass for pellet production.
Biomass Pellet Production Activity Map
A. Commissioning
Includes cost in life cycle but not emissions Emissions assumed to be negligible
A1. Produce Steel
A2. Produce Equipment
A5. Transport Materials and Fuels A3. Produce Concrete
A6. Retro-Fit Facility
A4. Extract Fuel
A7. Build Forestry Roads
A8. Construct Pellet Plants
B. Operation
FOREST RENEWAL
BOREAL (Whole Tree Harvest) GLSL (Tree Length Harvest)
Residue Pickup Non-Merchantable & Merchantable Merchantable Non-Merchantable & Residue Pickup
(Roadside) Low Grade Low Grade (Forest)
Sawn Lumber Products Waste to Pulp Mill
B8. Scarification
B12. Pelletize Biomass at Pellet Plant
B13. Transport to Power Plant (Road, Rail, Ship)
B9. Pre Commercial Thinning (PCT) B10. Herbiciding B1. Harvest-Skid-Slash B17. Combust at Thunder Bay B16. Combust at Nanticoke B15. Combust at Lambton B14. Combust at Atikokan B2. Chip at Roadside B19. Saw Lumber Products B18. Road Transport to Sawmill (Logging Trucks) B11. Road Transport to Pellet Plant B7. Planting B1. Harvest-Skid-Slash B5. Greenhouse Operations B20. Fuel Extraction, Processing and Transportation
B2. Chip at Roadside B2. Chip at Roadside
B11. Road Transport to Pellet Plant
B6. Produce Fertilizer
B1. Harvest-Skid-Slash B1. Harvest-Skid-Slash B3. Bundle Residue into CRLs
B4. Skid CRLs to Roadside
C. Decommissioning
C1. Decommission
Facility C2. Transport materials C3. Recycle Materials C4. Landfill Materials
3.3.2 Provincial Impact Assessment Model
To conduct an analysis of alternative biomass scenarios on Crown land in Ontario, we used a provincial forest management planning model developed by Ontario Ministry of Natural Resources (OMNR), referred to here as the Provincial Impact Assessment Model (PIAM). The PIAM was developed using the Remsoft Spatial Planning System to estimate the outcomes for the environmental and socio-economic indicators outlined in Table 2 and Table 3. The Remsoft Spatial Planning System is considered to be a forest industry standard tool used for spatial forest management planning.
Previous research on the issue of biomass harvested for electricity production was conducted using another provincial forest management model called SFMM and the FORCARB-ON model24, which are similar to the provincial planning the models but differ in assumptions and some of the underlying data sources used, which makes directs comparison of the modelling results difficult.
Within the PIAM, forest features are represented for each forest region by stand-type areas, stand yields and eco-site. The model also defines natural and human-induced stand transition patterns, and possible actions taken by FMU forest managers. The PIAM model uses this underlying forest and forest activity information to produce a harvest schedule much like forest industry companies do to meet compliance with the Crown Land Forest Sustainability Act.25
The data sources used to compile the area files, forest stand timber yields, natural and human-induced forest stand transition patterns, and forest management actions are sourced from primary data sets held by various Ontario government departments. Table 6 outlines these departments and the data they provided to support the model used for this analysis.
Table 6. Summary of data sources for the Provincial Planning Model Organization Primary data sources used
Ontario Ministry of Natural Resources (OMNR)
Forest growth and yield data Stand transition data
Descriptions of forest activities
Coefficients to estimate forest biomass volumes from merchantable volume based growth and yield data. Forest product pool definitions and decay rates Forest Management Unit plans
Non-timber harvest constraints from policy documents that include:
Landscape Guides for the Boreal and GLSL forest regions
Canadian Forest Service (CFS) Carbon Budget Model-derived carbon curves for: above-ground forest carbon pools
24
See: Jon McKechnie et al. ―Forest Bioenergy or Forest Carbon? Assessing the Trade-offs in Greenhouse Gas
Mitigation with Wood-Based Fuels‖ Environmental Science and Technology (In Press)
dead organic matter pools snag and dead tree pools
The area of forest in the model represents the area of Boreal and GLSL forest regions and the associated Forest Management Units (Figure 8) within these forest regions. The area of Boreal and GLSL forest regions included in the PIAM represents 32% of the province (28.2 million hectares). The total area of Crown land that was used to source biomass represents 17.5% (18.8 million hectares) of the provincial area.26
In using the PIAM every effort was made to emulate the strategic level planning objectives and constraints adopted by Crown land lease holders. In this regard, the scenario that involved timber harvested was developed using a primary objective function that was to meet the harvest level. For the BAU and BAU + 2 M ODT scenarios this reflects the harvest level shown in Figure 4. For the MSH scenario the objective function consisted of maximizing the sustainable harvest level. One notable exception in our analysis, which differed from current Crown land
management planning related to constraints related to carbon. In our analysis we used carbon constraints to ensure that harvest levels were met while minimizing the decline in forest carbon over time.
3.3.3 Life cycle analysis of biomass supply chain
Life cycle analysis is a quantitative approach to help assess the environmental impacts of any commodity at each stage of the product’s life cycle. In this study, the commodity is biomass-generated electricity and the life cycle includes harvest, transportation to pellet plant,
pelletization, transportation to generating station and combustion at generating station. All the stages considered in the life cycle are shown in Figure 6. This life cycle approach has been used to ensure all impacts are considered. The approach followed in this report is discussed below. Assumptions made and data sources used are included in Appendix E.
ISO life cycle guidance documents 14040 and 1404427 have been used to guide the life cycle assessment. These guidance documents divide the life cycle into five steps: goal definition, scoping, inventory assessment, impact assessment and report writing. These steps are discussed in more detail below with supporting information available in Appendix E.
Goal definition is the entry stage to planning and organizing a life cycle analysis. It is where the project team sets the goals and objectives of the project. Our project team started by researching and reviewing literature related to Ontario forestry, pellet production and pellet combustion for electricity generation. We then defined the primary objectives of the study which is to answer the following questions:
-What are the life cycle GHG emissions of using wood pellets to produce electricity at OPG’s Atikokan, Lambton, Nanticoke and Thunder Bay generating stations?
-Will using biomass pellets be a net GHG benefit?
26 Government of Ontario. ―State of Ontario’s Forests 2006‖ available
online:http://www.mnr.gov.on.ca/en/Business/Forests/2ColumnSubPage/STEL02_179267.html
27 ISO, "Environmental Management - Life Cycle Assessment - Principles and Framework," in ISO 14040:2006(E),
Scoping is where the boundaries of the life cycle analysis are defined. When defining the boundary a number of factors were considered including the basis of comparison (or functional unit), the activities of pellet plant production that would be included or excluded and how environmental impacts would be determined and allocated. These points are discussed in more detail as follows:
-Functional unit –A functional unit for a typical LCA would be set at a unit of production or consumption (e.g. 1 widget produced or 1L of diesel consumed). This study analyzes OPG’s total estimated pellet demand and the functional unit has therefore been set at two million ODT pellets in scenario 3. The functional unit for scenario 4 is the maximum harvest level allowable in Ontario.
-System boundary – Boundary selection is the process of determining which activities should be quantified as part of the life cycle. See Appendix E for further information. -Allocation procedures – Allocation has not been performed in this study.
-Indicators assessed – GHG emissions28 are the focus of this study to determine the carbon balance of using Ontario forest-derived biomass for electricity generation.
Inventory assessment involves the collection of data sources and quantification into life cycle stages. We first reviewed existing studies performed for OPG by Zhang29 and Norbridge30 and then incorporated additional information sources with guidance from the Technical Advisory Committee. See Appendix E for a list of data sources.
Impact assessment evaluates whether the environmental impacts that occurred as a result from the project are significant in a broader context. In this study, impact assessment is only performed for GHGs and socio-economic indicators and this report, in its entirety, is the evaluation of impacts.
Report writing includes the communication of the above steps in a comprehensive and transparent report. This report follows ISO reporting requirements to the extent possible.
3.3.4 Forest carbon accounting framework 3.3.4.1 Measuring forest carbon stocks
In surveying the literature for this report, we identified an abundance of research on the area of forest carbon sequestration. In fact, one study found that in 2007 there were over 100 papers related to forest or forest products carbon sequestration, 80% of which were published since 2000.31 This report builds on this past research by including inventories of biomass resources for
28 CO
2equivalent, which includes CO2, CH4 and N2O,using a Global Warming Potential (GWP) of 1 for CO2, 21 for
CH4 and 310 for N20 29
Zhang et al. 2010. Supporting Information for Life Cycle Emissions and Cost of Producing Electricity from Coal, Natural Gas and Wood Pellets in Ontario, Canada
30
Norbridge. 2010. Biomass Logistics Study Phase II Final Report.
31 Henniagr, Chris et al. A novel approach to optimize management strategies for carbon stored in both forests and