using novel ensemble, consensus and data fusion
techniques. PhD thesis, University of Nottingham.
Access from the University of Nottingham repository:
http://eprints.nottingham.ac.uk/12727/1/thesis_hardbound_final.pdf
Copyright and reuse:
The Nottingham ePrints service makes this work by researchers of the University of
Nottingham available open access under the following conditions.
·
Copyright and all moral rights to the version of the paper presented here belong to
the individual author(s) and/or other copyright owners.
·
To the extent reasonable and practicable the material made available in Nottingham
ePrints has been checked for eligibility before being made available.
·
Copies of full items can be used for personal research or study, educational, or
not-for-profit purposes without prior permission or charge provided that the authors, title
and full bibliographic details are credited, a hyperlink and/or URL is given for the
original metadata page and the content is not changed in any way.
·
Quotations or similar reproductions must be sufficiently acknowledged.
Please see our full end user licence at:
http://eprints.nottingham.ac.uk/end_user_agreement.pdf
A note on versions:
The version presented here may differ from the published version or from the version of
record. If you wish to cite this item you are advised to consult the publisher’s version. Please
see the repository url above for details on accessing the published version and note that
access may require a subscription.
consensus and data fusion techniques
by
Enrico Glaab
Thesis submitted to The University of Nottingham
for the Degree of Doctor of Philosophy
School of Computer Science and Information Technology
The University of Nottingham
Nottingham, United Kingdom
March 2011
Abstract
Motivation: A rapid technological development in the biosciences and in computer science has made it possible to analyse high-dimensional biological datasets, containing measurements for entire genomes, transcriptomes and proteomes, on standard desktop computers. New experimental and computational tech-nologies provide ample opportunities to improve our basic understanding of biological systems and develop better methods for the monitoring, diagnosis and treatment of genetic diseases. However, common prop-erties of the new high-throughput experimental data, like small sample sizes in relation to the number of features, high noise levels and outliers, also pose novel challenges.
Goal: Ensemble and consensus machine learning techniques and data integration methods can address some of these issues, but they often provide very complex models of the system of interest, which lack interpretability and overfit the data. The goal behind this thesis was therefore to develop new approaches to combine algorithms and large-scale biological datasets, including novel approaches to integrate analy-sis types from different domains (e.g. statistics, topological network analyanaly-sis, machine learning and text mining), which are designed not only to exploit the diverse information content in the data sources and the strength of different algorithms, but to provide compact and interpretable models, which enable the extraction of new biological knowledge.
Approach: As the main contribution of this thesis, a novel framework and software collection for inte-grative analysis of gene expression data, gene/protein sets, cellular pathway and protein interaction data was developed and applied to real-world biological datasets from collaborating institutions, focussing on problems in cancer biology.
The framework takes advantage of cross-study normalisation and cross-domain data fusion methods, and enables both the comparison and modular combination of algorithms for different statistical learning tasks (feature selection, classification and clustering). Ensemble and consensus analysis techniques employed for this purpose are re-designed such that the model generation does not only seek to maximise predictive accuracy and model robustness, but also to create compact and interpretable models. More importantly, novel integrative analysis techniques have been developed, which combine algorithmic techniques from different domains (machine learning, network topological analysis, literature mining and optimisation) and use information from multiple data sources (gene expression data, protein interactions, cellular pathway
definitions and gene/protein sets).
Main results:The key deliverables of the doctoral project are new ensemble, consensus and cross-domain bioinformatics algorithms, and new analysis pipelines combining these and classical data mining techniques within a general framework. This framework contains methods for the integrative analysis of both large-scale gene and protein expression data (including the toolsArrayMining,Top-scoring pathway pairsand RNAnalyze) and general gene and protein sets (including the toolsTopoGSA,EnrichNetandPathExpand). Among the biological findings obtained with these new software tools, a central result was the identification of a novel tumour marker gene in collaboration with the Nottingham Queens Medical Centre, facilitating the distinction between two clinically important breast cancer subtypes (framework tool: ArrayMining). Other biomedically relevant findings resulted from a co-operation with the Spanish National Cancer Centre, predicting novel candidate disease genes for Alzheimer’s disease and pancreatic cancer using an integrative analysis combining cellular pathway definitions and protein interaction data (framework tool: PathExpand). Moreover, associations between disease-related processes, including the verification of functional associ-ations between prostate cancer development and different cellular processes, were identified using a new rule-based classification method integrating gene expression and cellular pathway data (framework tool: Top-scoring pathway pairs).
Apart from these results obtained from data fusion techniques, new insights were also gained from the com-bination of diverse analysis techniques, as illustrated by a combined microarray gene selection and network topological analysis, which identified genes that are differentially expressed in different cancers and have outstanding topological properties when being mapped to a molecular interaction network (framework tool: TopoGSA). Finally, new techniques for interactive visualisation and exploration of functional associations in biological data facilitated the interpretation of different real-world datasets, with successful applications in agriculture (analysis of gene regulation in a plant model organism) and biomedicine (analysis of cancer gene expression data;framework tool: VRMLGen).
Acknowledgements
I would like to thank my supervisors, Prof. Natalio Krasnogor and Dr. Jonathan Garibaldi, for the oppor-tunity to pursue my doctoral studies at Nottingham University and for all the support and advice I received during the last three years.
Prof. Krasnogor has helped me to gain the scientific skills that have been essential for my work, provided numerous valuable comments and insightful discussions, and organised external placements for me at two prestigious research institutes, the Spanish National Cancer Centre and the Weizmann Institute of Science. Dr. Garibaldi organised and managed all administrative matters with great dependability and efficiency, helped to secure additional funding, and made the necessary arrangements that allowed me to participate in cross-national fellowship meetings and workshops. In short, the training and opportunities I received will help me beyond the completion of my thesis.
Above all, I am grateful for the support of my family, whose understanding, advice and encouragement has been invaluable for me, not only during the course of my studies. My parents and sister have shown much patience with me and my research, and I hope that we will be able to see each other more often in the future. Many special thanks go to my current and previous office mates Dr. German Terrazas Angulo, Dr. Pawel Widera, Dr. Jaume Bacardit, Dr. James Smaldon, Dr. Azhar Shah, Dr. Leong Ting Lui and Jack Chaplin, and to all fellow PhD students and research colleagues in the ASAP group for many inspiring discussions and making the School of Computer Science a great place to work at.
I am also grateful for the advice and suggestions I received from collaborating scientists during several research projects, in particular Dr. Ana¨ıs Baudot who has supervised my work at the CNIO in Madrid with remarkable attention and competence, my placement host Prof. Alfonso Valencia, for his invaluable expert advice, and the whole Structural Computational Biology Group at the CNIO for a great time in Madrid. Similarly, I thank Prof. Doron Lancet’s group at the Weizmann Institute of Science for their kind hospitality while hosting me in their lab and for an exciting and memorable stay in Israel.
I am also indebted to our collaborating researchers at Nottingham University, namely Dr. George Bassel and Dr. Michael Holdsworth from the Division of Plant and Crop Sciences, the Department of Histopathology
at the Queens Medical Centre, Dr. Ali Mobasheri from the School of Veterinary Medicine, and Dr Maria Toledo-Rodriguez from the Institute of Neuroscience.
Finally, I would like to thank the organisations that have provided financial support through research fel-lowships, in particular the Marie-Curie Early Stage-Training programme (grant MEST-CT-2004-007597) and the Bridging the Gaps initiative.
Contents
Abstract ii
Acknowledgements iv
Contents vii
1 Introduction 1
1.1 Background and Motivation . . . 1
1.2 Aims and Scope . . . 4
1.3 Thesis Organisation . . . 6
1.4 Methodology . . . 7
1.5 Main Results . . . 8
2 Biological Background and Fields of Application 15 2.1 Genetic Disorders and Cancer Diseases . . . 16
2.2 Biomarker Discovery and Outcome Prognosis . . . 18
2.3 Role of Systems Biology in Elucidating the Basis of Complex Diseases . . . 20
3 Literature Review 22 3.1 Low Level Analysis: Pre-Processing, Normalisation and Quality Checking . . . 22
3.2 Higher Level Analysis - Introduction . . . 34
3.3 Dimensionality reduction and feature selection . . . 35
3.4 Class Discovery (Unsupervised Machine Learning) . . . 48
3.5 Class Prediction (Supervised Machine Learning) . . . 59
3.6 Data Integration 1: Cross-Study Analysis . . . 71
3.7 Data Integration 2: Integrating Cellular Pathway Data . . . 73
3.8 Data Integration 3: Integrating Molecular Interaction Data . . . 75
4 Comparison of Standard Machine Learning Techniques and Integrative Extensions 78 4.1 Comparative Evaluation of Feature Selection Methods . . . 82
4.2 Comparative Evaluation of Classification Methods . . . 85 vi
4.3 Comparative Evaluation of Clustering Methods . . . 99
5 Integrative Framework for Gene/Protein Expression Data Analysis (ArrayMining) 112 5.1 Automatic Data Processing and Gene/Protein Name Normalisation . . . 115
5.2 Ensemble and Consensus Analysis of Microarray Data . . . 117
5.3 Specialised Analysis Methods for Microarray Data . . . 122
5.4 Modular Combination of Analysis Techniques / Novel Analysis Pipelines . . . 125
6 Integrative Analysis of Gene/Protein Sets 127 6.1 Network Topological Analysis of Gene/Protein Sets (TopoGSA) . . . 128
6.2 Integrative Enrichment Analysis of Gene and Protein Sets (EnrichNet) . . . 132
6.3 Integrative Extension of Cellular Pathway Definitions (PathExpand) . . . 137
7 Simplifying Classification Rules to Enhance Model Interpretability 149 7.1 Integrative Rule Learning for High-Dimensional Biological Data (TSPP) . . . 151
7.2 Evaluation of Integrative Rule Learning on Microarray Data . . . 155
8 Visualisation of High-Dimensional Biological Data (VRMLGen) 161 9 Main Biological Contributions 167 10 Conclusions 174 10.1 General Summary and Discussion . . . 174
10.2 Outlook on Future Work . . . 178
11 Appendix 198 11.1 Glossary . . . 198
List of Figures
1.1 Overview of data and analysis types . . . 3
1.2 Modules and workflow of the data analysis framework . . . 9
2.1 Example inheritance pedigree . . . 17
2.2 The drug development pipeline . . . 19
3.1 Higher level analysis - overview . . . 23
3.2 Microarray data analysis workflow . . . 24
3.3 Example MA-plot . . . 26
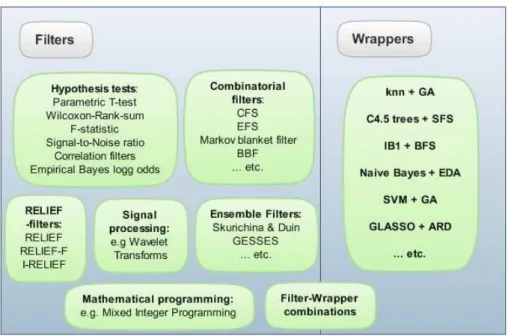
3.4 Overview of generic feature selection methodologies . . . 36
3.5 Bias/variance trade-off in statistical learning . . . 38
3.6 Example Markov blanket . . . 42
3.7 Overview of unsupervised learning methods . . . 49
3.8 Example heat map . . . 53
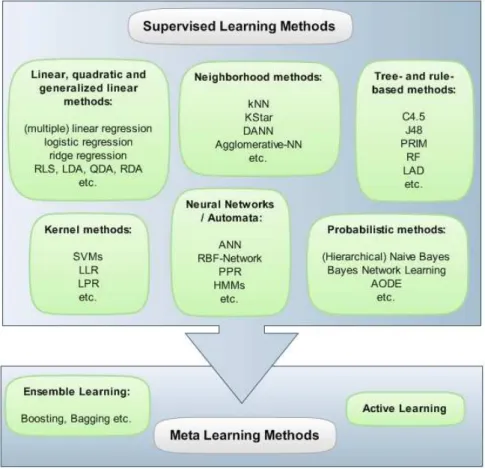
3.9 Overview of supervised learning methods . . . 60
4.1 Comparative algorithm evaluation - Experimental procedure . . . 79
4.2 B-cell lymphoma - 3D PCA visualisation . . . 81
4.3 Prostate cancer - 3D PCA visualisation . . . 81
4.4 Breast cancer - 3D PCA visualisation . . . 82
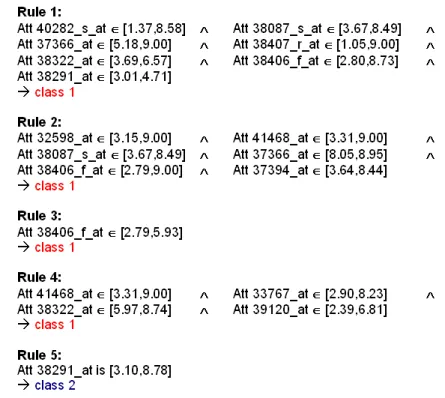
4.5 Example for a BioHEL classification rule set . . . 86
4.6 Prostate cancer - Rule-based sample assignment intervals . . . 95
4.7 B-cell lymphoma - Rule-based sample assignment intervals . . . 96
4.8 Visualisation of clustering results - Calinski-Harabasz index . . . 102
4.9 Visualisation of clustering results - kNN-Connectivity index . . . 105
4.10 Visualisation of clustering results - Silhouette plot . . . 106
4.11 Visualisation of clustering results - PCA plot . . . 106
4.12 Histogram of adjusted rand indices - VF dimensionality reduction . . . 107
4.13 Histogram of adjusted rand indices - GSA dimensionality reduction . . . 108
4.14 Principal Component Analysis - Breast cancer dataset . . . 109 viii
4.15 Independent Component Analysis - Breast cancer dataset . . . 109
4.16 Isomap Analysis - Breast cancer dataset . . . 109
4.17 Locally Linear Embedding - Breast cancer dataset . . . 110
5.1 ArrayMining: The main component of the integrative analysis framework . . . 113
5.2 ArrayMining - main interface . . . 118
5.3 ArrayMining: Example box plot visualisation . . . 119
5.4 ArrayMining: Example heat map visualisation . . . 119
5.5 VRMLGen: Example 3D-visualisation of an Independent Component Analysis . . . 121
5.6 Breast cancer gene co-expression network analysis . . . 124
5.7 Cross-study analysis - density plots . . . 125
6.1 TopoGSA, EnrichNet and PathExpand . . . 128
6.2 TopoGSA: Example cancer gene set analysis . . . 131
6.3 EnrichNet: Example Results (BioCarta RElA pathway) . . . 134
6.4 EnrichNet: Network visualisation (Sarcoma and Bladder cancer mutated genes) . . . 135
6.5 PathExpand: Visualisation of graph-based filtering criteria . . . 140
6.6 PathExpand: Semantic similarity analysis of protein annotations . . . 142
6.7 PathExpand: Extended Alzheimer’s pathway . . . 143
6.8 PathExpand: Crosstalk between interleukin signalling pathways . . . 145
6.9 PathExpand: Cell cycle G1/S check point sub-network . . . 146
7.1 Top-scoring pathway pair method . . . 150
7.2 TSPP: Overview of the workflow . . . 153
7.3 TSPP: Analysing differentially regulated pathway-pairs in a protein interaction network . . 159
8.1 VRMLGen: Main functions and features . . . 163
8.2 VRMLGen: Example visualisation of breast cancer microarray data . . . 165
8.3 VRMLGen: Example code for breast cancer data analysis . . . 165
9.1 New breast cancer marker gene RERG - Gene expression box plot . . . 169
9.2 SeedNet: Gene co-expression network visualisation . . . 172
11.1 ArrayMining - Example flowchart . . . 203
11.2 ArrayMining/TopoGSA - Example flowchart . . . 203
List of Tables
2.1 Genetic disorders and inheritance types . . . 17
2.2 Application of bioinformatics tools in biomedicine . . . 19
4.1 Datasets used for comparative evaluation . . . 80
4.2 Comparison of feature selection methods . . . 85
4.3 Parameters used for BioHEL . . . 88
4.4 10-fold CV classification results . . . 89
4.5 LOOCV classification results . . . 90
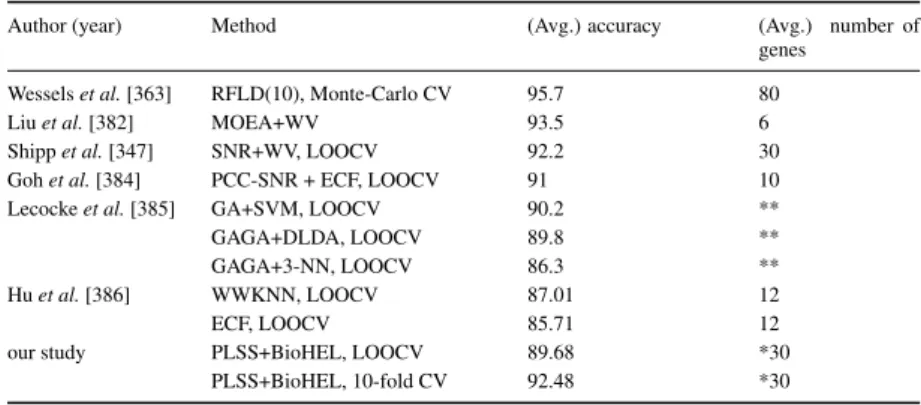
4.6 Comparison of prediction results from the literature (DLBCL dataset) . . . 91
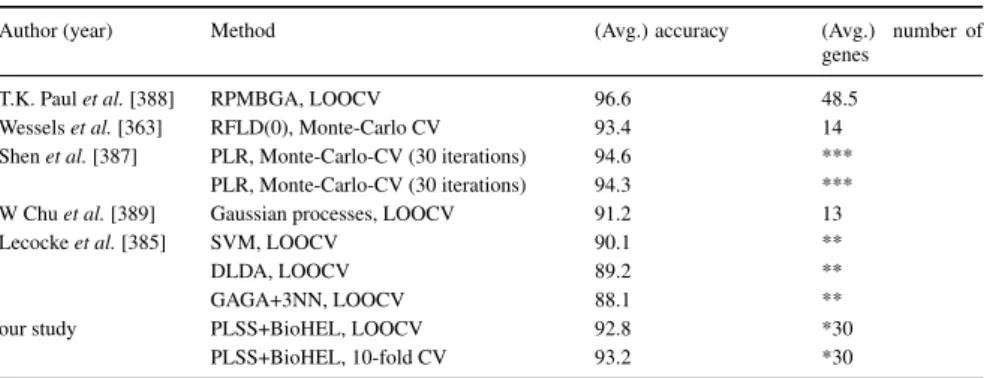
4.7 Comparison of prediction results from the literature (Prostate cancer dataset) . . . 92
4.8 Comparison of prediction methods (Friedman test) . . . 92
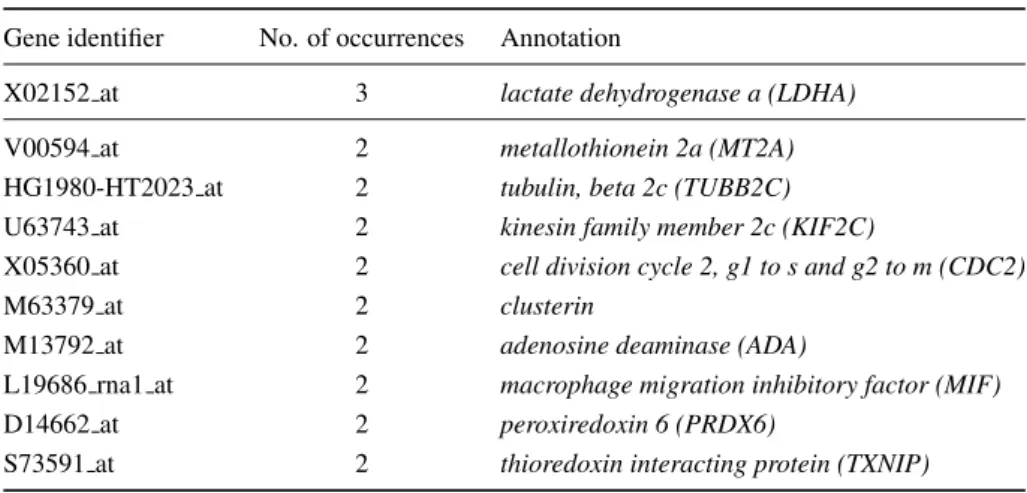
4.9 List of high scoring genes (Prostate cancer dataset) . . . 94
4.10 List of high scoring genes (DLBCL dataset) . . . 94
4.11 List of high scoring genes (Breast cancer dataset) . . . 97
4.12 Comparison of clustering methods (classical standardisation) . . . 103
4.13 Comparison of clustering methods (robust standardisation) . . . 104
6.1 PathExpand: Statistics on added proteins . . . 141
6.2 PathExpand: Topological properties of extended pathways . . . 142
6.3 PathExpand: Cellular processes enriched in pancreatic mutated genes . . . 148
7.1 TSPP: Leave-one-out cross-validation results (KEGG database) . . . 155
7.2 TSPP: Leave-one-out cross-validation results (GO database) . . . 156
7.3 TSPP: Leave-one-out cross-validation results (alternative method) . . . 156
7.4 TSPP: Top-ranked pathway pairs (Prostate cancer data) . . . 158
7.5 TSPP: Top-ranked pathway pairs (B-cell lymphoma data) . . . 158
Chapter 1
Introduction
Chapter abstractThis introductory chapter will provide a bird’s eye view of the goals behind the thesis and the data sources and methods used to achieve them. It will delineate the scope of the project and discuss in general terms how the work compares to and departs from previous biological data analysis and integration approaches. Finally, it will guide the reader through the different sections of the thesis and present a summary of the main results.
1.1
Background and Motivation
The spread of high-throughput technologies in the biosciences in recent years, including high-throughput sequencing methods, DNA and protein microarrays, has led to an exponential increase of public biolog-ical databases. The large amount of freely available data has raised hopes that researchers will in the long run be able to obtain a more holistic understanding of the molecular mechanisms in living cells by analysing complete gene-, protein- and metabolite networks, instead of considering their individual com-ponents separately. However, although the data from high-throughput experiments offers new opportunities for the biosciences, at the same time a multitude of new challenges arise from its typical characteristics: Large numbers of features in relation to small numbers of samples pose several problems in the statistical analysis, which have been extensively discussed in the literature under the headings “curse of dimension-ality” [1], “multiple testing” [2, 3] and “feature redundancy and dependence” [4, 5]. Moreover, with regard to a specific biological question of interest, the majority of features in a dataset might be irrelevant, hence, extracting only the informative sub-structures can be akin to finding the proverbial needle in a haystack. Additionally, single measurements within high-throughput experimental methods are often affected by dif-ferent types of noise, providing the experimenter only with scaled and shifted versions of the original signals and with outliers both among the samples and features. Apart from these problems affecting the statistical analysis and evaluation, various computational difficulties arise commonly, spanning from general issues concerning runtime complexity and memory management to data access efficiency problems in database and web-server applications.
In summary, the most prevalent problems and research questions that have emerged in the field of high-dimensional biological data analysis and which are addressed in this PhD are the following:
• “Curse of dimensionality” problem: How can robust clustering or supervised prediction results be attained for small sample-size datasets in which the number of features is by two orders of magni-tude larger than the number of samples (in particular, in the case of an approximately uniform data distribution [6])?
• Noise problem: How can genes, proteins or metabolites that are significantly differentially regulated across different biological conditions be reliably identified, if the expression values of a large pro-portion of genes/proteins/metabolites are masked or dominated by noise (with both technical and biological sources of noise)?
• Multiple testing problem: How can spurious rejections of a null-hypothesis be avoided effectively by reducing the dimensionality of the input data are or adjusting hypothesis tests to account for repeated hypothesis testing?
• Evaluation problem: Given that evaluation methods to estimate the generalization error of machine learning models tend to have limitations either in accurately estimating the variance or the bias on microarray datasets with small sample size [7], how should a reliable validation pipeline be built? • Methodological problem and “no-free-lunch” problem: Do any “methods of choice” exist for
mi-croarray data analysis, or which algorithms should be compared or combined to solve a specific analysis problem efficiently and effectively? If several methods have been shown to have different strengths and weaknesses on different datasets (e.g. datasets for different cancer types), how can a robust analysis system be built, attaining a high performance across many diverse datasets?
In order to address these statistical and computational challenges in the analysis of high-dimensional data, several new algorithms and data structures, tailored to specific analysis problems and experimental plat-forms, have been developed in recent years. However, using methods optimised for a single data source type does often not suffice to exploit the information content of multiple available datasets from diverse platforms and biological domains, or to reach the model accuracy and significance that might be obtained from combining the benefits of multiple search methodologies, scoring functions or data structures. In many areas of computer science and biology,integrative analysis methods, which combine different data sets and/or algorithms, have not only been shown to effectively increase robustness and accuracy of an anal-ysis but are often essential requirements to verify a given biological hypothesis, to obtain sufficiently robust prediction models or to solve a computational problem in a given time-frame. For example, in several appli-cations of statistics and machine learning, ensemble and consensus approaches, which exploit the synergies of diverse algorithms for the same problem type, provide significant improvements in terms of robustness and accuracy on large-scale datasets with high noise levels [8–13]. Similarly, at the data collection and pre-processing level, cross-study normalisation and data fusion techniques have been employed successfully to obtain more stable prediction models or clustering results [14–16]. However, especially the application of ensemble techniques, and in some cases also data integration methods, often tends to generate very com-plex biological models, lacking interpretability and sometimes even overfitting the data. Cross-platform normalisation methods often result in a significant loss of information due to the normalisation process, and the quality of the outcome highly depends on the size of the intersection set between the features of the considered input datasets [17]. Thus, the above list of problems to be addressed in high-dimensional biological data analysis has to be extended by the following challenges inintegrative data analysis:
• Cross-platform data integration problem: How can data sets obtained with different experimental platforms (for the same cell types and phenotypes) be combined, if the overlap in the measured
Figure 1.1: Overview of data and analysis types combined as part of integrative methods developed in this thesis to obtain a better understanding of biological processes of interest
features (e.g. genetic probes on DNA chips) is small and the experiments are affected by different systematic biases?
• General data integration problem: How can gene/protein expression data and other biological data sources, e.g. molecular interaction, genomic, epigenetic and metabolic data, be combined to obtain new insights or improve accuracy and robustness, while retaining a high level of interpretability? These challenges and the previously mentioned problems in large-scale biological data analysis provide the primary motivation for this thesis to investigate the potential of new integrative analysis techniques to obtain improvements in terms of classical performance criteria (e.g. prediction accuracy, adjusted rand index in clustering, model robustness), but at the same time also in terms of model interpretability and biological insights gained. Moreover, as the main contribution of this thesis, new cross-domain analysis methods will be presented, which combine both diverse data sources (gene/protein expression data, gene/protein set data, protein interaction data and cellular pathway data) and analysis types (statistics, network analysis, machine learning, literature mining). These novel integrative analysis techniques have been presented in dedicated publications and are discussed in separate chapters of this thesis. Figure 1.1 provides a general overview of the data and algorithm types considered as part of integrative biological analysis methods in this thesis. Molecular networks are shown as the central data type in this figure, because their common representation as graphs with nodes (corresponding to molecules) and edges (corresponding to molecular interactions) provides a suitable data structure to map other data sources onto a single graph-based model (with nodes corresponding to molecules and edges to associations). The other input data sources considered here, con-sisting of large-scale functional genomics data (e.g. gene/protein expression datasets), and clinical records and literature data, are typically only analysed by highly specialised algorithms. However, synergistic
ef-fects cannot only be attained by investigating multiple input data sources independently, with different dedicated analysis methods, and only interpreting their outputs together, but also by combining the analysis techniques directly, either in a modular fashion or by integrating them into new algorithms operating on a unified data structure for all biological inputs. Achieving these synergistic effects, while at the same time retaining a high level of model interpretability and facilitating the extraction of new biological knowledge, is the primary goal for this thesis. Details on the more specific objectives and the novel approaches to achieve them will be provided in the following sections.
1.2
Aims and Scope
The current limitations in the statistical power and interpretability of computational models built from high-dimensional biological data (see Background and Motivation section), motivate the main objective behind the research conducted for this thesis: Improving the statistical analysis of these datasets in terms of accuracy, robustness and interpretability by developing new integrative techniques to exploit the synergies of diverse data sources, algorithms and data structures.
The methods developed for this purpose will mainly be applied to the study of microarray gene expres-sion data, representing a prime example for the opportunities and challenges arising when analysing high-dimensional and noisy real-world data. Moreover, for the study of microarray data a multitude of datasets and algorithms are already publicly available, providing enough material for the comparison and combina-tion of datasets and algorithms within the analysis framework proposed in this thesis. In spite of this focus on a particular data type, most of the approaches presented here are equally applicable to protein expression data and other functional genomics data sources, and one chapter of this thesis will therefore be dedicated to the more general analysis of gene and protein lists obtained from any type of biological experiment (see chapter 6).
Similarly, the biological applications of the framework will focus on a specific range of problems, mostly associated with cancer biology, but examples for other biological problem types will be given to highlight the wide range of further potential applications. The choice of this biological focus is motivated by the expectation that due to the characteristics of complex genetic disorders and cancer diseases, which often depend on multiple genetic and epigenetic influences, the analysis of this data is particularly likely to benefit from integrative methods (see chapter 2 for details about the biological background and motivation behind this dissertation). Thus, the biological scope of the thesis is limited to biomedically relevant and representative example applications of the proposed integrative analysis methods, but at the same time seeks to provide researchers in related scientific fields with sufficient information to transfer methodological guidelines to their specific area of research.
Moreover, since the current restraints in the analysis of microarray gene expression data and similar large-scale data sources, which are addressed in this thesis, have already been tackled by previous methods, these will be discussed in detail in a literature survey as part of this thesis (see chapter 3). Due to the large number of published analysis techniques, especially for the study of microarray gene expression data, this survey will focus on state-of-the-art methods tailored to classical machine learning tasks (feature selection, prediction and clustering) and on previous integrative analysis approaches combining data from multiple biological sources (e.g. cellular pathway, molecular interaction and gene/protein expression data). These existing approaches from the literature already address several common problems in the analysis of high-dimensional biological data, but still have several limitations in terms of interpretability, robustness and
applicability to a wide range of platforms. Therefore, the main goals and characteristics of the integra-tive approach presented here, which differ from previous analysis and data integration systems, have been chosen as follows:
• Methods are presented to combinealgorithms and data types from diverse domains, in addition to employing cross-study normalisation methods to combine datasets of the same type, and ensem-ble/consensus methods to combine algorithms for the same problem
• Novelmodularcombinations of previously published approaches interconnect both single algorithms for specific analysis types and corresponding ensemble/consensus methods
• Different algorithms and different datasets are integrated in aunified approach, rather than consid-ering data fusion methods and ensemble/consensus approaches separately. In this context, unified means that instead of combining already existing analysis techniques based on diverse datasets in a modular or sequential fashion, new methods are developed that operate directly on all input data sources by exploiting different data representations, search methodologies and scoring functions com-bined in a single algorithm.
• Instead of focussing only on maximising accuracy and robustness, the methods are designed to create compact and human-interpretable models (maximising interpretability and accuracy/robustness at the same time)
• Wherever possible, data analysis and parameter selection tasks areautomated in order to provide non-expert users with a simple way to access and configure the methods within the framework and combine them to a valid statistical analysis pipeline (in most cases using an installation-free, operating system independent and web-based interface)
• Interactivemeans to explore the data and statistical results from analysis, including navigable low-dimensional data visualisations and sortable tables with dynamic and expandable content, are embed-ded into the implementation of the framework
The last three aspects, which are all related to model interpretability, knowledge management and ease-of-use, are realized by integrating automatic parameter selection methods, visualisation methods and various approaches for enhancing model interpretability into the framework. These include automatic dimension-ality reduction and feature selection methods, automatic model parameter selection using penalty terms for model complexity, and novel self-devised rule-based classification methods generating small sets of deci-sion rules. Moreover, automatic methods to handle class imbalances among the samples and redundancy among the input features, and an automatic analysis of the statistical properties of features in ensemble methods are part of the framework.
In addition to these functions and features provided for single analysis modules addressing a specific anal-ysis type (gene selection, clustering, prediction, gene set analanal-ysis, etc.), different analanal-ysis types are also linked together within the framework, providing multiple possibilities to forward the output from one anal-ysis module to another. Correspondingly, to increase the impact and extend the framework’s range of applications, its modules can also exchange data with external web-services, including the “Gene Cards” web-server by the Weizmann Institute of Science and the “Gene Expression Omnibus” (GEO) data repos-itory by the National Center for Biotechnology Information (NCBI). A further benefit of adopting a very modular approach is that, although it requires more time for the initial implementation, it will facilitate extensions of the framework in the future.
In summary, the two main motivations behind this thesis are to exploit the synergies of different infor-mation sources, both from the biological input data and from inforinfor-mation extracted by different analysis methods combined to an ensemble or consensus, and to enhance the interpretability of the resulting models. Throughout the thesis, the methods employed to achieve these general objectives will not only be applied on classical benchmark datasets for performance evaluation but also on novel real-world datasets to solve specific biological problems, analysed in collaboration with external research groups.
1.3
Thesis Organisation
This thesis will first provide the reader with a background on data mining methods for high-dimensional bi-ological datasets and some of their most important bibi-ological applications, and then present new integrative analysis methods and techniques to increase model interpretability. Therefore, the dissertation is grouped into the following chapters (excluding this introductory chapter):
Chapter 2 describes the biological background for this dissertation and the main applications for the bioin-formatics methods developed as part of the PhD. It will present some of the main analysis tasks in the study of genetic disorders and cancer diseases, and then explain why there is a need for novel integrative “Systems Biology” approaches. The specific challenges that have to be addressed will be discussed, as well as the opportunities that integrative approaches provide for improvements. Chapter 3 contains a literature review about current methods for (low-level) pre-processing and
normali-sation and (high-level) computational analysis of high-dimensional biological data, with a focus on integrative analysis techniques, including ensemble, consensus and cross-domain analysis methods. In this context, microarray gene expression data will be discussed in particular detail as a prime example for noisy, high-throughput experimental data. The review will start with an overview of classical machine learning analysis approaches (feature selection, classification and clustering) and then present extensions obtained by employing ensemble, consensus and data integration methods. Chapter 4 contains a comparative evaluation of algorithms for the classical machine learning tasks feature
selection, prediction and clustering on high-dimensional microarray gene expression data. Three different types of algorithms are considered in this comparison: a) single algorithm based classical machine learning methods (e.g. support vector machines for classification), b) ensemble classification and consensus clustering methods, and c) integrative methods using cellular pathway data in addition to the microarray data.
Chapter 5 discusses the main component of the integrative data analysis framework developed in the PhD project: TheArrayMining.net[18] tool set and web-application for microarray data analysis, con-sisting of six analysis modules forGene Selection(feature selection),Class Discovery(clustering), Class Assignment(prediction),Gene Set Analysis,Co-Expression Network AnalysisandCross-Study normalisation. Each module contains multiple algorithms, which can be compared and/or combined, and additionally, different modules are interlinked to enable cross-domain integrative analyses (e.g. Gene Set Analysis combined with Class Discovery Analysis). Although this tool set is applicable to many high-dimensional biological datasets, example applications shown in this chapter will focus on the analysis of gene expression cancer datasets, which led to the discovery of a novel, experimentally validated breast cancer marker gene [19].
obtained from an experiment. As further data sources, public molecular interaction data and cellular pathway definitions are used within these tools. Specifically,TopoGSA[20], a web-application for network topological analysis of gene and protein lists,EnrichNet[21], a web-server and algorithm for network-based functional enrichment analysis, andPathExpand[22] an algorithm for extending cellular pathway definitions using molecular interaction data will be presented, as well as modular combinations with other tools from the framework.
Chapter 7 is dedicated to a new integrative rule learning method for increasing the interpretability of machine learning models for biological systems. This approach, termedTop-scoring pathway pair (TSPP)algorithm [23], relies on cross-domain data fusion, evolutionary learning and the extraction of robust classification rules representing relations between the gene expression values in pairs of cellular pathways. It generates compact sample classification models consisting of a combination of easily interpretable decision rules.
Chapter 8 presents a software package for low-dimensional visualisation and interactive exploration of biological data,VRMLGen[24], which is used in different modules of the integrative analysis frame-work. VRMLGen generates interactive, web-based 3D data visualisations that are specifically tai-lored towards the analysis of biological data, integrating functional annotation data into the plots, highlighting regions of high data density, and interlinking data points with information from external biological databases.
Chapter 9 will summarise the main biological results of the PhD project, including the identification of an experimentally validated breast cancer marker gene, the proposal of candidate disease genes based on computationally extended disease pathway definitions, and the prioritization of putative associations between cancer mutated genes, cellular pathways and different disease processes.
Chapter 10 will provide a concluding summary and general discussion of the novel methods and results presented in the thesis, as well as an outlook on possible future work.
1.4
Methodology
In order to obtain significant, biologically relevant and reproducible results, a methodology consisting of multiple preparatory steps, and following widely accepted standards and guidelines during the development of the data analysis and evaluation pipeline was employed for this project.
First, a survey of the relevant literature was conducted to identify knowledge gaps and promising target applications and methods within the field of large-scale biological data analysis for the development of novel analysis approaches that significantly complement or extend existing algorithms and procedures. An updated version of this survey is also part of this thesis (see chapter 3).
While studying the literature, several high-dimensional microarray datasets were collected, including bench-mark datasets, recently published real-world datasets and data from collaborating institutes. These datasets were used to compare current feature selection, clustering and classification methods by setting up an eval-uation pipeline, consisting of multiple widely recognized performance measures and cross-validation meth-ods (e.g. using external cross-validation with nested cross-validation parameter optimisation [25] for classi-fication and multiple cluster validity indices for clustering). A comparative evaluation of machine learning methods using this pipeline is part of this dissertation (see chapter 4).
This preparation and new ideas gathered while studying previous methods helped to design a framework and implement corresponding software modules to combine previous machine learning and other data analysis methods using new ensemble learning and consensus clustering techniques, and to explore new modular combinations between analysis types. The analysis pipeline and software was designed in a manner that would allow biological scientists and clinical practitioners without previous background in computer sci-ence to apply the methods easily to their data, using a platform-independent web-application, automatic parameter selection mechanisms, and simple, interactive interfaces and visualisations to explore the results. More importantly, users have the possibility to both apply classical machine learning methods they might already be familiar with, but also to compare and combine them with new methods. As the central compo-nents of the framework, several new integrative analysis approaches were developed, which combine both diverse algorithms and datasets, using unified graph-based representations of data from multiple biological sources. Finally, in addition to the data pre-processing and analysis modules implemented for this frame-work, several statistical methods for evaluation purposes and to improve the interpretability of the obtained models were integrated into the analysis system.
To promote data exchange and prevent the framework from becoming an isolated system, the software was interlinked with a multitude of external public data repositories and complementary analysis systems (Gene Cards [26], GEO [27], ENSEMBL [28], DAVID [29], Gene Ontology [30], KEGG [31], and BioCarta [32], among others).
Since one of the main goals of the doctoral project was to develop software of direct practical utility for the biosciences, the data analysis system was also employed for the analysis of several current real-world datasets in co-operation with different partner institutes, focussing mainly on applications in cancer biology. Specifically, collaborations were set up with the Spanish National Cancer Institute (CNIO, Madrid, Spain), the Weizmann institute of Science (Rehovot, Israel), the Queens Medical Centre, the School of Veterinary Medicine and the Institute of Neuroscience at Nottingham University. These institutes provided access to new data to address current research questions of biomedical relevance.
Thus, this plan to build an integrative analysis framework, evaluate different methods and obtain relevant data to approach specific analysis problems provided the foundation for the milestones of the doctoral project, which are reflected by the structure of this thesis and which were pre-defined in advance and monitored throughout the entire duration of the project in regular meetings and progress reports.
1.5
Main Results
This final introductory chapter will provide an overview of the most important results obtained from the doctoral project, including the implemented software packages and web-applications, the publications and the main biological results. Detailed discussions of all the software tools and biological contributions will be provided in dedicated chapters (see chapters 4 to 8).
1.5.1
The integrative analysis framework
The central result of the project is a software and algorithm framework for integrative analysis of large-scale gene and protein expression data and general gene/protein lists, consisting of multiple interlinked analysis modules, illustrated in figure 1.2.
Figure 1.2: Modules and workflow of the integrative data analysis framework presented in this thesis: The ArrayMin-ingsystem for integrative microarray gene expression analysis (top right, consisting of a Gene Selection, Class Dis-covery, Class Prediction, Gene Set Analysis, Network Analysis and Cross-Study normalisation module), the PathEx-pandmethod for integrative cellular pathway and molecular interaction data analysis (centre), theTop-scoring Pathway Pairs (TSPP)method combining pathway definitions and gene/protein expression data (centre), the network-based enrichment analysis methodEnrichNet (centre right), theVRMLGensoftware package for creating interactive low-dimensional visualisations of biological (centre right) and the network topological analysis method,TopoGSA(bottom right). Modules containing new methods are highlighted by a star symbol, and new pipelines are indicated by dotted lines.
Each module provides access to multiple algorithms for an analysis task, enabling users to compare and/or combine them using novel ensemble or consensus techniques. The modules enable the integration of ex-ternal biological data, including functional annotation data, cellular pathway definitions and molecular in-teractions, into the analysis, and can be combined sequentially into different user-configured cross-domain analysis pipelines. Automatic parameter selection and optimisation mechanisms, the generation of compact rule-based models, and interactive means to visualise, explore and statistically analyse the results obtained from an algorithm, facilitate the usage of the software and the interpretation of the data.
Different components of this framework have been developed as independent software projects and pre-sented in dedicated publications. The main component is the ArrayMining.net [18] tool set and web-application for DNA- and protein-microarray data analysis, which is freely available on the internet since February 2009, and has been accessed more than 31,000 times by more than 10,000 users. It consists of six analysis modules (see the large blue boxes “Microarray input data” and “ArrayMining Analysis Modules” in figure 1.2) for combining datasets from different microarray studies (Cross-Study normalisation), classical machine learning tasks (Feature Selection, Clustering and Classification) including ensemble and consen-sus methods, and new integrative and specialized analysis methods (Gene Set Analysis and Co-Expression Analysis). Additionally, these modules are interlinked with the other algorithms in the framework and external data repositories and web-services. ArrayMining.net will be discussed in detail in chapter 5. A further component for microarray data analysis in the framework is the self-devisedTop-scoring path-way pairs(TSSP, [23]) algorithm, which integrates cellular pathway information into the machine learning analysis of gene expression data to identify compact and easy-to-interpret decision rules for sample classi-fication (see details in chapter 7).
Two other integrative framework tools, which also exploit information from pathway definitions and addi-tionally make use of molecular interaction networks, are the new algorithmPathExpand[22], which extends pathway definitions using a graph analysis on protein-protein interaction data, andEnrichNet[21], an ap-proach to enhance classical functional enrichment analysis, estimating the significance of the functional association between pairs of gene/protein sets using distance information from molecular networks (see chapter 6).
The combined information content from interaction network and pathway data is also exploited by the web-applicationTopoGSA[20], which maps a gene or protein set provided by the user to a molecular network for the corresponding species and analyses its topological properties in comparison to gene/protein sets representing known cellular processes, complexes and functional annotations (see chapter 6). Although En-richNet and TopoGSA are not designed to make use of expression level measurements from gene or protein expression data, these methods have a significantly wider applicability than the microarray-related analysis modules, and can be employed to investigate gene/protein sets obtained from any biological experiment or bioinformatics analysis in more detail.
In order to keep pace with recent developments, the framework additionally provides a method to analyse the most recent and accurate type of large-scale gene expression data, RNA sequencing data. This software, RNAnalyze[33], which has also been made available as a web-application, combines the information from multiple gene selection methods within a gene set enrichment analysis approach.
Finally, methods for web-based interactive data exploration and low-dimensional visualisation are used within multiple components of the framework, and have also been published in a dedicated software pack-age,VRMLGen[24].
1.5.2
Collaborative project results
Using combinations of the software tools within the framework, a wide range of biological analyses have been conducted in collaboration with external institutes. One of the key results was obtained in co-operation with the department of Histopathology at theQueens Medical Centrein Nottingham, using the gene set analysis, ensemble feature selection and classification methods in ArrayMining to analyse data from a large-scale microarray cohort study with samples from 128 breast cancer patients. In this pre-clinical study a new candidate marker gene for a special breast cancer tumour subtype (the oestrogen-receptor positive luminal-like subtype) was identified and experimentally validated by immunohistochemistry using tissue microarrays. A dedicated manuscript, proposing the corresponding human geneRERG(“Ras-related and oestrogen-regulated growth inhibitor”) as a new tumour marker, has recently been published [19].
A second cancer-related project, implemented in co-operation with theSpanish National Cancer Institute (CNIO, Madrid) during a three-months secondment in Madrid, analysed sets of human genes known to be mutated in more than 30 different cancer types using the tools PathExpand, TopoGSA and EnrichNet from the framework. By combining molecular network and cellular pathway data, as well as the lists of cancer-mutated genes, several disease-related pathways enriched in these genes were extended using the PathExpand tool, and enrichment in cancer-mutated genes was also detected among the genes added by the extension procedure [22]. Applying these analyses to cellular disease pathways enabled the proposal of new putative disease genes, e.g. for Alzheimer’s disease the prediction of two candidates was corroborated by previously published experiments.
In a related study, the complete set of known human cancer genes [34] was analysed with respect to its topological properties when mapped to a molecular network using the TopoGSA tool. After assembling a large-scale human protein interaction network in collaboration with the CNIO and mapping the genes onto the network, TopoGSA determined their topological properties (e.g. their centrality and their tendency to form clusters) and compared them to known gene sets representing cellular processes, complexes and func-tional annotations. The final results revealed that cancer genes have markedly distinct topological properties in comparison to gene sets representing metabolic and regulatory processes, even after accounting for bi-ases resulting from the inclusion of small-scale studies in the construction of the interaction network [20]. To extract further information on cancer gene set associations from molecular network data in a follow-up project, the EnrichNet approach and web-application [21] was developed, as an extension of classical func-tional enrichment analysis. In contrast to existing methods, which assess the significance of the overlap between the datasets (e.g. using the Fisher exact test) or compute the enrichment of “true positive” disease genes among an experimentally derived ranking list of candidate disease genes (e.g. using the Kolmogorov-Smirnov test), the EnrichNet approach makes use of network distance information to obtain more sensitive estimates of the functional associations (see a detailed discussion in chapter 6). Both EnrichNet and To-poGSA have been interlinked with the GeneCards web-service from the co-operating Weizmann institute of Science (Rehovot, Israel) and used several hundred times by external visitors on the web.
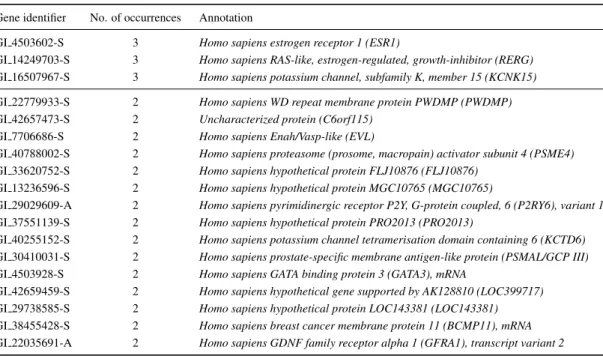
Apart from these ongoing co-operations, various short-term biomedical research projects have been con-ducted based on software from the framework. In a three-month collaborative project with theSchool of Veterinary Medicineat Nottingham University, funded by the “Bridging the Gaps” initiative, microarray analysis methods from the framework and various literature mining tools were combined to compare gene expression samples from horse cartilage tissue under different drug treatments against arthritis. The goal was to study the drug effect on a molecular basis, in order to develop more targeted therapies in the future. To maximise the robustness and accuracy in the ranking of genes in terms of their differential regulation
across diverse treatment types, special analysis methods exploiting per-gene replicate measurements on the microarray chips were used and information from the literature was integrated into the analysis. This methodology provided a set of 17 high-confidence target genes for further study of the cellular response to drug treatment (the majority of which had previously been implicated in arthritis).
Similarly, in a still ongoing co-operative study with theInstitute of Neuroscienceat Nottingham University, the effects of nicotine on the brain were analysed using gene expression data and rat brain cells as an animal model, ensemble feature selection methods from the framework were employed to identify the genes with the most significantly differential expression profiles in the nicotine and control samples.
A central part of the integrative analysis framework is dedicated to network analysis methods, including the Gene Co-Expression Network Analysis module in ArrayMining, which builds a network of genes (repre-sented as nodes), which are connected by edges if the corresponding gene expression values are significantly correlated. This module was used in collaboration with theDivision of Plant and Crop Sciencesat Not-tingham University, to generate a genome-wide network model describing transcriptional interactions in dormant and germinating seeds, in the model plant organismArabidopsis thaliana. The model enabled the prediction of genes regulating the plant germination process with higher accuracy than previous alternative methods. To allow external researchers to explore this data using their own query gene set, an interactive network visualisation was developed and made publicly available on the web [35].
As part of the above projects, a new web-based 3D-visualisation software to inspect low-dimensional rep-resentations of high-dimensional biological datasets was implemented additionally, to enable direct visual inspection of the results for different analyses online. This software package, “VRMLgen”, enables users to create interactive scatter plots, bar charts and 3D mesh visualisations in web-ready formats, and interlinks biological features (e.g. gene and protein names) in the data via hyperlinks with public biological databases. VRMLGen has been presented in a dedicated publication [24] and as an open-source software package in the “Comprehensive R Archive Network” (CRAN,http://cran.r-project.org).
Finally, in addition to the biological applications of the algorithms and software tools developed in this PhD project, some of the machine learning methods were also used to enter different data mining competitions. By participating in these competitions, the performance of the ensemble machine learning methods on the ArrayMining.net prediction server could be evaluated against a large number of other recent methods in a fair and unbiased setting. In the KDD Cup 2009 machine learning competition (http://www.kddcup-orange.com), among the 4921 complete valid entries from 465 entrants the best-performing ensemble method developed during the PhD was ranked 53rd in the ”Slow Track” category. In a smaller data-mining competition dedicated specifically to microarray analysis, the RSCTC Discovery Challenge 2010, the auto-matic ensemble learning approach was ranked 26th out of 100 participants, with an average classification accuracy across six data sets within 3% of the three top-ranked methods in the competition. These rankings suggest that automated ensemble prediction methods can achieve competitive accuracies in relation to other state-of-the-art approaches.
In summary, the results of this thesis highlight the benefits of ensemble, consensus and cross-domain inte-grative analysis methods both for classical machine problems and new biology-inspired analysis and mod-elling tasks, and cast light on the obstacles that have to be overcome to exploit these opportunities. Detailed background information, methodological and biological results and critical method comparisons will be provided in the next chapters.
1.5.3
Software tools and web-applications
ArrayMining: A web-server for ensemble and consensus analysis of mi-croarray data, www.arraymining.net (BMC Bioinformatics, 2009, accessed more than 31,000 times, as of January 2011), interlinked with Gene Cards [26], DAVID [29], GEO [27], KEGG [36] and Gene Ontology [30]
TopoGSA: A web-tool for comparative network topological analysis of gene sets, www.infobiotics.net/topogsa (Bioinformatics, 2010, accessed more than 2,900 times, as of January 2011), interlinked with Gene Cards [26], KEGG [36], BioCarta [32], Reactome [37] and Gene Ontology [30] TSPP: A software using pairwise relations between pathway expression fin-gerprints for supervised classification of microarray sample classification (German Conference on Bioinformatics, 2010)
VRMLGen: A software package in R for 3D-visualisation of high-dimen-sional biological datasets on the web,http://cran.r-project.org/web/ packages/vrmlgen(Journal of Statistical Software 2010)
PathExpand: A visualisation of network representations of extended cellu-lar pathways and processes, www.infobiotics.net/pathexpand (BMC Bioin-formatics and RECOMB Computational Cancer Biology Workshop 2010)
SeedNet Online: An interactive gene co-expression network visualisation to investigate transcriptional interactions between dormant and germinal Ara-bidopsis thalianaseeds (Proc. Natl. Acad. Sci. USA 2011)
EnrichNet: A web-application for network-based gene set enrichment anal-ysis, www.infobiotics.net/enrichnet (manuscript in preparation), interlinked with Gene Cards [26], KEGG [36], BioCarta [32] and Gene Ontology [30] RNAnalyze: A web-server for gene set enrichment analysis of RNA sequenc-ing data (manuscript in preparation), interlinked with KEGG [36] and Gene Ontology [30]
1.5.4
Publications
[1]E. Glaab, J.M. Garibaldi, and N. Krasnogor. ArrayMining: a modular web-application for microarray analysis combining ensemble and consensus methods with cross-study normalisation.BMC Bioinformatics, 10(1):358, 2009.
[2]E. Glaab, A. Baudot, N. Krasnogor, and A. Valencia. TopoGSA: network topological gene set analysis. Bioinformatics, 26(9):1271–1272, 2010.
[3]E. Glaab, A. Baudot, N. Krasnogor, and A. Valencia. Extending pathways and processes using molec-ular interaction networks to analyse cancer genome data, 2010. BMC Bioinformatics(BioMed Central designation:highly accessed, RECOMB Computational Cancer Biology 2010), 11(1):597, 2010.
[4]E. Glaab, J.M. Garibaldi, and N. Krasnogor. Learning pathway-based decision rules to classify mi-croarray cancer samples. In D. Schomburg and A. Grote, editors,German Conference on Bioinformatics 2010, volume 173 ofLecture Notes in Informatics, pages 123–134. Gesellschaft fuer Informatik, 2010.
[5]E. Glaab, J.M. Garibaldi, and N. Krasnogor. vrmlgen: An R package for 3d data visualisation on the web. Journal of Statistical Software, 36(8):1–18, 2010.
[6] H. O. Habashy, D. G. Powe, E. Glaab, N. Krasnogor, J. M. Garibaldi, E. A. Rakha, G. Ball, A. R. Green, C. Caldas, and I. O. Ellis. RERG (Ras-related and oestrogen-regulated growth-inhibitor) expression in breast cancer: A marker of ER-positive luminal-like subtype. Breast Cancer Research and Treatment, 128(2):315–326, 2011.
[7] G. W. Bassel, H. Lan,E. Glaab, D. J. Gibbs, T. Gerjets, N. Krasnogor, A. J. Bonner, M. J. Holdsworth, N. J. Provart. A genome-wide network model capturing seed germination reveals co-ordinated regulation of plant cellular phase transitionsProc. Natl. Acad. Sci. USA, 108(23):9709–9714, 2011.
[8]E. Glaab, J. Bacardit, J.M. Garibaldi, and N. Krasnogor. Using rule-based evolutionary learning for candidate disease gene prioritization and sample classification of cancer gene expression data (in prepara-tion, title might change).
Please note: Terms which appear underlined when they first occur in the thesis are defined in the glossary (see Appendix at the end of this dissertation). Moreover, paragraphs which are highlighted by a blue vertical stripe (see example on the left) contain key messages of the corresponding chapters.
Chapter 2
Biological Background and Fields of
Application
Chapter abstract
The development of new high-throughput technologies in the biosciences in recent decades, including High-Throughput-Sequencing (HTS), DNA and protein microarrays, has provided the scientific community with almost complete genome sequences for several species and a multitude of transcriptome, proteome and metabolome datasets for diverse cell types under nu-merous biological conditions of interest. This enormous amount of publicly available data has raised hopes that researchers will in the long run be able to obtain a more holistic understanding of the molecular mechanisms in living cells, especially under disease conditions, by analysing complete gene-, protein- and metabolite networks and not only their individual components. These new possibilities have led to the establishment ofsystems biologyas a novel scientific discipline, aiming at a holistic interpretation of interactions within biological systems. This discipline is also accompanied by a novel scientific methodology,discovery science, in which the discovery process, including hypothesis formation, is automated to a great extent and op-erates on large volumes of data. This development can be seen as a complement to classical reductionism, “the practice of describing or explaining a complex phenomenon in terms of relatively simple or fundamental concepts, especially when this is said to provide a sufficient description or explanation” (Oxford English Dictionary, 3rd edition, 2009). Importantly, re-ductionism does not neglect the interactions between the different components of a systems, but enables the filtering of variables, while still providing explanations for some system-wide properties.
This chapter will provide an overview on some of the most important biomedical applications and challenges for systems biology based bioinformatics approaches. It will briefly describe genetic disorders and cancer diseases which are difficult to treat partly due to their complex systemic properties and influences, and explain how new large-scale data sources enable a more comprehensive and rapid biomarker discovery and drug target screening. More importantly, the final section of this chapter will discuss how these data analysis tasks can profit from novel network-based systems biology approaches and integrative analysis techniques. In combination with the literature survey on classical machine learning methods and novel integrative data
mining approaches (see chapter 3), this overview will provide the background and motivation for the new integrative bioinformatics approaches presented in this dissertation.
2.1
Genetic Disorders and Cancer Diseases
Diseases with genetic components cover a multitude of malignancies and genetic disorders. Hereditary single gene disorders alone account for more than 4000 different human diseases, and although cancer is often referred to as a single condition, more than 200 different cancer diseases exist, differing in terms of the affected organs and tissue types [38]. While most genetic disorders are mainly hereditary diseases and occur relatively rarely (affecting one individual in several thousands or millions), cancer diseases are frequently caused by environmental factors and often occur spontaneously. They also belong to the main causes of deaths, with 13% of all world-wide human deaths in 2007 resulting from cancer [39]. Importantly, although people at all ages can be affected by cancer, the risk tends to increase with age [40]. Given an aging population in industrialised countries and a lack of causative treatments against cancers, the search for effective therapies is therefore growing in significance.
In this section a brief overview of diseases with genetic components will be given, focussing on current ther-apeutic approaches and their limitations. The next sections will discuss how new bioinformatics methods for rapid identification of drug targets, virtual drug screening and rational drug design, as well as integrative systems biology analysis approaches can help to overcome some of these limitations.
In general, genetic disorders can be grouped intosingle gene disorders, resulting from a single mutated gene, andmultifactorialorpolygenic disorders, which are associated with multiple genes, as well as external environmental factors.
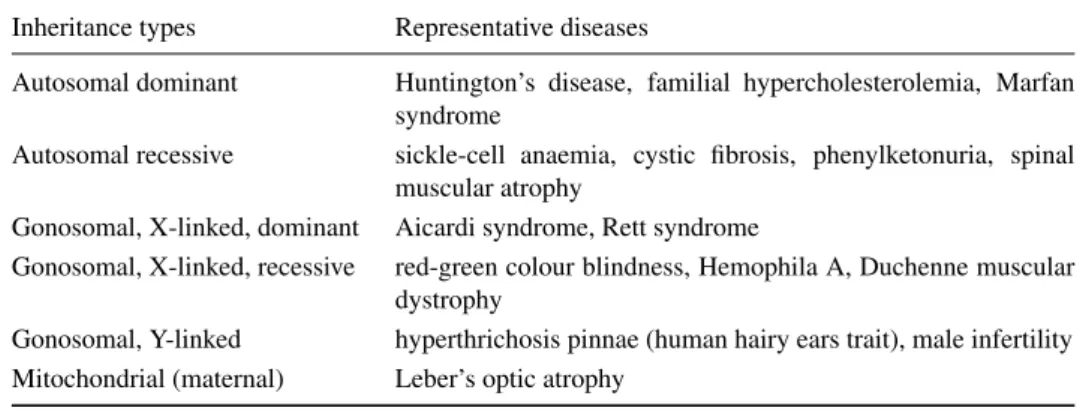
Single gene disorders are mostly inherited diseases with a multitude of possible inheritance patterns, some-times affected by epigenetic influences like genomic imprinting [41] (e.g. silencing of an allele by CpG-methylation of the corresponding promotor region). Generally, the inheritance patterns can be grouped into recessive and dominant patterns, depending on whether the corresponding trait needs to be expressed on two alleles (recessive) or only one allele (dominant) to determine the final phenotype (special cases of co-dominant and semi-co-dominant diseases, where both alleles have the same influence on the phenotype, exist additionally). Moreover, inheritance patterns can be distinguished according to whether the corresponding gene is located on an autosomal or gonosomal (i.e. sex-linked) chromosome. Prominent examples for dif-ferent single gene disorders and their inheritance patterns are shown in table 2.1. An example inheritance pedigree for an autosomal dominant disease is shown in figure 2.1.
For most of these diseases, the precise genetic cause is well-known, e.g. an extension of a nucleotide sequence region rich in CAG-repeats in the Huntingtin gene is known to cause Huntington’s disease, but a causative treatment would require the development of a new gene therapy. However, bioinformatics data analysis approaches can support the development of cheaper and more sensitive and specific methods for diagnosis, prognosis and disease progression monitoring, and the identification and design of new drugs. Interestingly, although most of these disorders have a relatively low prevalence of one in a few thousand of cases and affected carriers would be expected to have a selective disadvantage, these genetic diseases have not disappeared over thousands of years [42]. A likely reason for this long survival of low-prevalence genetic diseases is that some disorders can also endow carriers with a selective advantage, e.g. heterozygous carriers of sickle-cell anaemia have an increased resistance against malaria [43].
Figure 2.1: Example inheritance pedigree for an autosomal dominant disease with only one heterozygous carrier of the disease in the parental generation, resulting in a 50% chance for members of the first filial generation to carry the disease (source: U. S. National Institutes of Health).
Table 2.1:Overview on genetic inheritance types and representative single-gene genetic disorders
Inheritance types Representative diseases
Autosomal dominant Huntington’s disease, familial hypercholesterolemia, Marfan syndrome
Autosomal recessive sickle-cell anaemia, cystic fibrosis, phenylketonuria, spinal muscular atrophy
Gonosomal, X-linked, dominant Aicardi syndrome, Rett syndrome
Gonosomal, X-linked, recessive red-green colour blindness, Hemophila A, Duchenne muscular dystrophy
Gonosomal, Y-linked hyperthrichosis pinnae (human hairy ears trait), male infertility Mitochondrial (maternal) Leber’s optic atrophy
However, complex, multifactorial disorders like the majority of cancers are much more widespread than the above single-gene disorders. Importantly, multifactorial or polygenic disorders also include many diseases which are not commonly associated with genetic disorders, e.g. heart disease, obesity, asthma, hyperten-sion, inflammatory bowel disease and multiple sclerosis, which are often only partly influenced by genetic pre-dispositions and partly by environmental and lifestyle factors. The complexity of these diseases results both from the involvement of multiple genes in the disease and from the fact that defects in different genes and proteins can result in similar deregulations of a cellular pathway or process.
In spite of the detailed knowledge available for many genetic disorders, for most of these diseases with genetic components currently no cure exists and most therapies only attempt to reduce the severity of the symptoms. For the future, scientists hope to develop somatic gene therapies [44], which compensate the effect of mutated genes by inserting copies of the non-mutated gene into the genome of affected cells (without affecting any germ cells for ethical reasons). However, several obstacles have to be overcome until such gene therapies will become feasible. An effective therapy would not only require a targeted delivery of the corresponding gene’s DNA to many affected cells, but also the integration of the DNA carrier into these cells and into the cell nucleus, the controlled release of the DNA and the integration into the genome. Although many DNA viruses operate similarly and integrate their DNA into the genome of the host cell, the uncontrolled replication of viruses might rather represent a risk to the host organism than an opportunity for a new gene therapy. Thus, there is a need for new, controlled drug delivery systems, a better understanding of complex polygenic diseases and a new rapid drug target identification and rational drug design process. Bioinformatics methods can assist biological and clinical researchers both in improving the basic under-standing of genetic disorders, and developing diagnosis systems and therapies for these diseases usingin silicoidentification of new drug targets and techniques for rapid virtual drug screening, computational drug design and optimisation of given drug lead structures. The next section will discuss techniques for discov-ering biomarkers, which are useful for disease diagnosis and monitoring, as well as methods for predicting the disease subtype and the long-term prognosis.
2.2
Biomarker Discovery and Outcome Prognosis
Classically, biomarkers are blood tests which measure the abundance of a protein that reflects the presence and progression of a certain disease state, e.g. the presence of an antibody can point to an infection [45, 46]. However, biomarkers can also be genes, RNA, cells, enzymes, hormones or other molecules (also known as “molecular biomarkers”), imaging biomarkers (MRI, CT, PET), and even a classic laboratory parameter like the body temperature can be regarded as a simple biomarker, e.g. for fever. Biomarkers are used for monitoring the progression of a disease, but more importantly, they can also be used for the early detection of a disease or disease risk. Early diagnosis is vital for the effective treatment of many diseases, espe-cially cancers, because prior to metastasis tumours which are confined to one location can often be removed completely. Without biomarkers, early and reliable disease detection is often impossible, because several diseases like rheumatoid arthritis and Alzheimer’s start with a symptom-free phase [47, 48]. Similarly, if biomarkers are used as a risk indicator for a disease, they can assist even in preventing the onset of a dis-ease completely (“preventive medicine”), e.g. monitoring cholesterol levels can help to prevent coronary diseases [49]. Moreover, biomarkers are particularly important tools for a morepersonalised medicine, enabling doctors to adjust biomedical decision making to an individual’s specific disease state by obtain-ing a molecular portrait of the individual (“molecular profilobtain-ing”), improvobtain-ing the diagnosis and tailorobtain-ing the
treatment plan and therapy to the individual. In drug development, biomarkers can promote the identifica-tion of new disease targets, and both directly and indirectly the improvement of drugs and design of novel ac
![Figure 4.3: 3D visualisation of the first three principal components of the prostate cancer dataset (created using the VRMLGen software [24], see chapter 8).](https://thumb-us.123doks.com/thumbv2/123dok_us/767825.2597121/92.892.328.634.650.1011/figure-visualisation-principal-components-prostate-dataset-vrmlgen-software.webp)
![Figure 4.4: 3D visualisation of the first three principal components of the breast cancer dataset (created using the VRMLGen software [24], see chapter 8).](https://thumb-us.123doks.com/thumbv2/123dok_us/767825.2597121/93.892.325.642.349.781/figure-visualisation-principal-components-dataset-created-vrmlgen-software.webp)