SCIENCE
Rockfall runout, Mount Cimone area, Emilia-Romagna Region, Italy
Daniela Piacentinia∗, Giulio Ercolessia, Marco Pizzioloaand Francesco TroianibaServizio Geologico Sismico e dei Suoli, Regione Emilia – Romagna, Bologna, Italy;bDipartimento di
Scienze della Terra, Sapienza Universita` di Roma, Rome, Italy
(Received 3 March 2014; resubmitted 18 July 2014; accepted 15 August 2014)
Numerous mass movements of different typology characterize both mountainous and piedmont sectors of the Emilia-Romagna Region (Apennine chain, North Italy). Although a less spatially frequent landslide typology within the region, rock falls represent severe threats to buildings, roads and persons due to their high propagation velocity. This paper presents an extract of the Emilia-Romagna regional map of the rock fall runout areas at a scale of 1:25,000. The analysis of rock fall runout areas was based upon a three-dimensional morphological method (TDM). The zone presented in theMain Mapencompasses the area surrounding Mount Cimone, in the Emilia-Romagna Region. The proposed regional map of rockfall runout is noteworthy for planning actions and strategies aimed at the prevention and reduction of landslide risk at a regional scale.
Keywords:rock falls; landslides; 3D-morphological method; northern Apennines; Italy
1. Introduction
The Emilia-Romagna Region, within the northern Apennine chain (Italy), is characterized by abundant and recurrent mass movements, among which rock falls are the most hazardous typology, even though less spatially recurrent (APAT, 2007). Rock falls represent a serious threat to urbanized areas, transport links and people due to their high velocity, independent of the volumes involved. Consequently, as part of territorial planning these phenomena must be taken into account in order to evaluate possible threats. In this context, an assessment of rockfall runout areas was performed at a regional scale (SSGS – Regione Emilia-Romagna, 2014). This work presents amapat a scale of 1:25,000 of the Mount Cimone area, within the Emilia-Romagna Region. A three-dimensional morphological method (TDM), developed within a geographyc information system (GIS), was used for rockfall assessment (Piacentini, 2006). TDM was selected since local deterministic analyses, generally based on kinematic models (Dorren, 2012;Guzzetti, Crosta, Detti, & Agliardi, 2002;Stevens, 1998), are not suitable for assessing rock fall over large territories due to the significant amount of data required and their quality and resolution that needs to be homogeneous over the entire territory. In turn,TDMis practical and cost-effective to initially identify areas most prone to rock falls at a regional scale. In fact, TDM does not require a signifi-cant amount of input data and can lead to effective and reliable results (Piacentini & Soldati,
#2014 Daniela Piacentini
∗Corresponding author. Email:dpiacentini@regione.emilia-romagna.it
Vol. 11, No. 4, 598 – 605, http://dx.doi.org/10.1080/17445647.2014.956154
2008). The necessary data can be derived from available digital terrain models (DTM) (e.g. slope angles), remote sensing analysis (e.g. land use), and existing regional geological maps (e.g. geo-logical units and their geo-mechanical characteristics). Our opinion is that the resulting map is helpful for recognizing areas most prone to rock fall. In addition, the map is a useful tool for pre-liminary assessment at a regional scale for rockfall detachment points and their runout areas aimed at completing a landslide inventory map of the whole regional territory (SSGS – Regione
Emilia-Romagna, 2013a).
2. The mount Cimone area
The map presented in this paper was extracted from the Emilia-Romagna regional map of rockfall runout areas. The map encompasses the Mount Cimone area that covers a ca. 180 km2-wide ter-ritory mostly characterized by mountainous landscape (heights ranging from ca. 580 up to 2165 m a.s.l.) (Inset A in the Main Map). This territory comprises several Apennine peaks including Mount Cimone (2165 m a.s.l.), Mount Cervarola (1623 m a.s.l), and Mount Libro Aperto (1937 m a.s.l.). The area lies within the Panaro River headwaters, one of the right tributary of the Po River. A prevalently planar or sub-planar morphology generally characterizes the main valley floors, as well as the areas at the main drainage divides. In contrast, the steepest slopes, reaching angles up to about 708, characterize the mountainous sectors of the area and/or the valley sides where the bedrock consists of the hardest lithologies (Inset B in theMain Map).
The study area is part of the northern Apennine chain representing the sub-aerial appearance of a collisional orogenic wedge that has developed since the Oligocene as the result of the col-lision between Africa and Eurasia (Wilson, Pazzaglia, & Anastasio, 2009 and reference therein). The northern Apennine chain consists of a N-NE verging arcuate thrust-and-fold belt that has become definitively emerged within the last 1 – 2 million years. The whole area is tecto-nically active. Several historic and instrumental high frequency and low-intensity (Ms,6.0) earthquakes have occurred in this sector of the Apennine chain.
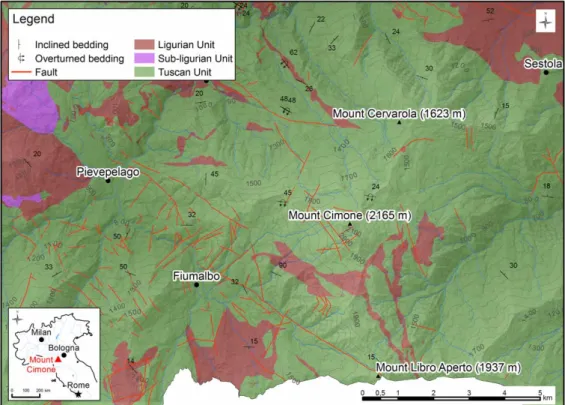
The bedrock of the Mount Cimone area consists of Eocene-Miocene turbiditic terrigenous for-mations (prevalently from medium- to thick-layered arenites and pelites) pertaining to the Tuscan Unit overlain by Creataceous-Miocene arenites, calcarenites, marls, and clays belonging to the Sub-Ligurian and Ligurian nappes (SSGS – Regione Emilia-Romagna, 2013b) (Figure 1and Inset C in theMain Map).
The lithological and structural characteristics of the outcropping bedrock strongly influence the morphology of the area. The active morphogenetic processes are mainly due to running water, gravitational slope instability and human activities. In the study area different rock types (i.e. arenites and calcarenites) outcrop that can potentially be affected by rockfall, compounded by intense rock-mass fracturing, strata attitude and steep-slopes (Figure 1 and Inset D in the
Main Map). Small-to-medium blocks, rarely exceeding pluri-metric dimensions, generally
characterize rock falls in the area. Rock falls have damaged several buildings and infrastructure (e.g. roads and bridges) (Figure 2) and, at present, represent a serious threat to urbanized areas. Vegetation covers more than 90% of the Mount Cimone area. Trees and, to a lesser extent, meadows and bush characterize the prevalent land use (Inset E in theMain Map). The remaining territory is characterized by outcropping bedrock and urbanized areas. The latter are the small towns of Fiumalbo, Pievepelago, Riolunato and Sestola.
3. Materials and methods
The map of rockfall runout areas was obtained through of application of a morphological approach (Heinimann, Holtenstein, Kienholz, Krummenhacher, & Mani, 1998; Jaboyedoff &
Journal of Maps 599
Labiouse, 2011; Onofri & Candian, 1979). In particular, a three – dimensional morphological method (TDM) (Piacentini, 2006;Piacentini & Soldati, 2008). TDM is based on historical analy-sis of past rock falls, assumes that block energy dissipation is directly proportional to the distance of propagation, and relates to slope conditions. Starting from a detachment point, TDM allows identification of the possible runout area as a ‘cone’ defined by calibrated vertical (a) and hori-zontal (b) angles (Figure 3).
At a regional scale, a detailed field survey of rockfall detachment points is not a useful approach. As a consequence, in agreement with previous work (Piacentini, 2006;Piacentini & Soldati, 2008), the rockfall detachment points were selected taking into account the methodology as follows:
(1) Predisposing slope angles, derived from a 5 m-gridded DTM;
(2) Bedrock formations most predisposed to rock fall due to their lithological and geo-mechanical characteristics, derived from the Geological Map of the Emilia-Romagna Region at the scale of 1:10.000 (SSGS – Regione Emilia-Romagna, 2013b);
(3) Land use dataset, derived from the Land Use Map of the Emilia-Romagna region at the scale of 1:25.000;
(4) Areas already affected by rock falls, derived from the historical archive of past landslides of the Emilia-Romagna Region (SSGS – Regione Emilia-Romagna, 2013a).
Starting from the areas selected with the methodology above, three different scenarios of runout zones were identified based on the three different vertical angle values (a¼2338,2358,2378). Figure 1. Geological sketch of the Mount Cimone area. Main geological units described in the text and the general structural setting are shown.
In the present work, the angle values was selected in agreement withHeinimann et al. (1998)and
Piacentini and Soldati (2008), as well as based on results obtained in the study area (Piacentini, 2006). The value of vertical angles considered block dimensions and slope conditions (i.e. Figure 2. Examples of slopes characterized by rock fall in the Mount Cimone and surrounding area. (a) Rocky slope affected by rock falls that involved a road; (b) Rocky cliff affected by a recent rockfall on a bridge; (c) Rockfall affecting a slope characterized by alternating of hard (arenites) and weak (marls) layers; (d) Rock fall characterized by metric size blocks; and (e) Rock fall that involved and damaged a road. Journal of Maps 601
vegetation and morphology) (Table 1). In particular, blocks with a diameter less than 0.5 m can stop within all three zones. In the first one, that is the closest to the detachment wall and defined by an equivalent friction angle of2378, blocks can be stopped by trees, by very irregular topography and by scree. The second, intermediate zone, defined by an equivalent friction angle of2358, can be reached by blocks when the conditions of vegetation, topography and land use are less Figure 3. Outline of rock-fall runout area detection applying a three-dimensional morphological method (TDM).a: vertical angle defining different trajectories;b: horizontal angle defining lateral dispersion. See text for details.
Table 1. Vertical angles adopted for the rockfall runout modelling (afterPiacentini & Soldati, 2008). See text for details.
Slope condition Block dimension
(diameter m)
,0,5 Vegetation: meadow Vegetation: bush Vegetation: trees
Morphology: regular Morphology: slightly
irregular
Morphology: very
irregular 0,5 – 2 Vegetation: bush Vegetation: trees
Morphology: slightly irregular Morphology: very irregular .2 Vegetation: trees Morphology: very irregular 2338 2358 2378 Vertical angle
favourable. Finally, in the third zone, the farthest and most conservative one, defined by angles of
2338, small blocks can propagate only under very unfavourable friction conditions. Blocks with diameters between 0.5 m and 2 m can reach 2358and2338zones. Blocks stop in the closest zone bounded by an angle of 2358 when high vegetation and irregular topography occur at the foot of the rock walls. The zone bounded by an angle of 2338is reached by blocks when the conditions of land use, vegetation and topography prevents stopping in the2358zone. For blocks with diameter over 2 m, only one possible stop zone can be identified, defined by an equiv-alent friction angle of 2338(Piacentini & Soldati, 2008).
The horizontal angles (b), defining the block lateral dispersion, were assumed to be+158in relation to the aspect of the slope.
Unlike the general application ofTDM, in this work the rockfall trajectories were simulated taking into account the presence of natural boundaries close to the detaching slope, as generally represented by narrow valleys, which can reduce -or even restrict-block propagation (Figure 4). We decided to include natural boundaries (i.e. narrow valleys) in the production of rockfall runout areas in order to obtain more consistent and physically constrained scenarios. In particular, the simulation accomplished takes into account the streambed that functioned as a natural boundary for block propagation at the bottom of narrow valleys (Figure 4); this reduced the over-estimation of block propagation that in general represents a critical weakness ofTDM.
Trajectories were simulated using a 20 m-gridded DTM and validated by field checks.
4. Rockfall runout map of the mount Cimone area
The Mount Cimone area presents a generally smooth morphology and gentle relief, showing low-to-medium energy. The sectors of the area that show the maximum relief energy, as well as the maximum relief difference between hillcrests and valley floors, coincide with outcrops of the hardest rocky types which can produce rock falls. These outcrops also have high slope angles and are generally characterized by massive arenites and calcarenites or by an alternating hard (i.e. arenites and calcarenites from medium-to-thick layered) and weak layers (marls and clays) Figure 4. Outline of the adjustment applied to theTDMfor detecting rockfall runout within the Mount Cimone area. The adjustments take into account the presence of natural boundaries. (a) runout areas resulting in a narrow virtual valley without the adjustment; and (b) runout areas resulting in the same valley after the adjustment. See text for details.
Journal of Maps 603
showing the highest hard/weak ratios (i.e.h/w.1/3) (cfr.Insets C and D in theMain Map). Field surveys demonstrated that attitude of strata and their orientation with respect to the slope often influence rockfalls. In addition, exposed fault planes and intense rock-mass fracturing due to the presence of shear zones generally predispose rock-mass mobilization. In addition, rock falls are favoured in areas with physical weathering due to seasonal temperature variations, which is more intense at the highest elevations. Physical weathering acts at rock-mass surfaces producing rock disintegration, exfoliation and augments rock crumbling due the presence of joints and fractures. Taking into account rockfall predisposing factors, the map of detachment points was created (Inset F in theMain Map). The map shows the points where rock blocks of different diameters can mobilize. A detachment point was considered the pixel centroid that satisfies these characteristics:
(1) Slope angles.338, selected on the basis of previous analyses and in accordance with the values proposed in previous works (Heinimann et al., 1998;Piacentini & Soldati, 2008); (2) Bedrock belonging to one of these rock types, considering the geo-mechanical character-istics of rocks already affected by falling: (i) alternating strata with a relationship between hard and weak layers (i.e. h/w ratio) .3, or (ii) alternating strata with a relationship between hard and weak layers ranging from 1/3 up to 3;
(3) Land use belonging to one of these three classes: (i) bush, or (ii) trees, or (iii) rock, selected because their potential to contain bedrock outcrops, and so detachment points (Figure 2cand2d).
The map does not directly incoporate inherent rock-mass fracturing (i.e. conditions of fractures and joints) because, at the scale of the analyses, here it is not possible to obtain the necessary detail. Moreover, this map represents a preliminary study that can be augmented withad-hoc field surveys aimed at obtaining information on rock fractures and joints that will be fundamental to a second phase, where deterministic slope stability analyses can be performed.
This map presents three different propagation scenarios derived from the simulation of three different vertical angles.Table 1presents the relationships among the vertical angles adopted for the TDM simulations, blocks dimensions and slope conditions. The latter are defined by veg-etation and terrain morphology. The scheme illustrating these relationships is also included as an inset on theMain Map.
In the Mount Cimone area the diameters of mobilized blocks are generally sub-metric and rarely exceed the metric dimension as the regional archive of past rock falls demonstrates, also confirmed by field surveys conducted for this work (cfr.Figure 2for some examples). Neverthe-less, the map allows evaluation of situations in which potential detachment blocks can exceed 2 m in diameter (i.e. vertical anglea¼2338) in order to generate a more precautionary scenario.
TheMain Mapreports the runout zones for the entire Mount Cimone area and seven insets as
follows: (1) the physiography of the area (elevation map); (2) the areal distribution of slope angles (slope map); (3) a simplified scheme of the different lithotypes outcropping in the area grouped by their geo-mechanical characteristics; (4) a map of lithotypes generally affected by rock fall; (5) land use; (6) the map of rockfall detachment points; (7) the map of vulnerable elements affected by rock falls.
5. Conclusions
The analyses performed to recognize the rockfall detachment points and the TDM used to obtain the map of rockfall runout proved to be a suitable and cost-effective method for investigating rock fall at a regional scale. The map produced is a reliable tool for preliminary identification of areas
affected by rockfall. It requires few data inputs (i.e. slope angle, land-use characteristics, geo-mechanical characteristics of bedrock), which can be easily collected from DTMs and exist-ing geological and land-use maps. Startexist-ing from the input data, the first step consists in recogniz-ing rockfall detachment points and, successively, by applyrecogniz-ing the TDM method the rockfall runout scenarios can be developed. The areas identified byTDM can be successively analysed with respect to vulnerable elements (e.g. infrastructre, urban areas). In this regard, the map also highlights possible interactions among the potential rockfall runout zones and vulnerable elements of the territory. This allows identification of those zones where the highest risk of rock fall occurs and where additional detailed analyses – and eventually mitigation actions – must be planned. From this perspective, the proposed map represents a reliable and cost-effective tool useful for planning strategies aimed at reducing rockfall risk. To this end, the map presented should be analysed and interpreted considering potential future mitigation systems.
Software
Initial data input was performed usingFeature Manipulating Enginerel. 2008 (FME), whilst the compu-tation of trajectories, as well as the final map, was performed using Esri ArcGIS 10.
References
APAT. (2007).Rapporto sulle frane in Italia. Il progetto IFFI: metodologia, risultati e rapporti regionali (Report No. 78/2007). Rome, IT: APAT.
Dorren, L. K. A. (2012). Rockyfor3D (v5.1) revealed – Transparent description of the complete 3D rockfall model.ecorisQ paper,4, 1 – 31. Retrieved fromhttp://www.ecorisq.org
Guzzetti, F., Crosta, G., Detti, R., & Agliardi, F. (2002). STONE: a computer program for the three-dimensional simulation of rock-falls. Computers & Geosciences, 28, 1079 – 1093. doi: 10.1016/ S0098-3004(02)00025-0
Heinimann, H. R., Holtenstein, K., Kienholz, H., Krummenhacher, B., & Mani, P. (1998).Methoden zur
Analyse und Bewertung von Naturgefahren. (Report No. 85). Bern, DE: Umwelt-Materialien
Naturgefahren, BUWAL.
Jaboyedoff, M., & Labiouse, V. (2011). Technical Note: Preliminary estimation of rockfall runout zones.
Natural Hazards Earth System Science,11(3), 819 – 828.doi: 10.5194/nhess-11-819-2011
Onofri, R., & Candian, C. (1979).Indagine sui limiti di massima invasione dei blocchi rocciosi franati
durante il sisma del Friuli del 1976. Trieste, IT: CLUET.
Piacentini, D. (2006). Metodi innovativi per la valutazione della pericolosita` da frana, con particolare atten-zione ai fenomeni di crollo di roccia: casi studio nelle Dolomiti e nell’Appennino emiliano. Atti della
Societa` dei Naturalisti e Matematici di Modena,137, 157 – 169.
Piacentini, D., & Soldati, M. (2008). Application of empiric models for the analysis of rock-fall runout at a regional scale in mountain areas: examples from the Dolomites and the northern Apennines (Italy).
Geografia Fisica e Dinamica Quaternaria,31(2), 215 – 224.
SGSS (Servizio Geologico, Sismico e dei Suoli) – Regione Emilia – Romagna. (2013a). Cartografia del dissesto idrogeologico. Retrieved from http://ambiente.regione.emilia-romagna.it/geologia/cartografia/ webgis-banchedati/cartografia-dissesto-idrogeologico
SGSS (Servizio Geologico, Sismico e dei Suoli) – Regione Emilia – Romagna. (2013b). Cartografia geologica. Retrieved from http://ambiente.regione.emilia-romagna.it/geologia/cartografia/webgis-banchedati/webgis
SGSS (Servizio Geologico, Sismico e dei Suoli) – Regione Emilia – Romagna. (2014). Carta della aree di possibile propagazione delle frane di crollo. Retrieved from http://geo.regione.emilia-romagna.it/ geocatalogo/
Stevens, W. D. (1998).RocFall: a tool for probabilistic analysis, design of remedial measures and prediction
of rockfalls. (Master’s thesis). Graduate Department of Civil Engineering, University of Toronto,
Toronto.
Wilson, L. F., Pazzaglia, F. J., & Anastasio, D. (2009). A fluvial record of active fault-propagation folding, Salsomaggiore anticline, northern Apennines, Italy.Journal of Geophysical Research: Earth Surface, 114,doi:10.1029/2008JB005984
Journal of Maps 605
#
#
#
!
!
!
!
Sestola
Fiumalbo
Riolunato
Pievepelago
Mount Cimone (2165 m)
Mount Cervarola (1623 m)
Mount Libro Aperto (1937 m)
1000 1100 1200 900 800 1300 1400 1500 1600 1700 700 1800 19 00 2000 600 2100 1300 120 0 1600 1 600 1300 1700 1600 1700 1500 1100 1 700 1500 800 1200 900 1000 700 1400 1 500 11 0 0 1400 1200 600 80 0 2100 1300 900 1300 900 1300 1500 1500 1400 1500 800 1 200 1500 14 00 800 1500 1200 1400 15 00 1900 16 00 1500 1500 9 00 1 000 10 00 16 00 1200 1300 19 00 7 00 1300 7 00 700 1100 1500 1100 800 1400 1400 1000 1300 1400 900 90 0 1300 1400 80 0 800 150 0 1300 1 600 1200 1600 10°45'0"E 10°40'0"E 10°35'0"E 44 °1 5' 0" N 44 °1 5' 44 °1 0' 0" N 44 °1 0' 0" N C ar to gr ap hi c R ef er en ce S ys te m : E D 50 /U TM 3 2N
Piacentini D.*, Ercolessi G.*, Pizziolo M.*, Troiani F.**
* Regione Emilia-Romagna. Servizio Geologico Sismico e dei Suoli,Viale della Fiera, 8, Bologna, Italy dpiacentini@regione.emilia-romagna.it gercolessi@regione.emilia-romagna.it mpizziolo@regione.emilia-romagna.it
** Dipartimento di Scienze della Terra. Università di Roma "La Sapienza", P.le Aldo Moro, 3, Roma, Italy
francesco.troiani@uniurb.it
Rockfall runout map
of the Mount Cimone area:
application of 3D-morphological method
in the Emilia-Romagna Region (Italy)
# # # ! ! ! !
Mount Cimone (2165 m)
Mount Cervarola (1623 m)
Mount Libro Aperto (1937 m)
Sestola Fiumalbo Riolunato Pievepelago # # # ! ! ! !
Mount Cimone (2165 m)
Mount Cervarola (1623 m)
Mount Libro Aperto (1937 m)
Sestola Fiumalbo Riolunato Pievepelago # # # ! ! ! !
Mount Cimone (2165 m)
Mount Cervarola (1623 m)
Mount Libro Aperto (1937 m)
Sestola Fiumalbo Riolunato Pievepelago ! ! ^ # ^ ^ ^ ^ Rome Paris Milan Vienna Berlin London Bologna Mount Cimone 20°0'0"E 10°0'0"E 0°0'0" 50°0'0"N 40°0'0"N ! ! ^ # Rome Milan Bologna Mount Cimone 10°0'0"E 45°0'0"N # # # ! ! ! !
Mount Cimone (2165 m)
Mount Cervarola (1623 m)
Mount Libro Aperto (1937 m)
Sestola Fiumalbo Riolunato Pievepelago # # # ! ! ! !
Mount Cimone (2165 m)
Mount Cervarola (1623 m)
Mount Libro Aperto (1937 m)
Sestola Fiumalbo Riolunato Pievepelago # # # ! ! ! !
Mount Cimone (2165 m)
Mount Cervarola (1623 m)
Mount Libro Aperto (1937 m)
Sestola Fiumalbo Riolunato Pievepelago
Ü
0
0,5
1
2
3
4
5
Km
# # # ! ! !Mount Cimone (2165 m)
Mount Cervarola (1623 m)
Mount Libro Aperto (1937 m)
Sestola Fiumalbo Pievepelago 1000 11 00 1200 900 800 1300 1400 150 0 1600 1 700 7 00 1800 20 00 1400 9 00 10 00 1200 700 14 00 1 40 0 1600 8 00 1600 800 700 1 300 1500 1500 12 00 1 500 13 00 1200 11 00 1600 1 000 1300 1500 8 00 1400 8 0 0 1300 1400 1200
Ü
Ü
Ü
Ü
Ü
Ü
Ü
© Journal of Maps, 2014 0 500 1.000kmÜ
Ü
0 100 200km 0 0,5 1 2 3 4 5 kmA
B
0 0,5 1 2 3 4 5 km 0 0,5 1 2 3 4 5 kmC
0 0,5 1 2 3 4 5kmD
0 0,5 1 2 3 4 5kmE
0 0,5 1 2 3 4 5kmLand use map
Stream Antropic Meadow Bush Trees RockF
Detaching lithotype map
Stream
Rock type not affected by falling Rock type affected by falling
0 0,5 1 2 3 4 5 km
G
630000 635000 4 8 9 5 0 0 0 4 9 0 0 0 0 0 4 9 0 0 0 0 0 4 8 9 5 0 0 0Legend
Stream
Major road
Countour line
(interval 100 m)Urbanized area
Vertical angles (α) defining rockfall runout scenarios
-37° -35°
- 33°
Vulnerable element map
StreamVulnerable element potentially affected by rockfall runout
Urbanized area
Countour line (interval 100 m)
Major road
Detaching point map
Stream
Detaching point
h/w* = relationship between hard and weak layers in alternation of strata
Semplified lithotechnical map
Stream Lithotypes Clay Tectonized clay Marl 1/3< h/w* <3 h/w* < 1/3 h/w* > 3Slope map
Stream Slope value (°) High : 72 Low : 0