Visual Interactive Comparison of Part-of-Speech Models for Domain
Adaptation
Markus John1, Florian Heimerl2, Constanze Sudra1, Thomas Ertl1 1Institute for Visualization and Interactive Systems (VIS), University of Stuttgart
2Department of Computer Sciences, University of Wisconsin-Madison [email protected]
Abstract
Interactive visual analysis of documents relies criti-cally on the ability of machines to process and analyze texts. Important techniques for text processing include text summarization, classification, or translation. Many of these approaches are based on part-of-speech tagging, a core natural language processing technique. Part-of-speech taggers are typically trained on collections of modern newspaper, magazine, or journal articles. They are known to have high accuracy and robustness when applied to contemporary newspaper style texts. However, the performance of these taggers deteriorates quickly when applying them to more domain specific writings, such as older or even historical documents. Large train-ing sets tend to be scarce for these types of texts due to the limited availability of source material and costly digitiza-tion and annotadigitiza-tion procedures. In this paper, we present an interactive visualization approach that facilitates an-alysts in determining part-of-speech tagging errors by comparing several standard part-of-speech tagger results graphically. It allows users to explore, compare, evaluate, and adapt the results through interactive feedback in or-der to obtain a new model, which can then be applied to similar types of texts. A use case shows successful appli-cations of the approach and demonstrates its benefits and limitations. In addition, we provide insights generated through expert feedback and discuss the effectiveness of our approach.
1.
Introduction
Natural language processing (NLP) methods that help to extract structure from textual representations of infor-mation are essential building blocks of interactive vi-sual approaches to text data. Appropriate methods, for example, to summarize text [1], extract semantic infor-mation [2], find and categorize named entities [3], or uncover hidden structures in discourse [4] play a critical role in creating useful visual representations of textual information sources. Text is typically processed along a
pipeline of different NLP methods, with each step extract-ing additional information from the target documents.
One of the most fundamental early stages of an NLP pipeline is part-of-speech (POS) tagging. Many anal-ysis methods, such as text to speech synthesis or text translation, depend on it [5]. POS tagging automatically annotates lexical categories for word tokens in texts. It takes a sentence of tokens as input and assigns a unique POS tag to each token, such as a noun, verb, or adjec-tive. Typically, these taggers are based on rule-based, statistical or machine learning approaches, and they are trained and optimized on contemporary types of texts, such as newspapers or journal article texts. To train and evaluate a POS tagger, an extensive corpus with human labeled annotation as a reference (called a gold standard) is needed. Such annotated gold standard corpora are most often not available for these kinds of text. Consequently, standard POS taggers do not achieve such good results on particular types of texts, such as historical documents or fictional novels. To create a gold standard corpus is a laborious, time-consuming, and challenging process because NLP techniques usually need many thousand an-notated documents to work well [6]. In such a situation, it can be more useful to let analysts correct and adapt available taggers to obtain a new model, which can then be applied to similar types of texts [7].
This paper presents an interactive visual approach that supports analysts to adapt a POS tagger model for spe-cific types of texts, in which common out of the box POS taggers do not achieve a satisfactory result. It provides an overview of several POS taggers results and highlights inconsistencies instances, which are good candidates for manual inspection. Therefore, the approach enables an-alysts to explore, compare, evaluate, and correct POS tags of different taggers. That way, we support the man-ual analysis process, the examination of hypotheses, and discovery of insights about the out of the box taggers, and the adaption of a POS tagger model. In addition, we offer a simple automatic algorithm to support manual correction and error analysis. The algorithm is based on a
Proceedings of the 52nd Hawaii International Conference on System Sciences | 2019
majority voting and user feedback and attempts to adapt incorrect instances.
The main contributions of this work are: 1) An interactive visualization approach, which provides an overview of different POS tagger results and identifies inconsistencies between them. 2) The approach enables users to visually explore, compare, and correct POS tag results to achieve a POS tagger model for a specific type of text, which can then be applied to a similar type of text. 3) A usage scenario shows successful applications of the approach and demonstrate its benefits and limitations. In addition, we present and discuss insights of an expert study with one computational linguistics researcher that works in the fields of digital humanities and POS tagging.
2.
Related Work
Our approach relates to previous work under two dif-ferent aspects. Firstly, we focus on graph visualizations which represent the commonalities and differences of a graph. Secondly, we summarize visual text analytics approaches that incorporate advanced analysis methods which can be applied and adapted by users through inter-active feedback.
2.1.
Variant Graphs
During the last years, several graph approaches have been developed to visualize the course, similarities, and differences of a graph. For example, Wattenberg and Vi´egas proposed the “Word Tree” visualization [8], which represent a graphical version of the traditional “keyword-in-context” technique. It uses a graph-based
vi-sualization and facilitates the querying and exploration of different word contexts. J¨anicke and Wrisley presented an interactive visual approach for the alignment of me-dieval text versions [9]. It offers interactive views for different text hierarchy levels in order to support the in-vestigation of commonalities and differences. Collins et al. [10] introduced a visualization approach that visual-izes the uncertainty in lattice graphs. It uses transparency, color, and size to reveal the lattice structure and sup-ports users in making better-informed decisions about statistically derived results.
In 2009, Schmidt et al. [11] introduced the variant graph visualization that represent multiple versions of a digital text where nodes represent words and edges differ-ences among various editions of the text. A variant graph is an acyclic graph that composes of vertices and directed edges and does not contain directed cycles. There are many more approaches that deal with the analysis and the visual comparison of different text editions. For ex-ample, Dekker presented CollateX [12], which enables users to analyze and work with electronic text editions in
the browser. The web-based approach Stemmaweb [13] extends CollateX and enables users to annotate, split and merge vertices. TRAViz [14] uses a variant graph to show variations between different editions of Gene-sis and focuses on the improvement of the visual graph representation. It uses color, word-sizing, and a linear alignment as well as it removes unnecessary visual el-ements to improve the readability of the variant graph. We use a very similar representation to depict the dif-ferent POS tagger results graphically. However, in our approach nodes represent POS tags and edges different tagger results.
2.2.
Visualization and Computational
Linguistics
In recent years, more and more visual analytics ap-proaches that incorporate NLP methods have been sug-gested. For example, some approaches automatically extract named entities to support the analysis and ex-ploration of them [3, 15]. Wanner et al. [2] and Liu et al. [16] present visual analytic approaches that use senti-ment analysis methods to reveal the emotional content of large document sets. In addition, there are systems which use NLP methods to extract prominent topics and enable users to explore them visually [17, 18]. El-Assady et al. [19] presented a visual analytics approach for detect-ing and analyzdetect-ing the conversational structure of discus-sions. The approach uses machine learning techniques, user-defined queries, and rule-based heuristics to recon-struct threads, untangle conversations, and to understand model decisions better. Strobelt et al. proposed Seq2Seq-Vis [20], which enables users to explore and analyze a trained sequence-to-sequence model of a translation process. It offers different views that facilitate users in understanding which patterns have been learned and in detecting model errors.
There are also a number of approaches that enable users to adapt NLP methods to achieve a higher perfor-mance of the method. For example, Heimerl et al. [21] present an interactive approach that lets analysts train a support vector machine for text document classification based on a visual explanation. It represents the confi-dence value for each document by the horizontal position in a scatterplot visualization and thus enables users to judge the quality of the classifier in iterative feedback loops. Brown et al. [22] proposed a technique that allows users to develop similarity functions for machine learn-ing models interactively. VarifocalReader [7] offers an active learning algorithm to classify quotes between texts into different categories. It uses color saturation to depict the accuracy of the algorithm results to indicate instances that are good candidates for manual inspection. Users
can correct or confirm the classifications and trigger a retraining step to improve the classifier results.
Eckart et al. [23] presented an approach for annotat-ing a large collection of non-standard multi-modal data. It also uses information from multiple approaches, in-cluding manual and automatic annotations, and different strategies to set a winning tag. However, this approach offers no visual interface to analyze the results. Dick-inson and Meurers [24] introduced an algorithm to de-tect POS tags errors in gold-standard annotations. They present three error detection methods, which are related to the common inter-annotator agreement evaluation strat-egy [25]. Thiele et al. [26] applied a similar technique to detect POS errors and developed a graphical interface that enables users to find and evaluate annotation errors. How-ever, the approach only provides table views and thus limited possibilities to explore the annotation errors in detail. Closely related to our approach are DAViewer [4] and ICARUS [27]. DAViewer is an interactive visualiza-tion system that provides valuable support for exploring, evaluating, and annotating the results of discourse parsers. It offers, multiple coordinated views, including node-link graphs, or icicle dendrograms, which allow users to com-pare the results of the different parsers. However, the parser results are visualized in small multiples next to each other, and thus it is difficult to compare and analyze the differences. In addition, DAViewer has been primar-ily designed for analyzing discourse parsers, whereas we are interested in adapting a POS tagger model for a specific type of text. ICARUS is a visualization system that enables users to query dependency treebanks in order to analyze POS tag results. It provides frequency lists, tables, and dependency graphs that allow users to inspect the query results in a quantitatively and qualitatively way. However, ICARUS serves more as a search framework and does not provide an overview of uncertain instances, the possibility to compare multiple contexts with each other, or to adjust incorrect POS tags.
3.
Visual Analysis
Our approach supports users in determining POS tag-ging errors by comparing multiple POS tagger results visually. It is based on multiple coordinated views which allow users to inspect details on different abstraction lev-els. In the following, we first focus on the requirement analysis and afterwards we explain the applied text in preprocessing steps. Last, we introduce and explain the different linked views in detail.
3.1.
Requirement Analysis
Our approach was developed in the context of a dig-ital humanities project, which comprises visualization,
humanities, and computational linguistics scholars. From our regular group meetings and discussions, we learned that there is a need to improve the performance of POS taggers for older and historical texts because the per-formance of out-of-the-box taggers is unsatisfactory for further NLP processing steps. To improve the perfor-mance of these taggers, electronically available training corpora are needed. However, training sets from ear-lier time periods are often sparse [7]. One possibility could be to annotate a large corpus as training data, but the annotation of a large amount of text is a very time-consuming and complex task. Therefore, we developed the idea to implement a visual approach that enables users to adapt POS tagging model for specific types of text through interactive feedback. In cooperation with our computational linguistic experts, we decided to use multiple POS taggers as a basis for our implementation. The applied POS taggers perform state-of-the-art NLP approaches, but use different techniques, and thus they have their benefits and limitations in different contexts. All of the used taggers have been trained on modern texts. Therefore, we assume that they have a high agreement on trained text structures, however, disagree in uncertain instances. Uncertain instances can be, for example, un-known words, words with multiple lexical tags, or text structures on which the POS taggers were not trained. These uncertain instances can then be highlighted to pro-vide a good starting point for analysis. Thus, users can easily find, analyze, and correct incorrect assigned POS tags faster. In addition, computational linguistics schol-ars can get a better understanding of the shortcomings and strengths of existing parsers in different text contexts during the analysis.
With the lack of such a visualization system, we de-fined five requirements after several project meetings: (R1) The approach should provide an overview of the uncertain instances, which serve as starting points for a deeper analysis. (R2) The possibility to inspect these uncertain instances in detail. Therefore, it is necessary to represent the text and the assigned POS tags of the different taggers in a comprehensible way. (R3) A view that support a comparative analysis of multiple selected instances. (R4) The visualization should also support the possibility to analyze all text contexts of a particular token with each other. Thus, a compact view is required, which provides filter options that facilitate the explo-ration and analysis of the different contexts. (R5) Finally, the approach should support an algorithm that provides suggestions for further corrections based on the feedback of the users. In addition, a history view is needed that tracks these changes.
Documents Tokenizer Sentence Splitter OpenNlp … ANNIE Stanford TreeTagger POS Tagger
Figure 1: The linguistic pipeline consists of the process-ing steps: tokenization, sentence splittprocess-ing, and different standard POS tagging approaches.
3.2.
Text Processing
After users load a text document into the system, it is processed in a linguistic pipeline. Figure 1 depicts the linguistic pipeline, which consists of the processing steps: tokenization, sentence splitting, and different POS tagging approaches. For tokenization and sentence split-ting, we use the Stanford CoreNLP toolkit as the general linguistic basis for the four different taggers. Afterwards, we apply the ANNIE1, TreeTagger2, OpenNLP3, and Stanford CoreNLP4 POS taggers. At the moment, the current implementation only supports the preprocessing of English texts. However, it can be easily extended to other languages. The POS taggers use different POS tagsets, and thus we use the Penn Treebank tagset [28] and unify the POS tags. For example, we simplify the TreeTagger POS tagset by unifying the verbs formsVD
(verb do, base form) andVH(verb have, base form) to
VB(Verb, base form).
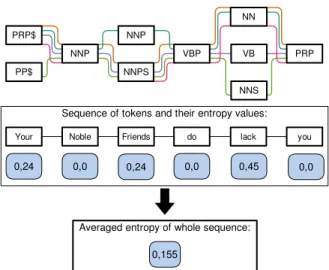
Based on the POS-tagger results, we use the Query-by-Committee algorithm by Seung et al. [29] and the vote entropy [30] to identify possible uncertain instances. The Query-by-Committee function is based on different trained classifiers and picks the assignments where the predictions of the classifiers disagree [31]. Subsequently, we use the vote entropy [32] that takes all classifiers into account to measure the level of disagreement. That way, we can determine instances as particularly uncertain where POS taggers have a high disagreement. Addi-tionally, we can define a winning tag (majority winner) where POS taggers have the highest agreement. If there is no majority winner, we randomly assign one of the highest assigned POS tag as winning tag. An example assignment of a text passage of the work “The Tragedy of Macbeth” by William Shakespeare [33] is depicted in Figure 2. It depicts the assigned POS tags of the four taggers and the entropy values of the tokens. We
as-1https://gate.ac.uk/ie/annie.html 2 http://www.cis.uni-muenchen.de/˜schmid/ tools/TreeTagger/ 3http://opennlp.apache.org 4http://nlp.stanford.edu/software/corenlp. shtml Paper_AvgEntropy - Untitled
Sequence of tokens and their entropy values: Your Noble Friends do lacke you
Example taken from Macbeth:
Your Noble Friends do lack
0,24 0,0 0,24 0,0 0,45
Averaged entropy of whole sequence: 0,155 you 0,0 PRP$ PP$ NNP NNP NNPS VBP VB NN NNS PRP
Figure 2: A schematic representation of a text passage from the work “The Tragedy of Macbeth” by William Shakespeare that illustrate the different POS tagger re-sults and the entropy values of the tokens, as well as the entropy of the whole text passage.
sign a unique color to each of the POS taggers (ANNIE (orange), OpenNlp (dark green), Stanford (purple), and TreeTagger (light green)) and the winning tag (violet). We use a predefined color scheme consisting of five dis-tinct colors using the ColorBrewer 2.05. For the term
“lack”, we get the entropy value of 0.45, because we have three different assigned POS tags: two timesNN (win-ning tag), VB, andNNS. In contrast to this, we get an entropy value of zero if all classifiers agree such as for the terms “Noble” and “you”. In addition, we calculate the entropy of the whole text passage for subsequent filter operations.
3.3.
Visual Approach
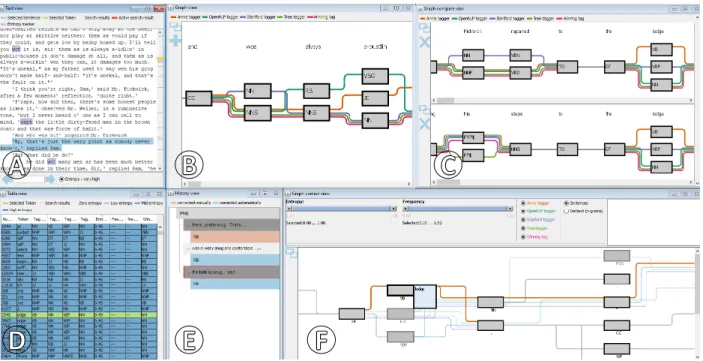
Figure 3 depicts the main workspace of our visual approach after loading an exemplary literature document. The approach consists of a graph, graph compare, graph context, text, table, and a history view. The six linked views provide different perspectives and possibilities to investigate the POS tagger results.
Text view: The loaded document is represented in the text view and provides a starting point for an analy-sis as depicted in Figure 3 a(R1). This view supports different highlights, such as user selections, search re-sults, or the highlighting of uncertain instances. We show the highlights in the text and next to the scrollbar with assigned fixed colors. For the representation of the high-lights next to the scrollbar, we use a quadratic mapping
Figure 3: Our approach consists of a the text, b the graph, c the graph comparison, d the table, e the history, and
f the graph context view.
similar to the approach presented by John et al. [34]. Thus, the context closer to the currently selected text passage has a higher resolution of detail compared to areas further away. This way, we prevent overlaps of highlighted markers in the focused area, and thus users can better navigate to specific text instances. To find uncertain instances, users can highlight tokens with a high entropy value. A sentence of interest can be further analyzed in the graph view by clicking on a sentence. By double-clicking on a token, users can examine all text contexts of the token in the graph context view. Addi-tionally, the selected sentence or token is highlighted in the table view. Furthermore, users can search for terms and navigate through the results using the forward and backward arrow.
Table view:Another possibility for a starting point, is the table view as depicted in Figure 3 d (R1). This view is similar to the text view and shows all tokens of the loaded document. Each row of the table represents a token and includes a unique id, the assigned POS tags, the entropy value, the given user feedback with a weight-ing (if available), and the current winnweight-ing tag. To indicate uncertain instances, we assign each row a color using a color gradient from white to blue. White colors indicate instances where POS taggers agree with each other and blue colors instances where the taggers have a high dis-agreement. By clicking on a row, the selected token is focused on the graph context view and the corresponding sentence is shown in the graph view. Furthermore, users
can set or correct a winning tag manually by double-click on a feedback field. Users have to choose the correct POS tag in a list and weight their decision. Based on this feedback, the integrated algorithm tries to correct similar instances (see Section 3.4).
Graph view: The graph view represents a selected sentence of the text and allows users to inspect the re-sults of the different POS taggers in detail as depicted in Figure 3 b (R2). The nodes of the graph represent the assigned POS tags and above we show the corresponding tokens. The colored edges represent the different POS tagger results and the currently winning tag. If all POS taggers match, we bundle the edges and draw a gray line to reduce visual clutter. Otherwise, we arrange the dif-ferently assigned POS tags vertically in the graph. This way, users can easily identify uncertain instances. To find the best arrangement of the nodes, we apply the simple Bubble Sort algorithm to minimize the crossings in the graph [35]. In case users find an incorrectly assigned winning tag, they can right-click on a tag and select a POS tag as well as weight their decision (Figure 6 a). By clicking on the plus button, the selected sentence is added to the graph compare view. Additionally, all implemented graph views support interactive features, such as panning, zooming, or re-arranging to facilitate the analysis of the users.
Graph compare view:The graph compare view pro-vides the same interaction possibilities and representa-tions as for the graph view. This view enables users to
compare an arbitrary number of sentences on top of each other as depicted in Figure 3 c. Users can freely change the order of selected sentences using a drag-and-drop in-teraction. That way, we facilitate a flexible comparative analysis of selected instances (R3).
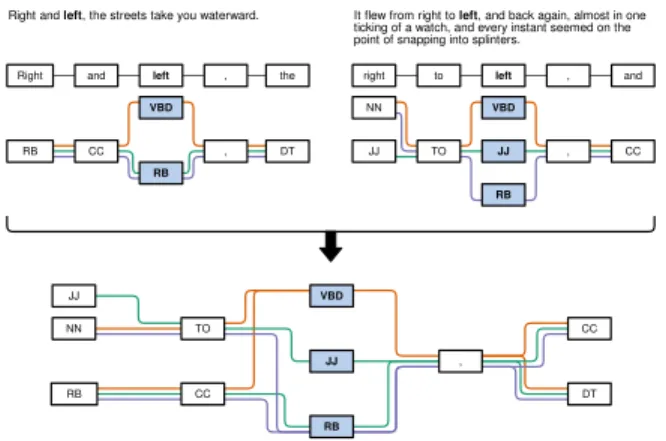
Graph context view:The graph context view is com-plemented with the graph compare view (Figure 6 b) and enables users to analyze a particular token (R4). The idea of this view is to represent all text contexts of a selected token in a compact graph representation as de-picted in Figure 3 f . It uses the same representation as the other graph views, however, merges all occurrences of a selected token in a single graph. Figure 4 depicts a schematic representation of a graph context view with three different POS tagger results. It represents the con-text of two sentences from the novel “Moby Dick” by Herman Melville [36] with the selected token “left”. The POS tags of the selected token are placed in the center of the graph and highlighted with a thicker frame. In the default configuration, all sentences that contain the selected token are shown in the graph. If the users are not interested in the whole sentences, they can define the number of tokens that are shown before and after the focused token. By clicking on a tag, the corresponding text contexts with the assigned tags of the different POS taggers are shown in the upper text area. Users can select the different text contexts to add and further analyze them in the graph compare view. By hovering over a tag, we display the underlying tokens in a list next to the tag as depicted in Figure 3 f . Again, if users find an incorrect winning tag, they can click on one of the POS tags to correct it using a context menu.
Furthermore, we offer filter possibilities that support the exploration and analysis of the text contexts. For example, users can hover over a tag to gray out not con-nected nodes, edges, and parts where all taggers match as depicted in Figure 3 f . By double-clicking on a tag, all connected lines and tags are faded out. In addition, we provide an entropy value filter, where users can set an entropy value range between zero and one to filter out text passages that do not match this range. Thus, we enable users to focus on particular text contexts. Addi-tionally, users can select and deselect the applied POS taggers. After users have changed the selection of the POS taggers, we recalculate the entropy values, and the graph is dynamically adapted.
History view: The history view (Figure 3 e) pro-vides an overview of the changed winning tags (R5). Users can correct POS tags in the different graph views or the table view and based on this feedback a simple algorithm tries to correct similar instances automatically. This view uses an indented tree layout to represent and track these changes. Each row represents a token where a
ContextGraph - Untitled RB CC VBD RB , DT JJ , CC VBD RB NN JJ TO JJ NN TO CC VBD JJ RB ,
It flew from right to left, and back again, almost in one ticking of a watch, and every instant seemed on the point of snapping into splinters.
Right and left, the streets take you waterward. Beispielsätze aus Moby Dick:
Right and left , the right to left , and
RB DT
CC
Figure 4: A Schematic representation of the graph con-text view with three different POS tagger results. It rep-resents two sentences from the novel “Moby Dick” by Herman Melville with the selected token “left”.
winning tag was changed. By clicking on a token, the dif-ferent sentences with a corresponding list that represent the history of the winning tags are shown. Because tags can be changed several times, we depict the POS tags in chronological order. Manually corrected tags are rep-resented with a red and automatically with a blue color. By double-clicking on a context, the sentence is loaded in the graph view and the selected token is focused in the context graph and table view. This way, users can easily find, inspect, and confirm or correct automatically assigned POS tags.
3.4.
Algorithm
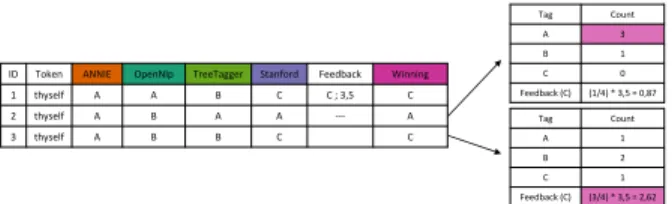
To support the error analysis and suggestions for man-ual corrections, we provide a simple algorithm that auto-matically tries to correct incorrect assigned winning tags (R5). The algorithm is optionally and can be disabled at any time by the user. It is based on the majority voting of the different POS taggers and the user feedback. After users correct a falsely assigned winning tag, they have to weight their decision. Users can choose between a weak (2,5), middle (3,5), and high weighting (5,5) or they can set a particular POS tag to all occurrences of the selected token. If users are unsure or suppose that token can have many different POS tags, they can, for example, set a weak weighting. Whereas, if users assume that it can be only a certain POS tag, they can, for example, choose a high weighting. Based on this weighting, the algorithm examines all occurrences of the selected token. For each occurrence, the algorithm considers the assigned POS tags and the user weighting. However, tokens that have been corrected manually are no longer considered by the algorithm. Figure 5 depicts an example of three
occur-ID Token ANNIE OpenNlp TreeTagger Stanford Feedback Winning 1 thyself A A B C C ; 3,5 C 2 thyself A B A A --- A 3 thyself A B B C C Tag Count A 3 B 1 C 0 Feedback (C) (1/4) * 3,5 = 0,87 Tag Count A 1 B 2 C 1 Feedback (C) (3/4) * 3,5 = 2,62
Figure 5: After a user feedback (ID 1), the algorithm analyzes two further instances (ID 2 and 3) with three exemplary POS tags for the token “thyself”.
rences for the token “thyself” with three exemplary POS tags. After initial user feedback (ID 1; POS tag C; weight 3,5), the algorithm counts the individual occurrences of the three different POS tags. For example, the POS tagA
occurs three times in the second (ID 2) and only one time in the third instance (ID 3). In addition, we count the overlaps of the assigned POS tags of the initial feedback instance (ID 1) with the two further ones (ID 2 and 3). For example, we have one overlap between the first and the second instance (ANNIE) and three overlaps between the first and third instance (ANNIE, TreeTagger, Stan-ford). Next, we multiply the number of overlaps with the feedback weight for each instance, because we ex-pect that instances with a high number of overlaps have a similar context or problem. Thus, the algorithm con-siders instances with a high disagreement (ID 2) rather less. Whereas, instances with a high agreement (ID 3) are good candidates for automatic correction. Based on the results, we define the winning tag, and all influenced instances are listed in the history view.
4.
Usage Scenario
In the following, we present a usage scenario that oc-curred during one of the joint workshops with one of our project collaborators. In the scenario, we analyze the old English novel “The Pickwick Papers” written by Charles Dickens [37]. The novel was published in 1836 and is about Samuel Pickwick, a wealthy old gentleman, and his journeys and reports to places remote from London. In a first step, the expert explores the text view. With the aid of the highlighted uncertain instances, she quickly recognizes terms with a high disagreement (R1). For example, she identifies the old English terms “wot” and “wos” (Figure 3 a), because Charles Dickens often uses the eye dialect [38]. The eye dialect uses nonstandard spelling for speech to draw attention to pronunciation. After examining some of the occurrences in detail in the graph view (Figure 3 b) (R2), she corrects all the in-stances. For example, she assigns the POS tag “WP” to all the occurrences of the token “wot”.
As the next step, our expert sorts the entropy col-umn in the table view to find another tokens with a high entropy value (R1). While scanning the table list, she is surprised that term “lodge” has a high disagreement (Figure 3 d), because she has suspected a very low en-tropy value. To inspect the occurrences, she selects the different instances to analyze them in the graph compare view further (R3) as depicted in Figure 3 c. By ana-lyzing them, she determines that particular the ANNIE and Stanford tagger have problems in this contexts. In addition, she finds out that near the instances there are other instances with a high disagreement and thus she assumes that this can influence the tagging results for the term “lodge”.
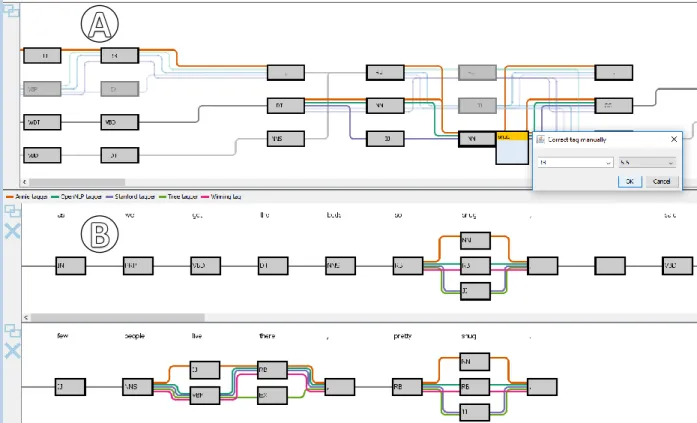
During the analysis, she encounters the token “snug” with also a high disagreement. To investigate all the occurrences, the expert uses the graph context view as depicted in Figure 6 a (R4). That way, she gets an overview of the different contexts of the selected term “snug”. She quickly recognizes further instances where the taggers disagree. To find out more about the different text contexts, she selects two contexts to analyze them further in the graph compare view as depicted in Figure 6
b (R3). By analyzing the contexts in detail, she is pretty sure that the correct POS tag should be an adverb (RB). However, only the OpenNlp tagger assigns the correct POS tag (RB) in one context. Therefore, she corrects one instance (Figure 6 a) with high weighting (R5). Subse-quently, she verifies the automatically changed instances in the history view as depicted in Figure 3 e. She finds out that both suggestions of the algorithm are correct and confirms them (R5).
The usage scenario shows that our approach can fa-cilitate users in visually exploring different POS tagger results to adapt incorrect POS tags. The different views offer several starting points for analysis and cover all the defined requirements of our project collaborators.
5.
Expert Feedback
In the following, we present and discuss the insights of an expert study. We conducted a qualitative think aloud study with one computational linguists expert to collect and reflect on her feedback. First, we gave an introduction of about 30 minutes to explain the idea of our approach and the different coordinated views. Af-terwards, we loaded the novel “Moby Dick” into our approach and let her freely explore for 60 minutes.
The first impression of our expert was very positive. She liked our idea to provide valuable support for explor-ing, analyzexplor-ing, and adapting a POS model for a specific type of text, because trained classifiers are often missing
Figure 6: a The context graph represents the all contexts of the selected term “snug” and b the graph compare view enables users to analyze the different instances in detail.
in specific research fields such as in the digital humani-ties.
She noted that it could be difficult to unify POS tags of different POS taggers. Therefore, our approach cur-rently only support POS taggers that use the Penn Tree-bank or similar tagsets which can be adapted such as the tagset of the TreeTagger.
Our expert mentioned that the text and table view provide good starting points for analysis. The highlight-ing of the disagreement between the taggers in the text and the possibility to sort tokens by the entropy value in table view enables users to find interesting instances for manual inspection. However, she suggested integrating a search function that allows users to search for a particular token.
She also liked the possibility to inspect instances with the text context in detail in the graph view. In addition, she praised the compare graph view, because for her it is very necessary to analyze different instances next to each other. She remarked that the graph context view is confusing at the beginning and that it requires time to understand the representation. However, she mentioned that this view could be very helpful to identify further problems of the taggers near the selected instance, which can then serve as another starting point for a deeper
anal-ysis. Additionally, our expert also praised the several filter options that facilitate her exploration and analysis of the different contexts.
Furthermore, she thought that the integrated algo-rithm is a suitable approach to suggest and correct similar instances. However, she also mentioned that the algo-rithm could be easily extended and thus improved. For example, we could enable users to weight the different taggers in a particular context.
Overall, our expert enjoys to work with our approach, and she would like to use it for her research.
6.
Discussion and Future Work
We have developed our system out of the need to support users in adapting a POS model for very specific types of texts. It compares several standard POS tagger results graphically and provides interaction possibilities to explore, analyze, and correct the POS tags. In the following, we discuss some limitations of our approach and provide an outlook on future work.
Our approach uses several standard POS taggers that use different techniques to indicate uncertain instances. We are confident that the taggers agree on trained text structures and we assume that they disagree in unknown
text contexts. However, there can be instances where all POS taggers agree, but the result can still be wrong. Therefore, we want to communicate the confidence value of the different taggers (if available). Then normally, au-tomatic methods typically offer uncertainty information with their results. This way, we can support our users with additional information and thus highlight instances where the different POS taggers have a high uncertainty value.
The approach currently offers a simple algorithm that tries to correct incorrect assigned POS tags based on a majority voting and the user feedback. We learned that the algorithm works well in many cases but in certain contexts not at all. Therefore, we plan to implement a more complex approach in close cooperation with our computational linguistic experts. One possibility would be to boost the used standard POS taggers in different contexts. The main idea of boosting is to combine many rules to produce highly accurate classification rules [39]. For example, we could enable users to boost particular POS taggers in a particular text context.
Scalability and usability is also an issue when work-ing with text documents. To assess the scalability of our approach, we tested very long documents and sev-eral attached books series. Our approach seems to be very scalable because the most views focus on selected text passages or provide visualization and interaction techniques that support an effective exploration. Nev-ertheless, if users select a token that occurs very often in the loaded document, the graph context view quickly becomes confusing. However, we discussed this issue with our experts, and they mentioned that the interactive filtering operations are very helpful to explore the graph and that tokens which occur frequently are mostly not interesting. Regarding usability, we found out that the analysis can become uncomfortable with many graphs or large ones because of the navigation with the scrollbars. One option to tackle this problem could be to combine a pixel-based [40, 41] with our graph visualization and let users switch between them. That way, the pixel-based visualization can be more scalable with many and large graphs, and thus provide a good overview of uncertain instances. Additionally, users could analyze the details with the aid of the graph views.
In the future, we also plan to compare the results of an adapted POS model with a standard model. In close cooperation with our humanities scholars, we want to analyze the effects of the adapted model to a similar type of text as well as the benefits for subsequent NLP working steps.
7.
Conclusion
In this work, we presented an interactive visualization approach that provides an overview of different POS tag-ger results and identifies inconsistencies between them. Our approach offers coordinated views that support users in visually exploring, comparing, and correcting POS tags to achieve a new POS tagger model for a specific type of text. Such an approach is particularly useful in situations where no gold standard is available to train a classifier. A usage scenario illustrates its applicability, usefulness, and the limitation of our approach. Finally, we present and discuss feedback of one computational linguistics post-doctoral researcher who is very familiar with this research area.
8.
Acknowledgments
This work was funded by the German Federal Min-istry of Education and Research (BMBF) as part of the Center for Reflected Text Analysis (CRETA) at Univer-sity of Stuttgart.
References
[1] M. John, E. Marbach, S. Lohmann, F. Heimerl, and T. Ertl, “Multicloud: Interactive word cloud visualization for the analysis of multiple texts,” inProceedings of Graphics Interface 2018, pp. 34 – 41, Canadian Human-Computer Communications Society / Soci´et´e canadienne du dia-logue humain-machine, 2018.
[2] F. Wanner, C. Rohrdantz, F. Mansmann, D. Oelke, and D. A. Keim, “Visual sentiment analysis of rss news feeds featuring the us presidential election in 2008,” inVISSW, 2009.
[3] J. Stasko, C. G¨org, and Z. Liu, “Jigsaw: Supporting inves-tigative analysis through interactive visualization,” Infor-mation Visualization, vol. 7, no. 2, pp. 118–132, 2008. [4] J. Zhao, F. Chevalier, C. Collins, and R. Balakrishnan,
“Facilitating discourse analysis with interactive visualiza-tion,”IEEE Transactions on Visualization and Computer Graphics, vol. 18, pp. 2639–2648, Dec 2012.
[5] M. A. Meselhi, H. M. A. Bakr, I. Ziedan, and K. Shaalan, “Hybrid named entity recognition - application to ara-bic language,” in2014 9th International Conference on Computer Engineering Systems (ICCES), pp. 80–85, Dec 2014.
[6] L. Wissler, M. Almashraee, D. M. D´ıaz, and A. Paschke, “The gold standard in corpus annotation.,” inIEEE GSC,
2014.
[7] S. Koch, M. John, M. W¨orner, A. M¨uller, and T. Ertl, “Var-ifocalReader – in-depth visual analysis of large text doc-uments,”IEEE Transactions on Visualization and Com-puter Graphics, vol. 20, no. 12, pp. 1723–1732, 2014. [8] M. Wattenberg and F. B. Vi´egas, “The word tree, an
inter-active visual concordance,”IEEE transactions on visual-ization and computer graphics, vol. 14, no. 6, 2008. [9] S. J¨anicke and D. Joseph Wrisley, “Visualizing mouvance:
Toward a visual analysis of variant medieval text tradi-tions,” Digital Scholarship in the Humanities, vol. 32, 2017.
[10] C. Collins, M. S. T. Carpendale, and G. Penn, “Visualiza-tion of uncertainty in lattices to support decision-making.,” inEuroVis, pp. 51–58, 2007.
[11] D. Schmidt and R. Colomb, “A data structure for repre-senting multi-version texts online,”International Journal of Human-Computer Studies, vol. 67, no. 6, pp. 497–514, 2009.
[12] R. H. Dekker and G. Middell, “Computer-supported col-lation with collatex: managing textual variance in an envi-ronment with varying requirements,”Supporting Digital Humanities, pp. 17–18, 2011.
[13] T. L. Andrews and C. Mac´e, “Beyond the tree of texts: Building an empirical model of scribal variation through graph analysis of texts and stemmata,”Literary and Lin-guistic Computing, vol. 28, no. 4, pp. 504–521, 2013. [14] S. J¨anicke, A. Geßner, G. Franzini, M. Terras, S. Mahony,
and G. Scheuermann, “Traviz: A visualization for variant graphs,”Digital Scholarship in the Humanities, vol. 30, no. suppl 1, pp. i83–i99, 2015.
[15] M. El-Assady, R. Sevastjanova, B. Gipp, D. Keim, and C. Collins, “Nerex: Named-entity relationship exploration in multi-party conversations,”Computer Graphics Forum, vol. 36, no. 3, pp. 213–225, 2017.
[16] B. Liu, M. Hu, and J. Cheng, “Opinion observer: analyz-ing and comparanalyz-ing opinions on the web,” inProceedings of the 14th international conference on World Wide Web, pp. 342–351, ACM, 2005.
[17] M. Kim, K. Kang, D. Park, J. Choo, and N. Elmqvist, “Topiclens: Efficient multi-level visual topic exploration of large-scale document collections,”IEEE transactions on visualization and computer graphics, vol. 23, no. 1, pp. 151–160, 2017.
[18] S. Havre, E. Hetzler, P. Whitney, and L. Nowell, “The-meRiver: visualizing thematic changes in large document collections,”IEEE Trans. Vis. Comput. Graph., vol. 8, pp. 9–20, Jan 2002.
[19] M. El-Assady, R. Sevastjanova, D. A. Keim, and C. Collins, “ThreadReconstructor: Modeling Reply-Chains to Untangle Conversational Text through Visual Analytics,”Computer Graphics Forum, 2018.
[20] H. Strobelt, S. Gehrmann, M. Behrisch, A. Perer, H. Pfis-ter, and A. M. Rush, “Seq2seq-vis: A visual debugging tool for sequence-to-sequence models,”arXiv preprint arXiv:1804.09299, 2018.
[21] F. Heimerl, S. Koch, H. Bosch, and T. Ertl, “Visual Clas-sifier Training for Text Document Retrieval,”IEEE Trans-actions on Visualization and Computer Graphics, vol. 18, pp. 2839–2848, dec. 2012.
[22] E. T. Brown, J. Liu, C. E. Brodley, and R. Chang, “Dis-function: Learning distance functions interactively,” in
Visual Analytics Science and Technology (VAST), 2012 IEEE Conference on, pp. 83–92, IEEE, 2012.
[23] K. Eckart and M. G¨artner, “Creating silver standard anno-tations for a corpus of non-standard data,” inProceedings of the 13th Conference on Natural Language Processing (KONVENS), vol. 16, pp. 90–96, 2016.
[24] M. Dickinson and W. D. Meurers, “Detecting errors in part-of-speech annotation,” inProceedings of the tenth conference on European chapter of the Association for Computational Linguistics-Volume 1, pp. 107–114, Asso-ciation for Computational Linguistics, 2003.
[25] T. Brants and W. Skut, “Automation of treebank annota-tion,” inProceedings of the Joint Conferences on New Methods in Language Processing and Computational Nat-ural Language Learning, pp. 49–57, Association for Com-putational Linguistics, 1998.
[26] G. Thiele, W. Seeker, M. G¨artner, A. Bj¨orkelund, and J. Kuhn, “A graphical interface for automatic error min-ing in corpora,” inProceedings of the Demonstrations at the 14th Conference of the European Chapter of the Association for Computational Linguistics, pp. 57–60, 2014.
[27] M. G¨artner, G. Thiele, W. Seeker, A. Bj¨orkelund, and J. Kuhn, “Icarus–an extensible graphical search tool for dependency treebanks,” inProceedings of the 51st Annual Meeting of the Association for Computational Linguistics: System Demonstrations, pp. 55–60, 2013.
[28] M. P. Marcus, M. A. Marcinkiewicz, and B. Santorini, “Building a large annotated corpus of english: The penn treebank,”Comput. Linguist., vol. 19, pp. 313–330, June 1993.
[29] H. S. Seung, M. Opper, and H. Sompolinsky, “Query by committee,” inProceedings of the fifth annual workshop on Computational learning theory, pp. 287–294, ACM, 1992.
[30] C. D. Manning and H. Sch¨utze,Foundations of statistical natural language processing. MIT press, 1999. [31] F. Laws, “Effective active learning for complex natural
language processing tasks,” inOPUS, 2013.
[32] I. Dagan and S. P. Engelson, “Committee-based sampling for training probabilistic classifiers,” inMachine Learning Proceedings 1995, pp. 150–157, Elsevier, 1995. [33] H. D. Godinez, “Macbeth, shakespeare,” in Macbeth,
Shakespeare, 1800.
[34] M. John, F. Heimerl, A. M¨uller, and S. Koch, “A visual fo-cus+ context approach for text comparison tasks,”VisLR: Visualization as Added Value in the Development, Use and Evaluation of Language Resources, pp. 29–32, 2014. [35] O. Astrachan, “Bubble sort: An archaeological algorith-mic analysis,”SIGCSE Bull., vol. 35, no. 1, pp. 1–5, 2003. [36] H. Melville, “Moby-dick; or, the whale. 1851,”Ed. Har-rison Hayford et al. Evanston: Northwestern UP and the Newberry Library, 1988.
[37] C. Dickens,The posthumous papers of the Pickwick Club. Carey, Lea and Blanchard, 1838.
[38] P. H. Bowdre Jr, “Eye dialect as a literary device,” A various language: perspectives on American dialects. New York: Holt, Rinehart and Winston, pp. 178–192, 1971.
[39] S. Abney, R. E. Schapire, and Y. Singer, “Boosting ap-plied to tagging and pp attachment,” in1999 Joint SIG-DAT Conference on Empirical Methods in Natural Lan-guage Processing and Very Large Corpora, 1999. [40] B. Asokarajan, R. Etemadpour, J. Abbas, S. Huskey, and
C. Weaver, “Visualization of latin textual variants using a pixel-based text analysis tool,” inProceedings of the Inter-national EuroVis Workshop on Visual Analytics, EuroVA, vol. 16, 2016.
[41] D. Oelke, H. Janetzko, S. Simon, K. Neuhaus, and D. A. Keim, “Visual boosting in pixel-based visualizations,”
Computer Graphics Forum, vol. 30, no. 3, pp. 871–880, 2011.