HAL Id: hal-01532304
https://hal.archives-ouvertes.fr/hal-01532304
Submitted on 2 Jun 2017
HAL is a multi-disciplinary open access
archive for the deposit and dissemination of sci-entific research documents, whether they are pub-lished or not. The documents may come from teaching and research institutions in France or abroad, or from public or private research centers.
L’archive ouverte pluridisciplinaire HAL, est destinée au dépôt et à la diffusion de documents scientifiques de niveau recherche, publiés ou non, émanant des établissements d’enseignement et de recherche français ou étrangers, des laboratoires publics ou privés.
colonies involved in almond pollination
Ian Cavigli, Katie F. Daughenbaugh, Madison Martin, Michael Lerch, Katie
Banner, Emma Garcia, Laura M. Brutscher, Michelle L. Flenniken
To cite this version:
Ian Cavigli, Katie F. Daughenbaugh, Madison Martin, Michael Lerch, Katie Banner, et al.. Pathogen prevalence and abundance in honey bee colonies involved in almond pollination. Apidologie, Springer Verlag, 2016, 47 (2), pp.251-266. �10.1007/s13592-015-0395-5�. �hal-01532304�
Ian CAVIGLI1,Katie F. DAUGHENBAUGH1,Madison MARTIN1,Michael LERCH4, Katie BANNER4,Emma GARCIA1,Laura M. BRUTSCHER1,2,3,Michelle L. FLENNIKEN1,2
1
Department of Plant Sciences and Plant Pathology, Montana State University, Bozeman, MT 59717, USA
2
Institute on Ecosystems, Montana State University, Bozeman, MT 59717, USA
3
Department of Microbiology and Immunology, Montana State University, Bozeman, MT 59717, USA
4
Department of Mathematical Sciences, Montana State University, Bozeman, MT 59717, USA Received 25 June 2015–Revised 17 August 2015–Accepted 22 September 2015
Abstract– Honey bees are important pollinators of agricultural crops. Since 2006, US beekeepers have experi-enced high annual honey bee colony losses, which may be attributed to multiple abiotic and biotic factors, including pathogens. However, the relative importance of these factors has not been fully elucidated. To identify the most prevalent pathogens and investigate the relationship between colony strength and health, we assessed pathogen occurrence, prevalence, and abundance in Western US honey bee colonies involved in almond pollination. The most prevalent pathogens were Black queen cell virus (BQCV), Lake Sinai virus 2 (LSV2), Sacbrood virus (SBV),
Nosema ceranae, and trypanosomatids. Our results indicated that pathogen prevalence and abundance were associated with both sampling date and beekeeping operation, that prevalence was highest in honey bee samples obtained immediately after almond pollination, and that weak colonies had a greater mean pathogen prevalence than strong colonies.
honey bee colony health / honey bee viruses / Black queen cell virus / Lake Sinai virus / almond pollination
1. INTRODUCTION
Insects pollinate agricultural crops and plant spe-cies that enhance landscape biodiversity. The value of insect pollination worldwide is $153 billion an-nually, and honey bees (Apis mellifera) are the primary pollinators of US crops valued at over $17 billion per year (Calderone2012; Gallai et al.2009). A striking example of the role of honey bee polli-nators in agriculture is California almond produc-tion, where ~80 % of the world’s almonds are
produced (CAB2014). Honey bees are essential to almond production, and over 60 % of the US com-mercially managed honey bee colonies are involved in almond pollination from late February to early March. In 2013–2014, approximately 1.6 million bee colonies participated in this single pollination event.
Honey bee-mediated pollination is important for agricultural production. Thus, high annual US hon-ey bee colony losses (averaging 33 % since 2006) concern growers, beekeepers, scientists, and policy makers (Spleen et al.2013; Steinhauer et al.2014; van Engelsdorp et al. 2007, 2008,2009, 2012). Although the total number of US commercially managed colonies has remained at around 2.5 mil-lion since the late 1990s, beekeepers must split colonies (i.e., make two colonies from one colony) more frequently in order to make up for higher annual losses (USDA NASS). Typically, the
Electronic supplementary materialThe online version of this article (doi:10.1007/s13592-015-0395-5) contains supplementary material, which is available to authorized users.
Corresponding author: M. Flenniken, michelle.flenniken@montana.edu Manuscript editor: David Tarpy
This article is published with open access at Springerlink.com DOI:10.1007/s13592-015-0395-5
Pathogen prevalence and abundance in honey bee colonies
involved in almond pollination
majority of colony losses occur during the winter months and thus coincide with the almond polli-nation season, though a recent US management survey indicated that 2014 summer losses were also significant (~27.4 %) (Steinhauer et al.
2015). Research to date suggests that multiple biotic and abiotic factors contribute to colony health and survival (e.g., viruses, mites, microbes, bee genetics, weather, forage quality and avail-ability, management practices, and agrochemical exposure) (Calderone2012; Cornman et al.2012; Ellis et al. 2010; Gallai et al. 2009; Nazzi and Pennacchio2014; Pettis and Delaplane2010; van der Zee et al. 2012,2014; van Engelsdorp et al.
2009,2012). Although no single factor is respon-sible for colony losses or colony collapse disorder (CCD), honey bee samples from CCD-affected colonies had greater pathogen (e.g., viruses and
Nosema) prevalence and abundance compared to unaffected colonies (Cornman et al. 2012; Cox-Foster et al.2007; Johnson et al.2009; Steinhauer et al. 2015; van Engelsdorp et al. 2009). In addition, several epidemiologic and temporal monitoring studies have partially attributed colo-ny losses to pathogens (i.e., viruses, bacteria, fungi, trypanosomatids, and mites) (Chen et al.
2014; Cornman et al. 2012; Cox-Foster et al.
2007; Evans and Schwarz 2011; Genersch and Aubert2010; Locke et al.2014; McMenamin and Genersch 2015; Nazzi and Pennacchio 2014; Nielsen et al. 2008; Ravoet et al. 2013; Tentcheva et al. 2004; van Engelsdorp et al.
2009,2012). While these studies are informative, the roles of pathogens in colony mortality and the relationships between colony strength and patho-gen prevalence and abundance have not been fully elucidated.
The majority of honey bee-infecting pathogens are RNA viruses, including Acute bee paralysis virus, Black queen cell virus, Israeli acute paraly-sis virus, Kashmir bee virus, Deformed wing vi-rus, Sacbrood vivi-rus, Chronic bee paralysis virus (reviewed in (Brutscher et al. 2015; Chen and Siede2007; de Miranda et al.2013; Evans and Schwarz 2011; Genersch and Aubert 2010; McMenamin and Genersch 2015), and the Lake S i n a i v i r u s e s ( C o r n m a n e t a l . 2 0 1 2; Daughenbaugh et al.2015; Granberg et al.2013; Ravoet et al. 2013,2015; Runckel et al. 2011).
Longitudinal monitoring of colony health and pathogen prevalence and abundance is critical to determining the role of pathogens in colony losses, yet there have been very few studies of this nature performed in the USA.
To better understand the role of pathogens on honey bee colony health and mortality, we moni-tored colony health (using colony size as a proxy), pathogen prevalence, and pathogen abundance, before, during, and after the 2013–2014 almond pollination season (Delaplane and van der Steen
2013; OSU2011). We utilized polymerase chain reaction (PCR) to test for 16 common honey bee pathogens. The majority of these pathogens were viruses including Lake Sinai virus 1 (LSV1), LSV2, LSV3, LSV4, LSV5, Black queen cell virus (BQCV), Deformed wing virus (DWV), Sacbrood virus (SBV), Acute bee paralysis virus (ABPV), Chronic bee paralysis virus (CBPV), Israeli acute paralysis virus (IAPV), and Kashmir bee virus (KBV). In addition, we tested for bacterial pathogens (i.e.,Paenibacillus larvae
andMelissococcus plutonius) and eukaryotic par-asites including the microsporidia Nosema spp. and trypanosomatids (i.e., Crithidia mellificae SF/Lotmaria passim). Herein, we present data from an observational cohort study at the colony level that provides current information regarding pathogen prevalence and abundance in Western US commercially managed honey bee colonies involved in almond pollination. Enhanced un-derstanding of the dynamics of pathogenic in-fections in bee colonies across different geog-raphies and in independent beekeeping opera-tions will inform ongoing and future epidemi-ologic studies aimed at investigating the poten-tial relationships between colony health and pathogen occurrence, prevalence, and abun-dance on a larger scale (van Engelsdorp et al.
2013). Understanding the role of pathogens and other factors on honey bee health is criti-cal to the development of pollinator manage-ment and conservation strategies that limit an-nual bee colony mortality (Gallant et al. 2014).
2. MATERIALS AND METHODS
Additional details regarding methods are available in the Supplemental Information (Online Resource1).
2.1. Longitudinal monitoring and sampling of commercially managed honey bee colonies
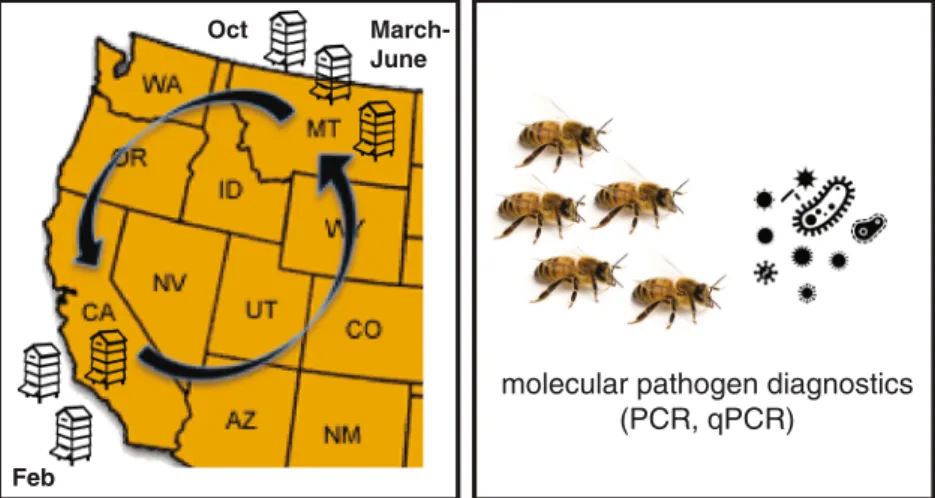
Three Montana-based (Broadwater, Yellowstone, and Treasure counties) commercial beekeeping opera-tions that transport their honey bee colonies ~1,200 miles to California (Merced and Stanislaus counties) each winter for the almond bloom provided honey bee samples before (October–December 2013), during (February 2014), and after (March/April and June 2014) almond pollination (Figure 1 and Supplemental TableS2). Colony health, using colony population size as a proxy, was assessed by the number of frames covered with honey bees (frame counts) at each sampling event (Delaplane and van der Steen
2013; OSU 2011). Colony strength was defined as follows: weak colonies (<5 frames covered with bees), average colonies (6–8 frames covered with bees), and strong colonies (>9 frames covered with bees). Live honey bee samples (~100 per sample) were obtained from the top of the frames in the middle of the colony. Samples were composed of female bees of mixed age, including nurse, worker, and forager bees. The samples were collected on ice or dry ice, stored at −20 °C, shipped on dry ice, and transferred to−80 °C prior to analysis. At the onset of the study in November 2013,
each beekeeper identified 15–20 colonies of differential health. Specifically, operation 3 initiated the study with five weak, five average, and five strong colonies and provided samples at three time points; operation 2 ini-tiated the study with five weak, 13 average, and two strong colonies and provided samples at four time points; and operation 1 initiated the study with five weak, four average, and ten strong colonies and provided samples at four time points (Supplemental TableS2). A total of 176 honey bee samples with corresponding colony strength observations were obtained and analyzed, four observa-tions of colony strength lacked corresponding samples, and eight of the original colonies died during the course of this study (Supplemental TableS2).
2.2. Honey bee samples
Five female bees from each sample were used for RNA extraction, cDNA synthesis, pathogen-specific PCR, and qPCR. The objective for path-ogen screening was to identify the most prevalent pathogens associated with honey bees sampled from individual colonies at each sampling event. Based on empirical data, literature values, and practical sample handling considerations, we assayed five bees per colony per sampling event. The following equation
molecular pathogen diagnostics (PCR, qPCR)
Oct
Feb
March-June
Figure 1.Longitudinal monitoring of commercially managed honey bee colonies, before, during, and after the 2014 almond pollination season. Honey bee colonies (n=54) from three Montana-based commercial beekeeping opera-tions were monitored before (October–November 2013), during (February 2014), and after (March–April); after 2 (June) almond pollination in California. Colony strength was measured at each sampling event. PCR was utilized to detect pathogens associated with each sample, and qPCR was utilized to determine the abundance of pathogens associated with a subset of samples (Supplemental TableS2).
from Pirk et al. (2013),N=ln(1−D)/ln(1−P) (N= sam-ple size, ln = natural logarithm,D = probability of detection,P= proportion of infected bees), predicts that with a sample size of five bees, pathogenic infections affecting 45 % or more of the individuals within a colony would be detected with 95 % probability (Pirk et al.2013); this sample size has been proven sufficient for the pathogen-specific PCR detection of highly prev-alent pathogens (Daughenbaugh et al.2015; Runckel et al.2011).
2.3. RNA isolation
Bee samples were homogenized in water using beads (3 mm) and a TissueLyzer (Qiagen) at 30 Hz for 2 min. Samples were centrifuged for 12 min at 12,000×g
at 4 °C to pellet debris, and RNA from supernatants w a s e x t r a c t e d u s i n g T R I z o l r e a g e n t ( L i f e Technologies) according to the manufacturer’s in-structions (Runckel et al.2011).
2.4. Reverse transcription/cDNA synthesis
cDNA synthesis reactions were performed by incu-bating 1,000–2,000 ng total RNA, Moloney murine leukemia virus (M-MLV) reverse transcriptase (Promega), and 500 ng random hexamer primers (IDT) for 1 h at 37 °C, according to the manufacturer’s instructions (Runckel et al.2011).
2.5. Polymerase chain reaction (PCR)
PCR was performed according to standard methods using the primers listed in Supplemental Table S1
(Runckel et al.2011). In brief, 1μL cDNA template was combined with 10 pmol of each forward and reverse primer and amplified with ChoiceTaq poly-merase (Denville) according to the manufacturer’s in-structions using the following cycling conditions: 95 °C for 5 min; 35 cycles of 95 °C for 30 s, 57 °C for 30 s, and 72 °C for 30 s, followed by final elongation at 72 °C for 4 min. The PCR products were visualized by gel electrophoresis/fluorescence imaging.
2.6. Quantitative PCR (qPCR)
Quantitative PCR was used to analyze the rel-ative abundance of the most prevalent pathogens,
which were all RNA viruses, in select samples to investigate the relationship between virus abun-dance and honey bee colony health. Five hundred nanograms of RNA from each of these samples was reverse transcribed with M-MLV as described above. All qPCR reactions were performed in triplicate with a CFX Connect Real Time instru-ment (BioRad); reaction conditions and equations for determining the relative abundance based on standard curves are provided in supplemental methods (Online Resource 1).
2.6.1. Statistical analysis of PCR
For this study, we use Bpathogen prevalence^ to refer to the total number of pathogens detected by PCR out of a target list of 16. Though our interest was in the relationship between strength rating and pathogen prevalence, graphical analyses indicated that there were likely relationships be-tween pathogen prevalence and sampling time as well as between strength and sampling time. Thus, we used a Poisson log-linear regression model and accounted for an interaction between sample date (time period), beekeeping operation, colony strength, and pathogen prevalence. Observations with average strength rating were not included in some analyses to simplify the inferences between strong (S) and weak (W). The natural logarithm (ln) of the pathogen prevalence data was used in comparisons between each beekeeping operation and time period combination (Pirk et al. 2013). For the model, we used beekeeping operation 1, before almond pollination (time period 1), and weak colonies as the base level.
In all, our model can be expressed
yi∼Poissonð Þμi
logð Þ ¼μi β0þβ1operation 2iþ β2operation 3iþβ3ðS: period 1Þiþ
β4ðW : period 2Þiþβ5ðS : period 2Þiþ
β6ðW : period 3Þiþβ7ðS : period 3Þiþ
β8ðW : period 4Þiþβ9ðS : period 4Þi & whereyi= the total abundance/prevalence for the
& Operation2i=1 if observationicame from
beekeep-ing operation 2 and 0 otherwise.
& Operation3i=1 if observationicame from
beekeep-ing operation 3 and 0 otherwise.
& Period 2i=1 if observationiwas taken during and 0
otherwise.
& Period 3i=1 if observationi was taken after
polli-nation and 0 otherwise.
& Period 4i=1 if observationi was taken in the
sec-ond after pollination sampling time and 0 otherwise.
& Ai=1 if observation i was average (colony
strength) and 0 otherwise.
& Si=1 if observationi was strong (colony strength)
and 0 otherwise.
2.6.2. Statistical analysis of qPCR
The relationship between colony strength rating and pathogen abundance was evaluated using a log-normal regression to model the total abun-dance with the predictor of interest, strength rat-ing, while also accounting for the different bee-keeping operations and the sampling time period. To evaluate if the relative abundance of the most prevalent pathogens, which were all (+) sense RNA viruses (i.e., BQCV, SBV, LSV1, and LSV2), we utilized virus copy number as an indi-cation of infection severity, though the relation-ship between virus copy number and virus asso-ciated disease or affects on the honey bee host are largely unknown (de Miranda et al. 2013). Pathogen abundance was defined as the summed abundance of the RNA virus genome copy num-bers, which were measured by qPCR. Samples that did not test positive for the virus by PCR were not assessed by qPCR and given a value of zero. In total, there were 53 observations of total abundance after inputting zeros for negative PCR tests. A log-linear regression was used to model the total abundance with the predictor of interest, strength rating, while also accounting for the dif-ferent beekeeping operations and the sampling time period; 1 was added to each observation since some observations had 0 total abundance. Some bee colonies were measured multiple times in the 53 observations. We accounted for these repeated measures on colonies with a random
effect for colony, but found the variance between colonies to be minimal compared to the overall variance.
logð Þ ¼yi β0þβ1operation 2iþ
β2operation 3iþβ3period 2iþ
β4period 3iþβ5period 4iþ
β6Siþβ7Aiþγj ið Þþϵi
here γj(i)is the random effect for colony. We
assume γj(i)∼N(0,σ2colony), ϵi∼N(0,σ2y), and γj(i) and ϵi are independent for all
j=1,2,…,60, i=1,2,3,…,180. Variables are de-f i n e d a s t h e y w e r e i n S e c t i o n 2 . 6 . 1. Coefficients of interest for this study are β0, β6, and β7. Estimated means and
stan-dard errors for these coefficients of interest were obtained using the regression output. Models were fit using the software R (Core Team 2014), the package lme4 was used for the mixed model described in Section 2.6.1
(Bates et al. 2015). 3. RESULTS
3.1. Honey bee colony monitoring and pathogen diagnostics
Commercially managed colonies from three Montana-based beekeeping operations were mon-itored before, during, and after the almond polli-nation season (i.e., October 2013 to June 2014). Colony population size was utilized as a proxy for colony health and monitored at each sampling event. At the onset of the study, each beekeeping operation selected weak, average, and strong hon-ey bee colonies that were monitored throughout the study. These colonies were located in Montana before and after almond pollination and in California during the almond pollination season (February 2014) (Figure 1). Honey bee colony strength, pathogen prevalence, and abundance were monitored throughout the study.
3.1.1. Pathogen detection
To identify the pathogens associated with the honey bee samples collected over the course of this study, we utilized PCR to test for a suite of 16
common pathogens. The majority of these patho-gens were viruses including Lake Sinai virus 1 (LSV1), LSV2, LSV3, LSV4, LSV5, Black queen cell virus (BQCV), DWV, SBV, ABPV, CBPV, IAPV, and KBV. In addition, we tested for bacte-rial pathogens (i.e.,P. larvae and M. plutonius) a n d e u k a r y o t i c p a r a s i t e s i n c l u d i n g t h e microsporidiaNosema spp. and trypanosomatids (i.e., C. mellificae SF /L. passim). In order to identify the most prevalent pathogens associated with each sample (i.e., affecting 45 % or more of the individuals within a colony), five bees per sample were utilized for pathogen analyses (Daughenbaugh et al. 2015; Pirk et al. 2013). Pathogen-specific PCR was performed to identify the pathogens associated with each sample ( S u p p l e m e n t a l Ta b l e s S 1 a n d S 2 a n d Supplemental Figures S1andS2). In this work, we use Bpathogen occurrence^ to indicate the frequency of detecting a specific pathogen as a percentage of the total number of positive tests, Bpathogen prevalence^to indicate the number of different pathogens detected in a sample, and Btotal pathogen abundance^to describe the total number of pathogen genome copies in select samples.
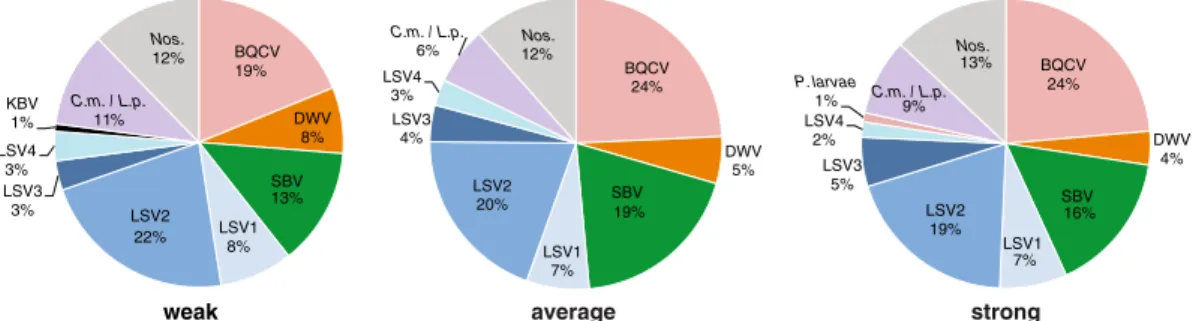
To identify the most common pathogens de-tected in this study, we calculated the occurrence of each pathogen as a percentage of the total number of positive tests for each colony strength category (Figure2). Throughout this study, 176 samples with corresponding colony strength observations were obtained (Supplemental Table S2). Colony strength observations were unevenly distributed between weak, average, and strong colony ratings (i.e., weak colony strength was observed at 41 sampling events, average colony strength was observed at 54 sampling events, and strong colony strength was observed at 81 sampling events). In addi-tion, the total number of pathogen-specific PCR tests varied with each category. Specifically, weak colonies had 122 positive tests, average colonies had 178 positive tests, and strong colo-nies had 292 positive tests. Therefore, on aver-age across all sampling dates, weak colonies had 2.98 pathogens per sample, average strength col-onies had 3.30 pathogens per sample, and strong colonies had 3.60 pathogens per sample. The
occurrence (frequency of detection) varied by pathogen (Figure 2). The most readily detected pathogens in this sample cohort were the Lake Sinai viruses (LSV1, LSV2, LSV3, and LSV4), which accounted for 36 % of the total positive tests in weak colonies, 34 % in average colonies, and 33 % in strong colonies (Figure2). Overall, the most frequently detected pathogens were B Q CV, L S V2 , S B V, Nosema ceran ae,
C. mellificae / L. passim, and LSV1 (Figure 2). Graphical analyses of pathogen prevalence vs. colony strength rating and time revealed that each beekeeping operation had different pathogen prevalence levels and that the rela-tionship between colony strength and pathogen prevalence varied at different sampling times (Figure 3). For example, the mean pathogen prevalence was in general greater in samples obtained immediately after almond pollination (after) for all beekeeping operations, but the differences were more striking for beekeeping operations 1 and 3 (Figure 3). In general, pathogen prevalence was largest in the samples obtained after almond pollination and lowest in samples obtained during almond pollination for all operations (Figure 3, Supplemental Table S2, and Supplemental Figures S1 and
S2).
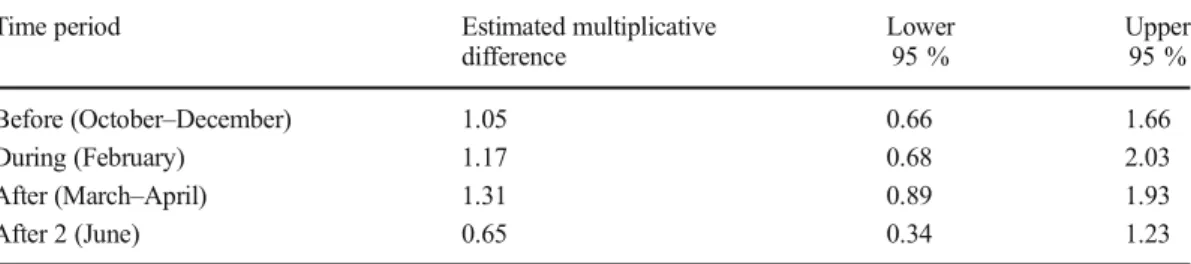
To examine the relationship between colony strength and pathogen prevalence, a Poisson log-linear regression was used to compare the mean number of pathogens present in strong vs. weak colonies (Table I). This model accounted for potential differences in each bee-keeping operation, as well as the potential interaction between time period and colony strength. The analyses presented herein are fo-cused on comparisons between weak and strong colonies. The natural logarithm (ln) of the pathogen prevalence data was used in com-parison between the mean pathogen prevalence in weak and strong colonies for each beekeep-ing operation at each samplbeekeep-ing event (Pirk et al. 2013). A statistical model was used to calculate the estimated differences between the pathogen prevalence in weak and strong honey bee colonies and associated confidence inter-vals, based on the standard errors of the dif-ferences, given the covariates (Table I,
Section 2). For the majority of the sampling dates, the relationship between pathogen prev-alence and colony strength indicated that weak colonies had slightly greater pathogen preva-lence than strong colonies (i.e., multiplicative differences >1), whereas this trend was re-versed in the last sampling period, (i.e., after two had a multiplicative difference <1) (Table I). However, these observed trends could not be differentiated from the expected variation. The largest, though non-significant, difference between the mean number of patho-gens in weak colonies, as compared to strong colonies, after accounting for beekeeper, oc-curred immediately after almond pollination (Table I). Samples obtained from weak colo-nies directly after almond pollination (March– April) had an estimated 31 % larger mean pathogen number than strong colonies, with an associated 95 % confidence interval of 11 % less to 93 % more after accounting for beekeeping operation (Table I). In addition to mean pathogen prevalence, we investigat-ed if particular pathogens were present at a higher proportion in colonies of different strengths (i.e., weak, strong, and average) (Supplemental Figure S2). This summary is
a useful overall representation of the data, but since the results for each pathogen seem to depend solely upon the sampling date, we could not make statistical claims regarding the apparent association of any pathogen with colony strength.
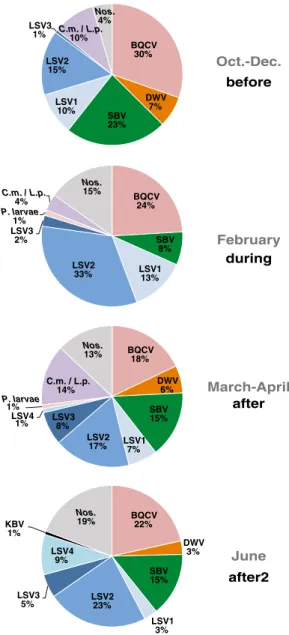
To determine which pathogens were most common at each time point, we calculated the percent occurrence of each pathogen (Figure 4). The total number of pathogen-specific PCR positive tests varied for each time period. Specifically, there were 155 positive tests in bee samples collected before almond tion, 79 positive tests during almond pollina-tion, 223 positive tests immediately after al-mond pollination, and 130 positive tests from 20 colonies that were sampled in June. This representation of the data indicates that BQCV, LSV2, and SBV were more common than other honey bee pathogens including DWV,
N. ceranae, LSV3, C. mellificae/L. passim,
P. larvae, and KBV. The relative percentages of each pathogen vary with the time of sam-pling (e.g., LSV2 reached peak detection levels during almond pollination); however, pathogen occurrence also varied for each beekeeping op-eration (Supplemental Figure S1).
BQCV 24% DWV 4% SBV 16% LSV1 7% LSV2 19% LSV3 5% LSV4 2% P. larvae 1% C.m. / L.p.9% Nos. 13% BQCV 19% DWV 8% SBV 13% LSV1 8% LSV2 22% LSV3 3% LSV4 3% KBV 1% C.m. / L.p. 11% Nos. 12% strong weak BQCV 24% DWV 5% SBV 19% LSV1 7% LSV2 20% LSV3 4% LSV4 3% C.m. / L.p. 6% 12% Nos. average
Figure 2.Distribution of honey bee pathogens detected in weak, average, and strong colonies. Honey bee samples were obtained from monitor colonies from October 2013 to June 2014. PCR was used to test for 16 honey bee-infecting pathogens including viruses (ABPV, BQCV, CBPV, DWV, IAPV, KBV, SBV, LSV1, LSV2, LSV3, LSV4, and LSV5, microsporidia (N. ceranae), bacteria (P. larvae andM. plutonius), and trypanosomatids (C.m./L.p.). The pathogen occurrence in weak (<5 frames;n=41), average (six to eight frames), or strong (>9 frames;n=81) honey bee colonies is shown as a percentage of the total number of pathogens detected by PCR. The percent pathogen occurrence for each colony strength rating is as follows: weak (BQCV 19 %, DWV 8 %, SBV 13 %, LSV1 8 %, LSV2 22 %, LSV3 3 %, LSV4 3 %, KBV 1 %,C.m./L.p. 11 %,N. ceranae 12 %), average (BQCV 24 %, DWV 5 %, SBV 19 %, LSV1 7 %, LSV2 20 %, LSV3 4 %, LSV4 3 %,C.m./L.p.6 %,N. ceranae12 %), and strong (BQCV 24 %, DWV 4 %, SBV 16 %, LSV1 7 %, LSV2 19 %, LSV3 5 %, LSV4 2 %,P. larvae1 %,C.m./L.p.9 %,
0 1 2 3 4 5 6 7 8 9
before during after after 2
Operation 1 0 1 2 3 4 5 6 7 8 9 Operation 2 number of pathogens 0 1 2 3 4 5 6 7 8 9 Operation 3 strong average weak C1 C2 C2 C3C4 C4 C1 C1 C2 C3 C3 C4 C5 C5 C5 C6 C6 C7 C6 C7 C7 C8 C8 C8 C9 C9 C9 C10 C10 C10 C12 C12 C12 C11 C11 C11 C13 C14 C15 C18 C16 C17 B4 B4 B1 B1 B3 B3 B5 B6 B6 B7 B7 B8 B9B10B12B13B14 B13 B14 B15 B15 B16 B16 B17 B17 B17 B19 A7 A7 A7 A9 A7 A9 A10 A11 A12 A13 A14 A15 A16 A17 A18 A19 A20 A25 A11 A12 A15 A17 A19 A20 A23 A10 A8 A9 A10 A11 A13 A14 A15 A16 A17 A18 A19 A20 A23 A25 A12 A8 A9 A10 A11 A12 A13 A14 A15 A17 A18 A19 A20 A21 A22 A23 A25 A24 A16 B18 B18 B20 B21 B21 B11 B3 B3 B1 B1 B4 B4 B5 B5 B5 B6 B6 B8 B8 B8 B10 B10 B10 B11 B21 B11 B14 B14 B15 B15 B16 B16 B9 B9 B9 B7 B7 B12 B12 B12 B17 B13 B24 B25 B13 B19 B19 B20 B20 B21 B22 B23
Oct.-Dec. February March-April June
3.1.2. Pathogen abundance
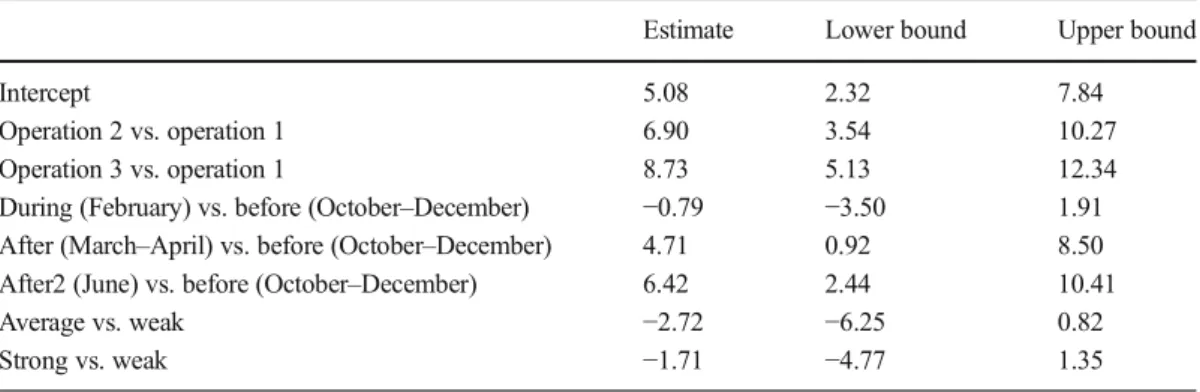
To examine if total pathogen abundance was associated with colony strength, we per-formed qPCR for the most commonly detect-ed pathogens in our sample cohort, which were all RNA viruses (i.e., BQCV, LSV2, LSV1, and SBV) (Supplemental Table S2). In total, there were 53 observations of total abundance with values that ranged from 0 to 1.19×10¹¹; total pathogen abundance values were log natural (ln) transformed after adding 1 (Figure 5). We used log-linear regression to model the total abundance with the predictor of interest, strength rating, while also ac-counting for the different beekeeping opera-tions and the sampling time period and de-termined that the variance among colonies was minimal compared to the overall vari-ance (estimates and their associated confi-dence intervals provided (Table II)).
3.1.3. Colony mortality
The overall colony mortality in this study was 14.8 %. Colony loss varied with the time of sampling and beekeeping operation (Table III). Colony mortality was greatest dur-ing almond pollination, durdur-ing which 13 % of the colonies died. Colony mortality varied by beekeeping operation; specifically, operation 2 experienced only 5.0 % loss, operation 1 had 15.8 % loss, and operation 3 experienced 20 % loss during almond pollination. Colony losses in this sample cohort were less than average US colony losses, which have been ~33 % since 2006 (Steinhauer et al. 2015).
4. DISCUSSION
Honey bees play an important role as pollina-tors of numerous agricultural crops. The majority of commercially managed honey bee colonies in the US are transported throughout the year to meet the pollination demands of crops including California almond production. Commercial bee-keepers in the US and some parts of Europe have experienced high annual average losses, though the factors most responsible for these losses are not well understood. The objectives of this study were to identify the pathogens currently circulat-ing in Western US-based commercial honey bee colonies involved in almond pollination and to examine the relationship between colony strength, pathogen prevalence, and abundance. Pathogen
Table I.Estimated multiplicative difference in pathogen prevalence from strong to weak colonies in designated sampling period.
Time period Estimated multiplicative
difference
Lower 95 %
Upper 95 %
Before (October–December) 1.05 0.66 1.66
During (February) 1.17 0.68 2.03
After (March–April) 1.31 0.89 1.93
After 2 (June) 0.65 0.34 1.23
Figure 3.Colony health and pathogen prevalence before, during, and after almond pollination for each beekeeping operation. Honey bee samples were obtained from monitor colonies from October 2013 to June 2014. PCR was used to test for 16 honey bee-infecting pathogens. Pathogen prev-alence (y-axis) refers to the number of different pathogens detected in a sample. Colony strength was monitored as a proxy for colony health; weak (<5 frames), average colo-nies (6–8 frames), or strong (>9 frames). Each colony was assigned a unique identifier (e.g.,“C1”for colony number 1 in beekeeping operation 3); icon size and shape were used to graphically illustrate colony strength over the course of the study (x-axis).incidence and abundance have been associated with CCD-affected colonies and colony losses in the US (Chen et al.2014; Cornman et al.2012; Cox-Foster et al. 2007; Daughenbaugh et al.
2015; Li et al. 2013; van Engelsdorp et al.
2009), Canada (van der Zee et al.2012), Austria (Berényi et al. 2006), Denmark (Nielson et al.
2008), Luxembourg (Clermont et al. 2014) and Belgium (Ravoet et al.2013). Therefore, we hy-pothesized that weak colonies would harbor a greater number of pathogens, as well as have
greater loads of these pathogens. Surprisingly, there have been few honey bee colony monitoring studies in the US; therefore, the data presented herein provide an important examination of colo-ny health and pathogen prevalence and abundance in Western US-based honey bee colonies involved in almond pollination.
There are multiple biotic and abiotic factors that contribute to honey bee colony health and survival. The focus for this study was pathogen prevalence and abundance, since several studies indicate that pathogens affect colony health. Specifically, one US-based study that compared multiple variables in CCD and non-CCD-affected colonies determined that weak or dead colonies were more likely to neighbor other weak or dead colonies and that CCD-affected samples had a higher pathogen incidence than controls, whereas pesticide levels were
before after2 after during June March-April February Oct.-Dec. BQCV 30% DWV 7% SBV 23% LSV1 10% LSV2 15% LSV3 1% C.m. / L.p.10% Nos. 4% BQCV 24% SBV 8% LSV1 13% LSV2 33% LSV3 2% P. larvae 1% C.m. / L.p. 4% Nos. 15% BQCV 18% DWV 6% SBV 15% LSV1 7% LSV2 17% LSV3 8% LSV4 1% P. larvae 1% C.m. / L.p. 14% Nos. 13% BQCV 22% DWV 3% SBV 15% LSV1 3% LSV2 23% LSV3 5% LSV4 9% KBV 1% Nos. 19%
Figure 4.Distribution of honey bee pathogens detected in colonies before, during, and after almond pollination. Hon-ey bee samples were obtained from monitor colonies from October 2013 to June 2014. PCR was used to test for 16 honey bee-infecting pathogens including: viruses (ABPV, BQCV, CBPV, DWV, IAPV, KBV, SBV, LSV1, LSV2, LSV3, LSV4, and LSV5, microsporidia (N. ceranae), bac-teria (P. larvae andM. plutonius), and trypanosomatids (C.m./L.p.). Pathogen occurrence, the frequency of detect-ing a specific pathogen as a percentage of the total number of positive tests, was assessed at different time periods throughout the study. There were 155 positive tests in bee samples collected before almond pollination (October– De-cember 2013), 79 positive tests during almond pollination (February), 223 positive tests immediately after almond pollination (March–May), and 130 positive tests from 20 colonies that were sampled in June 2014.Figure 5.Colony health and pathogen abundance before, during, and after almond pollination for each beekeeping operation. Honey bee samples were obtained from monitor colonies from October 2013 to June 2014. Quantitative PCR (qPCR) was used to determine the abundance of BQCV, LSV2, LSV1, and SBV; total pathogen abundance is the sum of these values (y-axis = log natural of total pathogen abundance). In total, there were 53 observations of total abundance in a subset of samples analyzed by qPCR. Each sample is represented by its unique colony identifier (e.g.,“C4”for colony number 4 in beekeeping operation 3); icon size and shape were used to graphically illustrate colony strength over the course of the study, October 2013–June 2014 (x-axis).
comparable (van Engelsdorp et al. 2009). Similarly, metagenomic analysis of those
samples suggested that IAPV abundance was related to colony health (Cox-Foster et al.
0 5 10 15 20 25
before during after after 2
Operation 1 0 5 10 15 20 25 Operation 2 log(number of pathogens + 1) 0 5 10 15 20 25 Operation 3 weak average strong
Oct.-Dec. February March-April June
C4 C5 C11 C12 C13 C14 C4 C5 C11C12 C5 C4 C11 C12 B1 B5 B6 B15 B16 B18 B1 B5 B6 B15 B16 B13 A7A8 A13 A16 A20 A21 A22 A25 A7 A8 A20 A25 A14 A15 A17 A18 A19 A23 A7 A7 B1 B5 B1 B5 B6 B15 B16
2007), though later studies indicated that path-ogen number, DWV, and a combination of other pathogens were more positively correlat-ed with CCD-affectcorrelat-ed colonies (i.e., ABPV,
N osema apis, KBV, LSV1, and LSV2) (Chen and Evans 2007; Johnson et al. 2009; Cornman et al. 2012). More recently, a study that involved ten colonies determined that IAPV was more abundant in colonies with less food stores and less brood/developing bees (Chen et al. 2014). In addition, data from a small-scale monitoring project that also in-volved only ten colonies suggested that LSV2, LSV1, BQCV, and N. ceranae were more abundant in weak colonies, as com-pared to strong colonies (Daughenbaugh et al. 2015). Though the exact cause(s) of CCD and colony loss remain unknown, these US-based studies suggest that pathogens are an important factor.
Longitudinal monitoring studies are required to understand the key factors affecting honey bee colony losses. These studies help to establish a baseline for typical pathogen incidence and abun-dance in honey bee colonies throughout the year. The most prevalent pathogens detected in this study were BQCV, LSV2, SBV,N. ceranae, and
C. mellificae / L. passim. Lake Sinai viruses (i.e., LSV2, LSV1, LSV3, and LSV4) accounted for a large proportion of the positive tests. One of the first US-based longitudinal monitoring studies in-volved 20 colonies managed by a single large-scale commercial beekeeping operation (Runckel et al. 2011). This study indicated that pathogen status within healthy colonies is dynamic and seasonal, and it and other studies have indicated that several samples, obtained at specified time intervals, provide a more accurate depiction of colony health than a single time point. Longitudinal sampling and analysis revealed
Table II. Estimated multiplicative differences in the pathogen abundance between beekeeping operations, at different sampling time periods, and between colonies of different strengths; natural log scale.
Estimate Lower bound Upper bound
Intercept 5.08 2.32 7.84
Operation 2 vs. operation 1 6.90 3.54 10.27
Operation 3 vs. operation 1 8.73 5.13 12.34
During (February) vs. before (October–December) −0.79 −3.50 1.91
After (March–April) vs. before (October–December) 4.71 0.92 8.50
After2 (June) vs. before (October–December) 6.42 2.44 10.41
Average vs. weak −2.72 −6.25 0.82
Strong vs. weak −1.71 −4.77 1.35
Table III.Percentage of honey bee colony mortality by beekeeping operation and time period.
Time period/date Beekeeping operation Before (October–December) During (February) After (March–April)
After2 (June) Overall
Operation 3 0 % 20.0 % 0 % 0 % 20.0 %
Operation 2 0 % 5.0 % 0 % 0 % 5.0 %
Operation 1 0 % 15.8 % 6.7 % 0 % 21.1 %
increased incidence of particular viruses in most colonies within short time periods, resulted in the discovery of the Lake Sinai viruses, and facilitated the isolation and sequencing of a honey bee-infecting trypanosomatid (originally designated
C. mellificae,strain SF but recently re-classified and re-named L. passim (Runckel et al. 2011,
2014; Schwarz et al.2015). However, monitored honey bee colonies remained healthy throughout the study, so it did not provide the sample cohort required to associate pathogens with health status and disease. Similarities between the results of the 2009–2010 sample cohort (Runckel et al.2011) and the 2013–2014 sample cohort described here-in here-include high prevalence of LSVs, particularly LSV2 during almond pollination, low occurrence of DWV, IAPV, and KBV, and frequent detection of BQCV and SBV. In general, pathogen preva-lence was largest in the samples obtained after almond pollination and lowest in samples obtain-ed during almond pollination for all operations; this observation may stem from the seasonality of pathogenic infections (Chen and Siede 2007; Evans and Schwarz2011; Runckel et al.2011).
US-wide surveys, including those per-formed by the Bee Inper-formed Partnership, provide an important overview of the status of colonies and pathogens (reviewed in Steinhauer et al. 2015). However, these sur-veys rely on voluntary sample submission over the course of the year and are not sufficiently controlled to investigate subtle relationships between colony health and par-ticular biotic or abiotic factors. Monitoring projects outside of the US are informative and serve as models for future studies. The German Bee Monitoring project is an excel-lent example of a longitudinal monitoring study that assessed the role of management practices, pathogens, pesticides, and environ-mental factors, in periodic high winter losses of honey bee colonies over a period of 4 years (Genersch et al. 2010; Gisder et al.
2010). That study identified several factors that were significantly related to honey bee colony loss including high levels of Varroa destructor mites, queen age, DWV and ABPV infection, and weak colony strength
rating in autumn (Genersch et al. 2010). Likewise, the prevalence and seasonal varia-tion of virus infecvaria-tions and mite infestavaria-tion was assessed in a 1-year country-wide study in France that involved 360 honey bee colo-nies from 36 apiaries sampled in the spring, summer, and autumn (Tentcheva et al. 2004). PCR was used to assess the incidence of six bee viruses; DWV was the most prevalent followed by BQCV and SBV, and the detec-tion frequency varied over the course of the year (Tentcheva et al.2004). Recently, the distributions of ABPV, BQCV, CBPV, DWV, SBV across all districts of Croatia were examined to provide an epidemiological baseline (Gajger et al. 2014). DWV was the most readily detected virus, where-as KBV and IAPV were not detected (Gajger et al.
2014). Several studies indicate that the combina-tion of DWV infeccombina-tion and V. destructor mite infestation negatively affect colony health (reviewed in Nazzi et al.2012). DWV prevalence was very low in our study, thus its relationship with colony health could not be assessed.
The results from this cohort study indi-cate that the relationship between pathogen incidence and abundance is complex and dependent upon beekeeping operation and sampling time. The data presented herein are similar to other studies in that they do not rule out a relationship between colony strength and pathogen prevalence. Large variability in this data set suggests that fu-ture studies should include larger sample sizes, involve more beekeeping operations, and incorporate standardized management practices. Colony mortality in this study was lower than the average losses calculated from recent US national survey data (14.8 % vs. 33 % respectively), though the reason(s) for low colony mortality remain unknown. Future studies that closely monitor addition-al factors, such as foraging success and di-versity via pollen traps, agrochemical expo-sure via chemical analysis, and mite abun-dance, in conjunction with colony health and pathogen prevalence and abundance will help elucidate the factors that most correlate with colony health and survival.
ACKNOWLEDGMENTS
This work was supported in part by Montana Depart-ment of Agriculture Specialty Crop Block Grant Program (1450687), National Institutes of Health IDeA Program COBRE grant GM110732, National Science Foundation EPSCoR NSF-IIA-1443108, the Montana State University Agricultural Experiment Station, and ProjectApis m. Ian Cavigli, Madison Martin, and Emma Garcia received sup-port from the Howard Hughes Medical Institute Under-graduate Scholars Program (52006931), Michael Lerch and Katie Banner were supported by the National Institute of General Medical Sciences of the National Institutes of Health (P20GM103474), and Laura M. Brutscher is sup-ported by a Honey Bee Biology Fellowship funded by ProjectApis m. The Flenniken laboratory is also supported by USDA-NIFA (2015-67014-23284), the National Hon-ey Board, and the Montana State Beekeepers Association. We would like to thank members of the Flenniken labora-tory (Elisa Boyd and William Glenny) for reviewing this manuscript prior to publication, Dr. Megan D. Higgs (De-partment of Mathematical Sciences, Montana State Uni-versity) for assistance with statistical analyses, and mem-bers of the Montana State Beekeepers Association for honey bee samples.
Author contributions MLF conceived and designed ex-periments. IC, KFD, MM, and EG performed exex-periments. IC, ML, KB, and MLF analyzed the data. MLF, IC, ML, KB, LMB, and EG wrote the paper.
Conflict of interest The authors declare that they have no competing interests.
Open Access This article is distributed under the terms of the Creative Commons Attribution License which permits any use, distribution, and reproduction in any medium, provided the original author(s) and the source are credited.
Fréquence et abondance de pathogènes dans les colonies d'abeilles utilisées pour la pollinisation des amandiers
santé des abeilles / virus / BQCV / LSV /Apis mellifera/ pollinisation arbre fruitier / Etats-Unis
Abundanz und Prävalenz von Krankheitserregern in zur Bestäubung von Mandelbäumen eingesetzten Bienenvölkern
Gesundheit von Bienenvölkern / Viren der Honigbiene / Black queen cell Virus / Lake Sinai Virus / Bestäubung von Mandelbäumen
REFERENCES
Bates, D., Maechler, M., Bolker, B., Walker, S. (2015) PackageBlme4.^
Berényi, O., Bakonyi, T., Derakhshifar, I., Köglberger, H., Nowotny, N. (2006) Occurrence of six honeybee vi-ruses in diseased Austrian apiaries. Appl Environ Microbiol72, 2414–2420
Brutscher, L.M., Daughenbaugh, K.F., Flenniken, M.L. (2015) Antiviral defense mechanisms in honey bees. Curr Opin Insect Sci . doi:10.1016/j.cois.2015.04.016
Calderone, N.W. (2012) Insect pollinated crops, insect pol-linators and US agriculture: trend analysis of aggregate data for the period 1992–2009. PLoS ONE7, e37235. doi:10.1371/journal.pone.0037235
California ABO Almond Almanac 2014
Chen, Y., Evans, J.D. (2007) Historical presence of Israeli acute paralysis virus in the United States. Am Bee J
147, 1027–1028
Chen, Y.P., Siede, R. (2007) Honey bee viruses. In: Ad-vances in virus research. Elsevier, pp 33–80 Chen, Y.P., Pettis, J.S., Corona, M., Chen, W.P., Li, C.J.,
et al. (2014) Israeli acute paralysis virus: epidemiology, pathogenesis and implications for honey bee health. P L o s P a t h o g 1 0, e 1 0 0 4 2 6 1 . d o i :1 0 . 1 3 7 1 / journal.ppat.1004261
Clermont, A., Eickermann, M., Kraus, F., Georges, C., Hoffmann, L., Beyer, M. (2014) A survey on some factors potentially affecting losses of managed honey bee colonies in Luxembourg over the winters 2010/ 2011 and 2011/2012. J Apic Res53, 43–56 Core Team R (2014) R: a language and environment for
statistical computing. R Foundation for Statistical Computing, Vienna
Cornman, R.S., Tarpy, D.R., Chen, Y., Jeffreys, L., Lopez, D., Pettis, J.S., van Engelsdorp, D., Evans, J.D. (2012) Pathogen webs in collapsing honey bee colonies. PLoS ONE7, e43562. doi:10.1371/journal.pone.0043562
Cox-Foster, D.L., Conlan, S., Holmes, E.C., Palacios, G., Evans, J.D., et al. (2007) A metagenomic survey of microbes in honey bee colony collapse disorder. Sci-ence318, 283–287
Daughenbaugh, K.F., Martin, M., Brutscher, L.M., Cavigli, I., Garcia, E., Lavin, M., Flenniken, M.L. (2015) Hon-ey bee infecting Lake Sinai viruses. Viruses7, 3285– 3309
de Miranda, J.R., Bailey, L., Ball, B.V. (2013) Standard methods for virus research inApis mellifera. J. Apic. Res.52(4). doi:10.3896/IBRA.1.52.4.22
Delaplane, K.S., van der Steen, J. (2013) Standard methods for estimating strength parameters ofApis mellifera
c o l o n i e s . J A p i c R e s 5 2( 1 ) . d o i :1 0 . 3 8 9 6 / IBRA.1.52.1.03
Ellis, J.D., Evans, J.D., Pettis, J. (2010) Colony losses, managed colony population decline, and colony col-lapse disorder in the United States. J Apic Res49, 134–136
Evans, J.D., Schwarz, R.S. (2011) Bees brought to their knees: microbes affecting honey bee health. Trends Microbiol19, 614–620
Gajger, I.T., Kolodziejek, J., Bakonyi, T., Nowotny, N. (2014) Prevalence and distribution patterns of seven different honeybee viruses in diseased colonies: a case study from Croatia. Apidologie45, 701–706 Gallai, N., Salles, J.-M., Settele, J., Vaissière, B.E. (2009)
Economic valuation of the vulnerability of world agri-culture confronted with pollinator decline. Ecol Econ
68, 810–821
Gallant, A.L., Euliss, N.H., Browning, Z. (2014) Mapping large-area landscape suitability for honey bees to as-sess the influence of land-use change on sustainability of national pollination services. PLoS ONE9, e99268. doi:10.1371/journal.pone.0099268
Genersch, E., Aubert, M. (2010) Emerging and re-emerging viruses of the honey bee (Apis mellifera
L.). Vet Res41, 54. doi:10.1051/vetres/2010027
Genersch, E., von der Ohe, W., Kaatz, H., Schroeder, A., Otten, C., et al. (2010) The German bee monitoring project: a long term study to understand periodically high winter losses of honey bee colonies. Apidologie
41, 332–352
Gisder, S., Hedtke, K., Moeckel, N., Frielitz, M.-C., Linde, A., Genersch, E. (2010) Five-year cohort study of Nosema spp. in Germany: does climate shape viru-lence and assertiveness ofNosema ceranae? Appl Environ Microbiol76, 3032–3038
Granberg, F., Vicente-Rubiano, M., Rubio-Guerri, C., Karlsson, O.E., Kukielka, D., Belák, S., Sánchez-Vizcaíno, J.M. (2013) Metagenomic detection of viral pathogens in Spanish honeybees: co-infection by aphid lethal paralysis, Israel acute paralysis and Lake Sinai viruses. PLoS ONE 8, e57459. doi:10.1371/ journal.pone.0057459
Johnson, R.M., Evans, J.D., Robinson, G.E., Berenbaum, M.R. (2009) Changes in transcript abundance relating to colony collapse disorder in honey bees (Apis mellifera). Proc Natl Acad Sci U S A106, 14790–
14795
Li, J.L., Cornman, R.S., Evans, J.D., Pettis, J.S., Zhao, Y., Murphy, C., Peng, W.J., Wu, J., Hamilton, M., Boncristiani, H.F., Zhou, L., Hammond, J., Chen, Y.P. (2013) Systemic spread and propagation of a plant-pathogenic virus in European honeybees,Apis mellifera. MBio 5, e00898–13. doi:10.1128/ mBio.00898-13
Locke, B., Forsgren, E., de Miranda, J.R. (2014) Increased tolerance and resistance to virus infections: a possible factor in the survival ofVarroa destructor-resistant honey bees (Apis mellifera). PLoS ONE9, e99998. doi:10.1371/journal.pone.0099998
McMenamin, A.J., Genersch, E. (2015) Honey bee colony losses and associated virus. Curr Opin Insect Sci8, 121–129. doi:10.1016/j.cois.2015.01.015
Nazzi, F., Pennacchio, F. (2014) Disentangling multiple interactions in the hive ecosystem. Trends Parasitol
30, 556–561
Nazzi, F., Brown, S.P., Annoscia, D., Del Piccolo, F., Di Prisco GVarricchio, P., Vedova, G.D., Cattonaro, F., Caprio, E., Pennacchio, F. (2012) Synergistic parasite-pathogen interactions mediated by host immunity can drive the collapse of honeybee colonies. PLoS Pathog . doi:10.1371/journal.ppat.1002735
Nielsen, S.L., Nicolaisen, M., Kryger, P. (2008) Incidence of acute bee paralysis virus, black queen cell virus, chronic bee paralysis virus, deformed wing virus, Kashmir bee virus and sacbrood virus in honey bees (Apis mellifera) in Denmark. Apidologie39, 310–314 Oregon State University. Extension Service, Sagili RR, Burgett DM, Washington State University. Extension, University of Idaho. Extension, Agriculture USDO, Extension PNC (2011) Evaluating honey bee colonies for pollination: a guide for commercial growers and beekeepers, 1–8
Pettis, J.S., Delaplane, K.S. (2010) Coordinated responses to honey bee decline in the USA. Apidologie41, 256– 263
Pirk, C., de Miranda, J.R., Kramer, M. (2013) Statistical guidelines forApis mellifera research. J Apic Res
52(4). doi:10.3896/IBRA.1.52.4.13
Ravoet, J., Maharramov, J., Meeus, I., De Smet, L., Wenseleers, T., Smagghe, G., de Graaf, D.C. (2013) Comprehensive bee pathogen screening in belgium reveals Crithidia mellificae as a new contributory fac-tor to winter mortality. PLoS ONE 8, e72443. doi:10.1371/journal.pone.0072443
Ravoet, J., De Smet, L., Wenseleers, T., de Graaf, D.C. (2015) Genome sequence heterogeneity of Lake Sinai virus found in honey bees and Orf1/RdRP-based poly-morphisms in a single host. Virus Res . doi:10.1016/ j.virusres.2015.02.019
Runckel, C., Flenniken, M.L., Engel, J.C., Ruby, J.G., Ganem, D., Andino, R., DeRisi, J.L. (2011) Temporal analysis of the honey bee microbiome reveals four novel viruses and seasonal prevalence of known virus-es,Nosema, andCrithidia. PLoS ONE6, e20656. doi:10.1371/journal.pone.0020656
Runckel, C., DeRisi, J., Flenniken, M.L. (2014) A draft genome of the honey bee trypanosomatid parasite
Crithidia mellificae. PLoS ONE 9, e95057. doi:10.1371/journal.pone.0095057
Schwarz, R.S., Bauchan, G.R., Murphy, C.A., Ravoet, J., de Graaf, D.C., Evans, J.D. (2015) Characterization of two species of trypanosomatidae from the honey bee
Apis mellifera: Crithidia mellificae Langridge and McGhee, andLotmaria passim n. gen., n. sp. J Eukaryot Microbiol . doi:10.1111/jeu.12209
Spleen, A.M., Lengerich, E.J., Rennich, K., Caron, D., Rose, R., et al. (2013) A national survey of man-aged honey bee 2011–12 winter colony losses in the United States: results from the Bee Informed Partnership. J Apic Res 52(2). doi:10.3896/ IBRA.1.52.2.07
Steinhauer, N.A., Rennich, K., Wilson, M.E., Caron, D.M., Lengerich, E.J., et al. (2014) A national survey of managed honey bee 2012–2013 annual colony losses
in the USA: results from the Bee Informed Partnership. J Apic Res53, 1–18. doi:10.3896/IBRA.1.53.1.01
Steinhauer, N.A., Rennich, K., Lee, K., Pettis, J., Tarpy, D.R., et al. (2015) Colony loss 2014–2015: prelimi-n a r y r e s u l t s . I prelimi-n : b e e i prelimi-n f o r m e d . o r g . h t t p : / / beeinformed.org/results/colony-loss-2014-2015-pre-liminary-results/. Accessed 26 May 2015
Tentcheva, D., Gauthier, L., Zappulla, N., Dainat, B., Cousserans, F., Colin, M.E., Bergoin, M. (2004) Prev-alence and seasonal variations of six bee viruses in
Apis melliferaL. andVarroa destructormite popula-tions in France. Appl Environ Microbiol70, 7185– 7191
van der Zee, R., Pisa, L., Andonov, S., Brodschneider, R., Charriere, J.-D., et al. (2012) Managed honey bee colony losses in Canada, China, Europe, Israel and Turkey, for the winters of 2008–9 and 2009–10. J Apic Res51, 91–114
van der Zee, R., Brodschneider, R., Brusbardis, V., Charrière, J.D., Chlebo, R., et al. (2014) Results of international standardised beekeeper surveys of colony losses for winter 2012–2013: analysis of winter loss rates and mixed effects modelling of risk factors for winter loss. J Apic Res53(1), 19–34
van Engelsdorp, D., Underwood, R., Caron, D., Hayes, J.J. (2007) An estimate of managed colony losses in the winter of 2006–2007: a report commissioned by the apiary inspectors of America. Am Bee J
147, 599–603
van Engelsdorp, D., Hayes, J., Underwood, R.M., Pettis, J. (2008) A survey of honey bee colony losses in the US, fall 2007 to spring 2008. PLoS ONE3, e4071. doi:10.1371/journal.pone.0004071
van Engelsdorp, D., Evans, J.D., Saegerman, C., Mullin, C., Haubruge, E., Nguyen, B.K., Frazier, M., Frazier, J., Cox-Foster, D., Chen, Y., Underwood, R., Tarpy, D.R., Pettis, J.S. (2009) Colony collapse disorder: a descriptive study. PLoS ONE4, e6481. doi:10.1371/ journal.pone.0006481
van Engelsdorp, D., Caron, D., Hayes, J., Underwood, R., Henson, M. (2012) A national survey of managed honey bee 2010–11 winter colony losses in the USA: results from the Bee Informed Partnership. J Apic Res
51, 115–124
van Engelsdorp, D., Lengerich, E., Spleen, A., Dainat, B., Cresswell, J., et al. (2013) Standard epidemiological methods to understand and improveApis mellifera