Canadian Labour Market
and Skills Researcher
Network
Working Paper No. 74
CLSRN is supported by Human Resources and Skills Development Canada (HRSDC) and the Social Sciences and Humanities Research Council of Canada (SSHRC). All opinions are those of the authors and do not reflect the views of HRSDC or the
SSHRC.
Long Term Consequences of Natural Resource
Booms for Human Capital Accumulation
Herb Emery
University of Calgary
Ana Ferrer
University of Calgary
David Green
University of British Columbia
Long term consequences of natural resource booms for human capital accumulation
Herb Emery, Ana Ferrer♦ and David Green♣
Abstract. Tight labour markets driven by resource booms could increase the opportunity
cost of schooling and crowd out human capital formation. For oil producing economies like the Province of Alberta, the OPEC oil shocks of 1973 to 1981 may have had an adverse long term effect on the productivity of the labor force if the oil boom resulted in workers reducing their ultimate investment in human capital rather than merely altering the timing of schooling. We analyze the effect of this decade long oil-boom on the long-term human capital investments and productivity for Alberta birth cohorts that were of normal schooling ages before, during and after the oil boom. Our findings suggest that resource booms may change the timing of schooling but they do not reduce the total accumulation of human capital.
Key words: Resource booms, long term human capital accumulation, OPEC oil crisis
JEL codes: J24, I21, I22
♦
Department of Economics, University of Calgary
Executive Summary
Does natural resource wealth reduce future income levels by crowding out human capital formation? Standard models of human capital acquisition predict that a decline in the relative skill premium will induce individuals to leave school since the opportunity cost of schooling rises. This effect may be even more pronounced in the case of resource booms. Because resource industries traditionally employ low skilled workers, high wages arising from resource booms may crowd out human capital formation by pulling young individuals out of school. While evidence to date shows that resource booms reduce school enrolment, whether or not this is a long run problem for an economy depends on whether the short run reduction in enrolment reflects permanently lower levels of school attainment, a mere interruption to schooling that does not change ultimate educational attainment, or a source of finance that ultimately leads to higher levels of schooling.
In this paper, we explore the long term effects on human capital formation of natural resource booms using the Alberta 1973-1981 oil-boom. We use a variety of data to assess the human capital accumulation of the cohorts of Albertans most affected by the oil boom. The 2003 International Adult Literacy Survey (IALS) allows us to look at the schooling attainment and literacy achievement of these cohorts compared to the rest of Canada. The IALS offers an in-depth look into skills accumulation because of the inclusion of a direct measure of cognitive skills through literacy tests. Further, literacy measures also allow us to obtain better estimates of the determinants of labour market success. In addition, we use Census data to construct synthetic cohorts which we follow over time to track the evolution of their schooling achievement over the years and assess the long term consequences of the oil boom.
Our findings support the idea that economic booms may change the timing of schooling, rather than having long term negative effects on the total accumulation of human capital, particularly at low levels of education. That is, the short run reductions in schooling enrolment during a resource boom result in higher levels of educational attainment in the long run suggesting that transitory labor demand shocks are beneficial to the economy rather than a source of harm as alleged in the `resource curse’ literature.
Albertans compared to the rest of Canada, it appears that higher oil prices resulted in greater investment in human capital amongst school aged Albertans during the boom, albeit the higher level of education was non-university post-secondary rather than university compared to the rest of Canada. Overall it would seem that natural resource booms enhance human capital formation rather than crowding it out. These human capital benefits of the resource boom do not persist beyond the boom. In Alberta, the return to lower oil prices saw the return of lower educational attainment of Albertans relative to their peers in the rest of Canada.
The results fit with a model where educational choices are not permanent and individuals may come back to school at a later date if they decide to leave at the time of the resource boom. Assuming that schooling decisions are not permanent also explains the result that while the boom seems not to have long lasting effects on educational attainment, the subsequent bust does. Individuals who leave school during a resource boom may have the chance to use the accumulated earnings to go back to school later on, but those who leave school because of a recession may not have the same resources to do so. This is of relevance when thinking of educational policies to finance public education. Offering easy access to post secondary education or high school completion for individuals affected by a resource bust may be helpful as part of a comprehensive package to help displaced workers.
1. Introduction
Does natural resource wealth reduce future income levels by crowding out human capital formation? Standard models of human capital acquisition predict that a decline in the relative skill premium will induce individuals to leave school since the opportunity cost of schooling rises. This effect may be even more pronounced in the case of resource booms. Because resource industries traditionally employ low skilled workers, high wages arising from resource booms may crowd out human capital formation by pulling young individuals out of school. While evidence to date shows that resource booms reduce school enrolment, whether or not this is a long run problem for an economy depends on whether the short run reduction in enrolment reflects permanently lower levels of school attainment, a mere interruption to schooling that does not change ultimate educational attainment, or a source of finance that ultimately leads to higher levels of schooling. We explore the long term effects on human capital formation of natural resource booms using the Alberta 1973-1981 oil-boom. The 1973 to 1981 OPEC oil crises generated high oil prices in Alberta which created a period of rapid growth both in wages and employment in Alberta relative to the rest of Canada.1
A series of papers investigate the immediate impact of resource booms and changes in labour market conditions more generally on education choices in developed economies. Black, Mckinnish and Sanders (2005b) examine the impact of the 1973 OPEC oil crisis on coal prices in two mining states in the US. The oil embargo created a prolonged boom in the coal industry that increased the opportunity cost of education among low skill youth in these states. Their analysis of the effect of changes in skill premia on high school enrolment during the boom and subsequent crash suggests that persistent shocks to skilled wage differentials substantially reduced high school enrolment. More generally, several studies have looked at the effect of economic conditions, in particular unemployment rates, on high school drop out rates. Although earlier studies by Duncan (1965) and Rumberger (1983) found contradictory evidence in this regard, there is a general consensus that favourable economic conditions reduce high school enrolment (Neumark and Wascher 1995, Rees and Mocan 1997, Beaudry, Lemiuex and Parent 2000), and high school completions (Goldin and Katz 1998).
1
The idea that resource booms affect human capital investment in Alberta seems supported by casual observation In Alberta, males are opting to “drop-out” of high school to work in the oil patch during the recent boom. Calgary Herald April 23, 2006, and Globe and Mail, July 29, 2008.
Whether sharp changes in short run economic conditions have longer term impacts on educational outcomes, however, remains an open question. 2 On first consideration, it appears that large, sudden changes in the price of natural resources will have long term impacts on education by raising the opportunity cost of schooling. This, in fact, is one of the claimed channels for “resource curses”.3
In this paper, we use the same resource boom episode as Carrington (1996) and Black, Mckinnish and Sanders (2005b) (the 1970s oil crises) to explore the impacts on ultimate educational outcomes. Our focus is on education outcomes in the province of Alberta, which has the large majority of Canada’s oil reserves. Our analysis differs from that in Black et al. (2005a,b) primarily because we focus on impacts on ultimate educational attainment as measured by levels of school completion rather than immediate impacts on enrolment. Further, the possibility of returning to school after the boom also changes the focus of our analysis from high school rates and high school graduation alone (which is the focus of previous studies) to further educational attainment. Once we consider the possibility that earnings in a resource boom could be used to That short and long run outcomes might diverge, though, gains credibility when one considers the literature that shows that transitory resource booms do not appear to have permanent effects on labour market outcomes. Carrington (1996) investigates the adjustment of the Alaska labor market between 1974 and 1977 when the Trans-Alaska Pipeline was under construction. He finds that flexible wages and elastic labor supplies implied that this particular short run demand shock had no long run impacts. Coe and Emery (2004), using wage data for 13 Canadian cities that spans the oil price shocks of the 1970s and 1980s, find no evidence that regional labour demand shocks result in permanent changes in relative real wages across provincial labour markets in Canada for building trades. As Lemieux and Card (2000) suggest, given that schooling decisions are not permanent in nature, these temporary shocks may not have an effect on ultimate educational choices. Conversely, in a world in which students face financial constraints on educational investment, a temporary resource boom could allow some individuals to finance more education than would otherwise be possible. In that case, we could observe short run reductions in enrolment as the individuals work during the resource boom to accumulate savings, but longer term increases in educational outcomes relative to the counterfactual case with no resource boom.
2 Other types of short run shocks (e.g. famines or war) are likely to have long lasting effects (Meng and Qian , 2009). 3
Gylfason et al. (1999), Gylfason (2001) and Bravo-Ortega and De Gregorio (2005) argue that low growth and income levels in resource abundant economies could be due to low human capital accumulation. They observe that public expenditures on school and school enrolment rates are inversely related to natural resource abundance.
finance post-secondary education, the impact of the boom on high school graduation rates becomes complex. Hence, it is of interest to consider not only the marginal high school graduate, but also the marginal post secondary attendant, who would have continued to post-secondary education but does not so because of the boom. Our results corroborate this view, as they show that during the boom there is more dropping out of high school (for males) but this is not exactly offset by a decline in the number of high school completers. Instead, we see a drop in the number of post-secondary types (less than university). That suggests that the response is for some marginal completers not to graduate high school (as in the US case) but also for some marginal post-secondary attenders not to go beyond completing high school in the short run.
We use a variety of data to assess the human capital accumulation of the cohorts of Albertans most affected by the oil boom. The 2003 International Adult Literacy Survey (IALS) allows us to look at the schooling attainment and literacy achievement of these cohorts compared to the rest of Canada. The IALS offers an in-depth look into skills accumulation because of the inclusion of a direct measure of cognitive skills through literacy tests. Further, literacy measures also allow us to obtain better estimates of the determinants of labour market success. In addition, we use Census data to construct synthetic cohorts which we follow over time to track the evolution of their schooling achievement over the years and assess the long term consequences of the oil boom. Overall, our results indicate that resource booms may change the timing of human capital accumulation, but they do not have negative consequences on ultimate levels of schooling. If anything, it appears that resource busts are the problem for resource abundant economies as we find that following the collapse of oil prices, human capital formation in Alberta fell behind that of the rest of Canada.
The following section provides background information on the Alberta oil boom. Section 3 describes the data we use for analysis. Section 4 discusses our results and section 5 concludes.
2. The Alberta oil boom
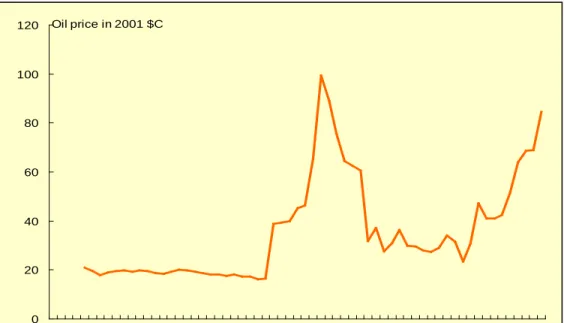
During the 1970s, world oil prices increased as a result of what have been called the first and second OPEC oil crises (Figure 1). In 2002 purchasing power terms, oil prices increased from $16 per barrel in 1972 to $99 per barrel in 1980. Prices started to fall after 1981 reaching $75 per barrel in 1982, and to $60 per barrel in 1985. World oil prices collapsed to 30 $/barrel in 1986 when
OPEC’s pricing agreement unwound. In Canada, the decline in oil prices was accentuated by the federal government’s National Energy Program (NEP), introduced in 1982. The NEP was an attempt to shield the Canadian manufacturing sector from the effects of higher oil prices, effectively sharing the resource rents from Alberta oil with the rest of the country. To do this, under the NEP the Canadian price of oil was mandated to be half of the world price (Emery 2006). That this policy was not implemented until after world oil prices were declining reflected lags in policy making.
It has been well documented that the Alberta economy’s boom in the 1970s and early 1980s, and subsequent bust, resulted in dramatic changes in its labour market and incomes relative to the rest of Canada and the other western Canadian provinces.4
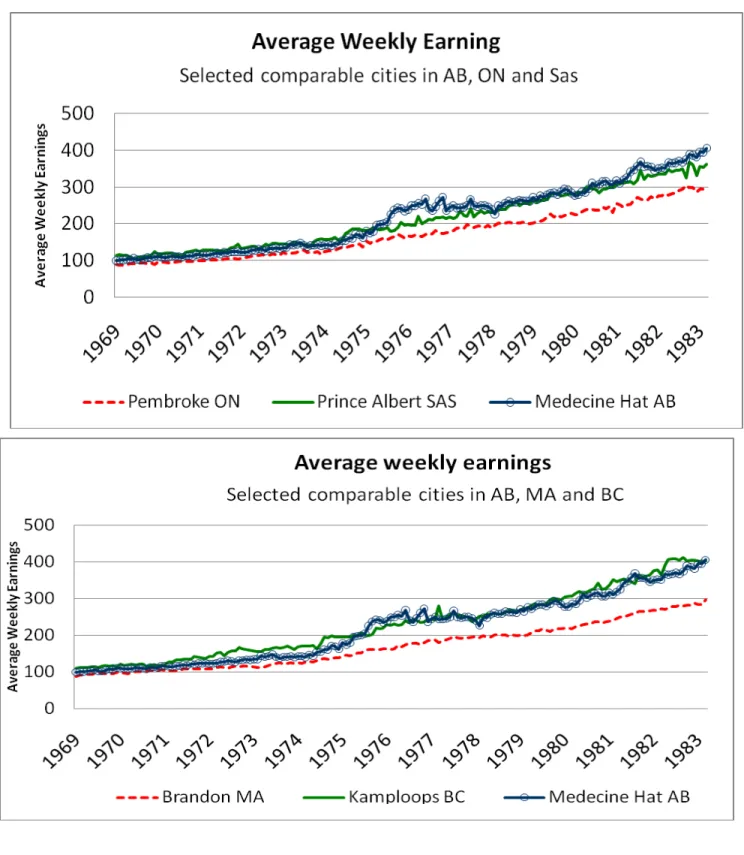
The boom translated into increasing employment opportunities in Alberta with respect to the rest of Canada, particularly for males (see Figure 3a). Employment rates in Alberta for males aged 16 and over were over 80% during the late 1970s until 1981 - 6% points higher than Ontario, which had the next highest employment rate. By 1983 Alberta’s employment rate was at similar levels to Ontario’s. Employment rates for females were higher than in the rest of Canada as well, but they remained higher after the boom, suggesting that this is part of a long term pattern rather than an effect of the boom (Figure 3b). In Figure 4, we show weekly wages in Medicine Hat, Alberta and two similar sized towns in Saskatchewan (Prince Albert) and Ontario (Pembroke). One can see a clear bulge in the trend for Medicine Hat which is not present for the other two towns. This is particularly striking in the comparison with Prince Albert since Saskatchewan is the adjacent province to Alberta and, apart from the oil boom, the two provinces share many
One reason that made the oil boom particularly influential for Alberta was the level of investment that followed the rising oil price. As Figure 2 shows, at the height of the oil boom, on a per capita basis, investment expenditures in Alberta were more than double that of Ontario and the neighbouring province of Saskatchewan. With falling oil prices after 1980, the announcement of the NEP and a sharp recession, investment in Alberta plummeted back to the per capital levels of the other provinces.
4
See Emery (2006) and Emery and Kneebone (2008). Mansell and Percy (1990, 7-22) have a detailed presentation of this case that the boom and bust conditions in Alberta were more pronounced than in the rest of Canada and in comparison to oil producing states in the US. Alberta accounts for nearly 80% of Canada’s oil production and even today, Alberta remains remarkably dependent on energy exports compared to the other provinces. The Canada West
Foundation (2010, chapters 10 and 11, s
2009, exports from Alberta were 40% of provincial GDP. Two-thirds of exports are from mining and oil and gas extraction and over 80% of total exports goes to the United States.
similarities.5
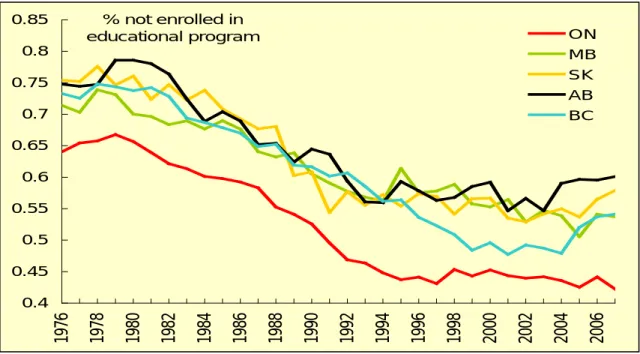
Our interest is in the impact of this boom on education trends. In Figure 6, we present post-secondary enrolment rates by province. Two points are readily apparent from Figure 6. One, Alberta and the other western Canadian provinces, which are all resource abundant, have persistently lower post-secondary enrolment rates compared to Ontario and the provinces to the east. Second, during the second OPEC oil price shock, 1978-1982, post-secondary enrolment in Alberta was lower than in the other western Canadian provinces. With the weakening oil price after 1982, the level of enrolment in post-secondary education returned to a level comparable to the other western provinces.
Figure 5 shows that personal incomes in Alberta increased relative to the Canadian average and in comparison to the other prairie provinces of Manitoba and Saskatchewan. Reflecting the collapse of oil prices and investment spending in Alberta after 1980, Alberta’s income advantage relative to the other provinces was gone by the mid-1980s.
The negative relationship between post-secondary enrolment in Alberta and oil prices is made apparent in figure 7, which shows oil prices on the left hand axis and the difference in post secondary enrolment between Alberta and the rest of Canada on the right hand axis. In rough terms, the peak of the oil price series corresponds with the valleys in the enrolment gap, 6
3. Data Description
suggesting that, similar to the case of coal prices in the US, Alberta’s oil boom had an impact on enrolment rates.
The 2003 IALS is based on the Labour Force Survey (LFS) sampling frame and contains both standard survey questions and the results of literacy tests completed by the respondents. The literacy questions are designed to elicit competencies in cognitive tasks related to everyday life and work rather than just being measures of whether a person can read. As such, they can be seen as proving measures of cognitive skills possessed by the respondent at the time of the survey. The literacy tests were administered on three domains (prose and document comprehension, numeracy,
5 The increased pressure on Alberta’s labor demand was not restricted to the oil and gas sector. Construction, for
instance, was also a major contributor to the upward wage movements in the boom economy (Mansell and Percy 1990).
and problem solving) and the literacy score used here is the average of these three.7
Despite the advantages of the IALS in terms of defining the cohorts of interest and providing better measures of skill than are usually available, it has the disadvantage of being a relatively small, one-time cross-sectional survey. Therefore, in addition to the IALS, we use data from several of the Censuses of Canada (1976-2001) to study the evolution of the education attainment of the cohorts affected by the oil boom.
A further advantage of the IALS is that in addition to province of birth, it identifies the province in which a respondent attended high school. This allows us to be more precise about the identification of cohorts that were affected by the Alberta oil boom specifically at the time they were making high school completion and post secondary schooling decisions.
8
The Census reports province of birth rather than the province where the individual was in high school, and we use this variable together with age as the closest way to identify the cohorts affected by the Alberta oil boom.
Individual census years are pooled together to construct a pseudo panel that follows birth cohorts over time. An additional advantage of the Census is the larger number of observations.
9
Experience and (highest) level of education achievement are defined in the same way as they are for the IALS data. However, we make use of the richer information available in the Census to construct more detailed measures of educational attainment. In particular, we are able to disentangle the non-university post-secondary category into different levels based on years of post-secondary schooling (less than one year, 1 to 2 years and 3 to 4 years). University degrees are all considered together as they involve a relatively small number of observations.10
7 The three measures are highly correlated. We use the average of the three measures to avoid multicollinearity issues,
as in Green and Riddell (2003) and Green, Ferrer and Riddell (2005).
8
Although the 1971 Census is available, the questions on education are too different to construct measures comparable to the rest of the Census data.
9 We assess the importance of this difference in the definition of the oil boom cohort by looking at the fraction of
Alberta born individuals, younger than 19 that reside in Alberta in a given census year (Appendix Table 1). The number, 84%, is very close to the 83.3% fraction of individuals born in Alberta that attended high school in Alberta, according to the IALS (Electronic Appendix Table 2). Therefore, the use of province of birth rather than province of high school to define the boom cohort is not likely to largely influence our Census results.
https://webdisk.ucalgary.ca/~aferrer/the%20long%20term%20consequences%20of%20resource%20booms-appendix/Appendix.pdf
10
Electronic appendix Table 1 provides a comparison between the fractions of individuals in each education level across the two data sets.
We restrict the IALS sample to include non-Aboriginal individuals aged 16 to 55 who answer the relevant questions on educational attainment and province of high school. Our final sample from the IALS has 10,369 male and 12,412 female observations. Survey weights are used through the analysis. With Census data, we similarly restrict the sample to include non-Aboriginal individuals aged 16 to 55 for whom we have responses regarding age, education, and province of birth.11
To measure long term educational attainment in the IALS data, we use the highest degree obtained. We also construct two rough measures of school interruption based on the average number of years that it takes to complete different degrees and the respondent’s answer on when he or she was last in school. We define an indicator of “Interrupted schooling-Completed PS” that takes value 1 if a person obtained a PS degree and was last in school at an age above the “typical” age at which a student would complete that degree if he or she were in school continuously. Similarly we define an indicator of “interrupted schooling-Uncompleted PS” that takes value 1 if a person attended PS schooling without completing a degree and was last in school at an age above the “typical” age to complete that degree.
The Census sample has about 800,000 observations for each gender.
Using the oil price changes discussed in section 2, and the timing for when a given 4 year birth cohort would have been attending high school, we define five birth cohorts of interest:
• Pre-boom cohort includes individuals born between 1953 and 1956, who turned 17 between 1970 and 1973.
• Early-boom cohort includes those born between 1957 and 1960, who turned 17 between 1974 and 1977, during the first OPEC oil shock.
• Boom cohort includes those born between1961 and 1964, who turned 17 between 1978 and 1981, during the second OPEC oil shock.
• The Slow-down cohort includes those born between 1965 and1968, who turned 17 between 1982 and 1985 when the federal government set the Canadian price of oil at half of the world price.
11 We use standard human capital measures in our analysis: experience is the standard Mincer measure of potential
experience (i.e., age– years of schooling – 6); educational categories correspond to the highest level of education attained (less than high school graduation, high school graduates, non-university post-secondary graduates, and Bachelor's or higher university degree).
• Collapse cohort includes those born between 1969 and1972, who turned 17 between 1986 and1989 when the OPEC price agreement collapsed.
The early-boom and boom cohorts were of high school age at a time when rising oil prices in Alberta were driving wages up, therefore increasing the opportunity cost of staying in school.
4. The long run educational attainment of the Alberta oil boom cohorts 4.1. Evidence from IALS
We begin by using the IALS data to examine differences in literacy and educational achievement of the cohort that attended high school in Alberta during the oil boom relative to the same birth cohorts attending high school in the “rest of Canada”. To provide context, Table 1 shows a cross-sectional snap shot of levels of school achievement and literacy levels for Alberta and the rest of Canada in 2003 (i.e., for all cohorts combined). According to these figures, Alberta males are not significantly different from males in the rest of Canada in terms of high school dropout or graduation rates. They are more likely to have non-university post-secondary degrees rather than university degrees relative to those in the rest of Canada, and a higher fraction report some (unfinished) post-secondary education. Male literacy levels are generally higher in Alberta than in the rest of Canada. Among those who did not have uncompleted PS education, a similar fraction of individuals completed their degree after the average age of completion in Alberta and the rest of Canada. However, a higher fraction of Alberta males returned to (but did not finish) PS schooling after the average age of completion (61.5% versus 54% in the rest of Canada). The figures for females, in contrast, indicate that Albertan females are better educated than other Canadians. In particular, although Albertan females show similar overall levels of post secondary education, a higher fraction have university education than in the rest of Canada.12
To investigate the long term effect of the boom on educational attainment, we perform a simple difference in difference (DD) exercise on the effect of the Boom in Alberta versus the rest of Canada:
(1) Ed.levelcp = α0 + α1AB + α2 CohBoom + α3 AB x CohBoom + ecp
12
This fact, although not well documented in the literature, fits with other descriptive statistics of female educational attainment in Alberta. Since the middle 1970s, Alberta females are graduating from PS education at a faster rate than in other provinces in Canada (CANSIM Table 4770006)
where, c indexes cohort and p indexes province, AB is a dummy variable corresponding to Alberta, and CohBoom is a dummy variable corresponding to the Boom (1961-64) cohort. We restrict our attention to the Boom (1961-64) and Pre-Boom (1953-56) cohorts in order to avoid problems with standard errors that arise because of serial correlation when one uses multiple periods (Bertrand, Duflo and Mullainathan, 2004). We work with data aggregated to the province-cohort level in order avoid clustering-related problems that would arise if we worked with the individual level data. We estimate equation by weighted least square where the weight is the number of observation in the relevant cohort-province cell.
The results from estimating equation 1) are presented in Table 2. Each cell in the column labeled (I) corresponds to coefficient α3, the coefficient on the interaction between belonging to the Boom cohort (1961-1964) and attending high school in Alberta in a regression in which the dependent variable is an indicator corresponding to the education level listed in the first column. In column (II) we introduce additional controls in the regressions, including indicators for foreign born, mother’s post secondary education, and for whether the father worked when the respondent was 16.13
One advantage of the IALS data is that it provides a direct measure of cognitive skills through the literacy score. To check if there were any potential long term effects in skill achievement as a result of the boom, we also use the average literacy score as an education outcome in equation (1) and show it in Table 2. Columns 2 add background characteristics that can affect literacy skills With or without the controls, the difference-in difference estimation indicates that degree completion was not lower among the Albertans of the boom cohort. Rather, this group shows significantly higher levels of completion in non-university post-secondary education. The rest of the educational outcomes show positive although not significant, achievement. It would seem that the long term school achievement of the Alberta boom cohort did not decline when compared to previous cohorts. For females, the effect for the boom cohort in most levels of education is much smaller than for males and never significant. This difference in the effects by gender fit with the idea that resource booms (particularly in the 1970s) should have a stronger effect on the returns to schooling for males than for females. This result also fits with other evidence that finds that tight labour market conditions seem to affect young males more than young females (Parent, 2006).
13 We do this by estimating in two stages. In the first stage, we regress individual level education outcomes on the
listed covariates plus a complete set of province by cohort interaction dummy variables. The coefficients on the latter variables form the dependent variable in our second stage. We run the second stage using weighted least squares where the weight is the number of observations in the relevant cohort - province cell.
(mother’s level of education, immigration status, and whether the father worked when the individual was 16 years of age). The interaction between the indicator for graduating from high school in Alberta and indicators of birth cohort are not significant and therefore, that the literacy of Albertans did not differ significantly from that of the rest of Canada for the boom cohort. According to these results, we do not find evidence that Albertans who were about high school leaving age during the 1970s oil boom have lower levels of literacy skills than the rest of the boom cohort in Canada.
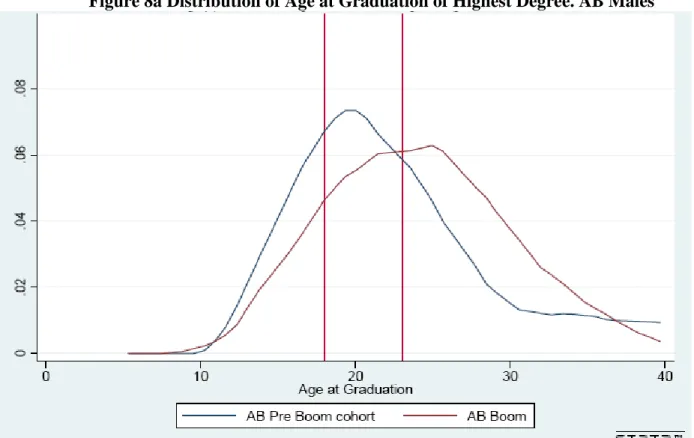
One possibility that we point out in the introduction is that, for males, money saved during the boom was used to complete PS education during the bust. Although there is no information that permits to assess this possibility directly, we find some support for this hypothesis by looking at our measure of school interruption and the age at which individuals graduated from the highest degree. Table 2 shows that male Albertans of boom cohort show significantly lower levels of incomplete schooling than the rest of Canada. More interestingly, males also show higher fraction of school interruption, whereas females show less school interruption for this cohort. Further, Figure 8a and 8b show the distribution of “age at graduation from highest degree” for the pre-boom and pre-boom cohorts, separately for males and females. The two vertical lines indicate age 18 and age 23, the age at which most individuals finish post secondary education. Albertan males show a lower fraction of individuals graduating between these ages of 18 to 23 and a higher fraction graduating later on. However, the distribution of Alberta females shows a higher fraction graduating after the age of 18 increases in the boom cohort.
4.2. Evidence from Census Data
We turn now to the 1976-2001 Canadian Censuses to investigate the level and evolution of school achievement of Alberta born individuals who were young during the oil boom. The purpose of this analysis is twofold. First, it allows us to assess whether the timing of educational attainment for the Alberta oil boom cohort differed from that of contemporaneous cohorts from other regions in Canada. Second, it offers a robustness check for our previous results, which are based on a one-time snap shot of the population and on a much smaller sample than the Census.
We estimate a very parsimonious model of school attainment, where education is a function of the interaction of a cohort indicator and census year indicator variables (Yrt), an indicator for
Alberta born (AB), and the interaction of cohort, census year indicators and the Alberta born indicator. ijt t j t j t j t j ijt CYr C Yr AB AB E =β0+β1
∑∑
+β3∑∑
* +β4 +ε (2)where j corresponds to the cohorts specified above (pre-boom, early boom, boom, slow down, collapse, post oil shock) plus the groups born before and after these, t corresponds to the six survey years, and i corresponds to the province. As in our previous estimation, we aggregate our data to avoid issues relating to clustering of standard errors. In this case, we aggregate to the cohort-province-year level and use weighted least squares, with the weights being the number of observations in the relevant data cell.
We use Census files from 1976 to 2001, to follow cohorts of Alberta born individuals who were young during the oil boom.14 The Canadian Census is conducted every 5 years, which lets us identify the cohorts at the peak of the boom (1980 and 1985) and follow them at five years intervals. By the time of the 2001 Census, these cohorts are in their late 30s and likely to have completed their educational process. We estimate equation (2) above using all six Census years and provide estimates of the difference between Alberta born cohorts and the rest of Canadian cohorts.15
If human capital formation is adversely influenced by natural resource booms then we should see that during the period of high oil prices in Alberta, young individuals have lower attainment of human capital than comparable individuals outside of Alberta. Conversely, when oil prices collapsed we should see young Albertans attain comparable or better schooling outcomes than individuals in the rest of Canada. In contrast, if human capital formation is improved by resource booms, then we should see Albertans of school age during the boom ultimately attaining higher levels of human capital, and Albertans of school age when prices fall not faring as well.
The full set of estimates can be found in tables 5a and 5b (for males and females respectively).
14 For the 1976 Census year, we use province of residence instead of province of birth as province of birth is not
provided in the 1976 Census. We find no evidence that there were substantial changes in mobility rates between province of birth and province of residence across censuses. 85% of young individuals (up to 24 years of age) reside in the province of birth. See Electronic Appendix table 1 and footnote 9.
15 Selecting alternative comparison groups does not affect the qualitative results. We have performed the same
estimation excluding British Columbia from the comparison group with on the grounds that that province also has oil and gas reserves. The results from these alternative estimations are similar to those presented here and are available from the authors upon request. See Electronic Appendix table 4a and 4b.
Table 3a shows the coefficients of the Alberta-cohort indicators in six education attainment regressions (high school dropouts, high school graduates, 1 year of post secondary education, 2 years of post secondary education, 3-4 years of post secondary education and university education). Common to all cohorts and years is the outcome that higher percentages of males in Alberta do not achieve post-secondary schooling by the time they reach their late teens-early 20s compared to males of the same age in the rest of Canada. For early boom cohort males in Alberta, the gap in education levels has disappeared by the 1986 Census suggesting that these males interrupted schooling but increased their ultimate level of educational attainment. For the Boom cohort, the convergence tendency of education levels with the rest of Canada is still apparent but weaker. For the Slow Down and subsequent cohorts who entered high school in Alberta as oil prices were coming down, the lower educational attainment persists.
Table 3b shows the differences in education attainment between Alberta females and females in the rest of Canada. Here we would not expect to see as strong an effect of the oil boom on schooling decisions as females were less likely to work in the primary sector or in construction, two prominent areas of employment directly affected by the oil boom. What is notable here is that unlike males in the oil boom period, females show persistent and significantly lower levels of education in Alberta than seen in the rest of Canada. The slow down, collapse and post-oil shock cohorts all show the same education gap with females in the rest of Canada as the boom cohorts. Perhaps most interestingly, the female cohorts also show the same education gap with the rest of Canada as the male cohorts who entered high school after 1982. Thus, the comparison of male and female educational attainment for Alberta birth cohorts suggests that males of school age in the OPEC oil boom achieved higher education levels over the long run than they would have in the absence of the resource boom.
Our results are consistent with the simple framework proposed by Card and Lemiuex (2000). Assuming a model where schooling decisions are not permanent, individuals who leave school during a resource boom may have the chance to use the accumulated earnings to go back to school later on, but those who leave school because of a recession may not have the same resources to do so. This would explain why the boom cohorts eventually achieve similar levels of education than cohorts in the rest of Canada, but the bust cohorts show a return to Alberta’s lower level of education relative to the rest of Canada as before the boom. From this perspective, transitory labor demand shocks arising from a resource boom generate economic rents that are capitalized in part
in the human resources of the province. This positive influence on human capital formation does persist beyond the boom.
4.3. Robustness
The validity of the results on the evolution of skill achievement depends crucially on the assumption that the Alberta oil boom had distinctive impact across Canadian provinces. This is not necessarily true as wage differentials (due to differences in economic activity across regions) often induce population flows within a country.16 If the oil boom caused large fractions of young individuals to move to Alberta from other provinces before completing high school, we may be overestimating the school achievement of the Alberta born cohort as these movers may have reduced their schooling as a result of the boom, but we are assuming that they were not affected.17
Approximately 85% of young individuals reside in their province of birth (see Appendix table 2). We checked the robustness of our estimates to population movements by restricting the sample to non movers. That is, we compare differences in educational achievement over the years for those born and residing in Alberta versus those born and residing somewhere else in Canada. This provides a tighter definition of the cohort affected (or not) by the oil boom. Hence, these estimates provide a lower bound on the long term effects of oil booms on skills accumulation, when using census data. The results (available from the authors upon request) show no significant difference with those discussed above.
In this sense the above estimates provide an upper bound on the long term effects of oil booms on skills accumulation.
A word of caution should be introduced regarding these latter estimates. As mentioned, the above sample restriction provides a more accurate definition of the cohorts affected by the boom at the time schooling decisions are made. Therefore our initial point estimate for each cohort should be free of mobility bias introduced by population movements between birth and the age of high school graduation. However, as the cohort ages, we may be introducing a different bias coming from mobility after high school graduation age. For instance, if we see the fraction of Alberta born
16 See Carrington (1985), and Coe and Emery (2004). This seemed to be the case in Alberta during the oil boom.
Population flows out of Alberta for young individuals are reported in electronic appendix figure 1
17
Alternatively, large movements of Albertans out of the province would also reduce our estimates as they would not be affected by the oil boom and we are assuming they are. However, this possibility is less worrisome as there is no evidence of significantly large movements out of Alberta for the relevant age-group (See electronic appendix figure 1)
(and residing) HS graduates to diminish as the cohorts age, it could be due to the fact that Albertans are coming back to school to finish high school degrees at a later age, but it could also imply that as cohorts grow older, more Alberta HS graduates leave the province. While we are aware of this possibility, two facts induce us to believe that this may not be an important factor. First, we do not see unusually large movements of Albertans out of the province (electronic appendix Table 3). Second, the similarity between the estimates of the Census and the IALS makes this possibility less likely. Note that in the IALS data mobility is not an issue since we know the province in which an individual attended high school.
Finally, Alberta policy initiatives that encouraged displaced workers to go back to school during the bust could also affect our results. As far as we have been able to check, there were no such policies addressing training of displaced workers in Alberta. What evidence we found suggests that provincial governments were cutting expenses in all fronts, particularly on education (Decore, A.M. and R. S. Pannu, 1989). By the early 1980s, Alberta had university tuition fees that were low compared to the rest of the country but these fees quickly increased towards those levied in other provinces by the early 1990s. Hence, it seems unlikely that supply side considerations are affecting our estimates.
5. Conclusion
Using two complementary data sets, we examine the long term educational achievement of Albertans during the 1970s oil boom and its collapse in the 1980s. Our findings support the idea that economic booms may change the timing of schooling, rather than having long term negative effects on the total accumulation of human capital, particularly at low levels of education. That is, the short run reductions in schooling enrolment during a resource boom result in higher levels of educational attainment in the long run suggesting that transitory labor demand shocks are beneficial to the economy rather than a source of harm as alleged in the `resource curse’ literature.
Taking into consideration the historically lower levels of educational attainment of Albertans compared to the rest of Canada, it appears that higher oil prices resulted in greater investment in human capital amongst school aged Albertans during the boom, albeit the higher level of education was non-university post-secondary rather than university compared to the rest of Canada. Overall it would seem that natural resource booms enhance human capital formation rather than crowding
it out. These human capital benefits of the resource boom do not persist beyond the boom. In Alberta, the return to lower oil prices saw the return of lower educational attainment of Albertans relative to their peers in the rest of Canada.
The results fit with a model where educational choices are not permanent and individuals may come back to school at a later date if they decide to leave at the time of the resource boom. Assuming that schooling decisions are not permanent also explains the result that while the boom seems not to have long lasting effects on educational attainment, the subsequent bust does. Individuals who leave school during a resource boom may have the chance to use the accumulated earnings to go back to school later on, but those who leave school because of a recession may not have the same resources to do so. This is of relevance when thinking of educational policies to finance public education. Offering easy access to post secondary education or high school completion for individuals affected by a resource bust may be helpful as part of a comprehensive package to help displaced workers.
Our study calls for further research on the long run impact of resource shocks on labour market and other outcomes. Similar effects of the current boom on the Alberta labour market regarding post secondary enrolment and high school graduation have already been noted in the media. It is yet to be determined if the economic downturn will have similar effects and policies facilitating access to post secondary education are in order.
References:
Beaudry, P. and J. DiNardo. (1991). “The Effect of Implicit Contracts on the Movement of Wages Over the Business Cycle: Evidence from Microdata." Journal of Political Economy, 99(4) pp: 665-688.
Beaudry, P., T.Lemieux and D. Parent, (2000).
Berger, M. (1985). “The Effect of Cohort Size on Earnings Growth: A Reexamination of the Evidence”, The Journal of Political Economy, Vol. 93, No. 3, pp. 561-573
Bust”
Education: Evidence from the Coal Boom and Bust”
59, No. 1, pp. 3-16
Bravo-Ortega, C. and De Gregorio, J. (2005) “The Relative Richness of the Poor? Natural Resources, Human Capital and Economic Growth” World Bank Policy Research Working Paper
No. 3484.
Calgary Herald April 23, 2006. “Dropouts flock to the oilpatch,” by David Howell, E1, E5 Canada West Foundation (2010) State of the West 2010: Western Canadian Demographic and Economic Trends. Calgary: Canada West Foundation. Accessed at
Card, D. and Lemieux, T. (2000) “Dropout and Enrollment Trends in the Post War Period: What Went Wrong in the 1970s?” in J. Gruber (ed.) An Economic Analysis of Risky Behavior Among Youth, Chicago:University of Chicago Press for NBER, 2001, pp. 439-482.
Carrington, W. (1996) “The Alaskan Labor Market during the Pipeline Era”
Vol. 104, No. 1 pp. 186-218
Coe, Patrick J. and J.C. Herbert Emery (2004) “The Dis-Integrating Canadian Labour Market? The Extent of the market Then and Now,” Canadian Journal of Economics, 37(4), 879-897.
Decore, A.M. and R. S. Pannu (1989) “Alberta Political Economy in Crisis: Whither Education?”
Canadian Journal of Education, vol 14(2), pp. 150-69
Duncan, B. (1965) “Dropouts and the unemployed” Journal of Political Economy vol.73. pp121-34
Emery, J.C. Herbert (2006) “Alberta 1986: The Bloom Comes off of the Wildrose Province,” in Michael Payne, Donald Wetherell and Catherine Cavanaugh eds. Alberta Formed – Alberta Transformed. Calgary: University of Calgary Press.
Emery, J.C. Herbert and Ronald D. Kneebone (2008) “Socialists, Populists, Resources and the Divergent Development of Alberta and Saskatchewan,” Canadian Public Policy 34(4), 419-440. Ferrer, A., D. Green and W.C. Riddell (2005)
Green, D. and W.C. Riddell (2003) “Literacy and earnings: an investigation of the interaction of
cognitive and unobserved skills in earnings generation”,
April 2003, Pages 165-184.
Goldin, C. and L.F. Katz. (1998) "The Shaping of Higher Education: The Formative Years in the United States, 1890 to 1940." NBER Working Paper no. 6537, April
Globe and Mail, July 23. “Oil Boom Batters Alberta Graduation Rate” by Michael Valpy A1, A4 Gylfason, T., Tryggvi Thor Herbertsson, and Gylfi Zoega (1999), “A Mixed Blessing: Natural Resources and Economic Growth,” Macroeconomic Dynamics 3, June, 204-225.
Gylfason, T. (2001) “Natural Resources, Education, and Economic Development,” European Economic Review, 45. 847-859.
Mansell, R. and M. Percy (1990), “Strength in Adversity: A study of the Alberta Economy”, Western Studies in Economic Policy #1, The University of Alberta Press.
Meng, X. and N. Qian (2009), “The Long Term Consequences of Famine on Survivors: Evidence
from a Unique Natural Experiment Using China's Great Famine”,
Neumark, D. and W. Wascher (1995). “The Effects of Minimum Wages on Teenage Employment and Enrollment: Evidence from Matched CPS Surveys” NBER Working Paper No. W5092. Parent, D. (2006) Work While in High School in Canada: Its Labour Market and Educational Attainment” Canadian Journal of Economics, Vol.39, No. 4, November 2006: pp. 1125-1150.
Rees, D. and N. Mocan (1997) “Labor market conditions and the high school dropout rate:
Evidence from New York State”
Pages 103-109
Rumberger, R.W. (1983) . “Dropping Out of High School: The Influence of Race, Sex, and Family Background”, American Educational Research Journal, Vol. 20, No. 2, 199-220
Table 1. Mean school achievement by province of high school. IALS (2003) Male Female AB Rest of Canada AB Rest of Canada Less than HS 24.9 26.5 20.9 24.9 * High School 19.1 20.4 25.2 23.4 Some PS 12.8 9.0 * 10.9 9.1 Post Secondary 43.2 44.1 42.9 42.6 Non-University 26.4 21.3 * 17.3 21.8 * University 16.8 22.8 * 25.6 20.8 * Bachelor 14.5 16.3 20.7 17.1 * Graduate 2.3 6.5 * 5.0 3.7 School Interruption (1) Completed PS 54.0 52.6 47.6 49.1 Uncompleted PS 61.5 53.9 * 54.2 52.9 Incomplete Schooling 20.6 19.5 19.8 18.8 Literacy Average literacy 289 272 * 286 264 * Document literacy 292 274 * 289 267 * P literacy 287 270 * 294 273 * Numeracy literacy 286 272 * 275 253.7 *
Problem solving literacy 281 266 * 283 263.7 *
Observations 478 9891 565 11847
Source: Author’s tabulations using the IALS (1)
School interruption-completed PS indicates that the respondent does not have uncompleted PS schooling and that the degree indicated was finished within the average age of completion. School interruption-completed PS indicates that the respondent attended (but not finished) PS schooling after the average age of completion of that degree.
Table 2. Effect of Oil Shock on education. Alberta v. the rest of Canada, IALS, 2003 (2 step weighted least squared estimation. Robust standard errors in parenthesis)1
Males Females
(I) (II) (I) (II)
Dependent variable (2) Less than HS -0.10 -0.06 -0.06 -0.02 (0.12) (0.11) (0.12) (0.10) High School -0.09 -0.07 -0.03 0.04 (0.06) (0.08) (0.11) (0.10) Non University 0.21** 0.22*** 0.20 0.18 (0.11) (0.10) (0.18) (0.20) University 0.11 -0.08 -0.01 -0.08 (0.18) (0.10) (0.11) (0.14) Bachelor 0.12 0.06 -0.06 -0.13 (0.14) (0.08) (0.10) (0.11) Graduate -0.01 -0.09** 0.04 0.06 (0.06) (0.04) (0.06) (0.07) Incomplete schooling -0.21** -0.22*** -0.18 -0.15 (0.12) (0.10) (0.10) (0.09) Interruption-Completed PS (3) 0.21 0.25 -0.14 -0.11 (0.19) (0.21) (0.17) (0.18) Interruption-Uncompleted PS (3) 0.46** 0.42** -0.32 -0.32 (0.24) (0.21) (0.25) (0.24) Literacy 24.81 15.74 9.56 1.88 (26.31) (21.12) (35.05) (24.13) Observations 16 (1)
Data is aggregated at the cohort-province level. Estimated using 2 step weighted least squares, where the weights are the mean number of observations in the relevant cohort-province cell
(2)
Each row in column labeled (I) shows the coefficient of a difference in difference estimation of the effect of the boom (1961-1964) versus the pre-boom cohort (1953-1956), in Alberta versus the rest of Canada for the dependent variable listed in the first column. Column II adds indicators for foreign born, mother’s post secondary education, and for whether the father worked when respondent was 16.
(3)
School interruption-completed PS indicates that the respondent does not have uncompleted PS schooling and that the degree indicated was finished within the average age of completion. School interruption-completed PS indicates that the respondent attended (but not finished) PS schooling after the average age of completion of that degree.
(*) Indicates the coefficient is significant at 15%, (**) indicates the coefficient is significant at 10%, (***) indicates the coefficient is significant at 5%
Table 3 a. Differences in MALE School Achievement. AB versus Rest of Canada (Census 1976-2001)
(2 step weighted least squared estimation. Robust P-values in parenthesis)1
Low Skill Medium skill High Skill
HS dropout High School 1 yr PS 2 yrs PS 3-4 yrs PS University
Pre boom (born 1953-1956)
1976 (20 -23) -0.04 0.03* 0.01 0.01 -0.04 0.00 (0.620) (0.087) (0.292) (0.521) (0.150) (0.941) 1981 (25-28) -0.01 0.00 -0.01 -0.00 -0.01 0.00 (0.887) (0.831) (0.270) (0.730) (0.524) (0.879) 1986 (30-33) -0.01 0.02 -0.00 0.02 0.00 -0.00 (0.847) (0.268) (0.918) (0.176) (0.930) (0.881)
Early boom (born 1957-1960)
1976 (16-19) 0.04 0.06*** 0.01 -0.01 -0.04 -0.01 (0.610) (0.002) (0.303) (0.347) (0.127) (0.831) 1981 (21-24) -0.01 0.04*** 0.00 -0.01 -0.05** -0.01 (0.869) (0.004) (0.963) (0.569) (0.046) (0.617) 1986 (26-29) -0.02 0.01 -0.00 -0.01 0.01 0.01 (0.707) (0.359) (0.814) (0.324) (0.700) (0.766) 1991 (31-34) -0.00 0.01 0.01 -0.01 -0.00 -0.01 (0.936) (0.440) (0.413) (0.575) (0.884) (0.740) Boom (born 1961-1964) 1981 (17-20) 0.07 0.05*** -0.01 -0.03** -0.05** -0.01 (0.208) (0.001) (0.394) (0.023) (0.020) (0.742) 1986 (22-25) 0.02 0.02 -0.00 -0.01 -0.05** -0.02 (0.702) (0.179) (0.711) (0.394) (0.040) (0.278) 1991 (27-30) 0.05 0.02* -0.01 -0.01 -0.02 -0.02 (0.324) (0.092) (0.118) (0.525) (0.311) (0.158) 1996 (32-35) 0.02 0.00 -0.00 0.00 -0.01 -0.02 (0.705) (0.848) (0.808) (0.681) (0.732) (0.278)
Slow down (born 1965-1968)
1986 (18-21) 0.07 -0.01 0.01 -0.02 -0.04 0.00 (0.533) (0.734) (0.639) (0.444) (0.331) (0.959) 1991 (23-26) 0.04 0.04*** 0.00 -0.01 -0.06** -0.01 (0.550) (0.005) (0.756) (0.304) (0.025) (0.701) 1996 (28-31) 0.02 0.03*** -0.00 0.01 -0.05** -0.03 (0.723) (0.007) (0.925) (0.490) (0.017) (0.176) Collapse (born 1969-1972) 1991 (19-22) 0.03 0.06** 0.01 -0.01 -0.06*** -0.03 (0.572) (0.000) (0.401) (0.344) (0.006) (0.157) 1996 (24-27) 0.04 0.04** 0.00 -0.01 -0.05** -0.03 (0.442) (0.003) (0.991) (0.270) (0.033) (0.167) 2001 (23-28) 0.05 0.02 -0.01 -0.01 -0.03 -0.02 (0.386) (0.054) (0.496) (0.321) (0.170) (0.435)
Post oil shock (born 1973-1978)
1996 (18-23) 0.08 0.05** -0.01 -0.03** -0.07*** -0.03 (0.100) (0.000) (0.364) (0.011) (0.002) (0.120) 2001 (23-28) 0.05 0.03** -0.01 0.00 -0.07*** -0.02 (0.321) (0.004) (0.233) (0.971) (0.002) (0.257) Observations 74 74 74 74 74 74 (1)
Data is aggregated at the cohort-province level. Estimated using 2 step weighted least squares, where the weights are the mean number of observations in the relevant cohort-province cell.
Table 3b. Differences in FEMALE School Achievement. AB versus Rest of Canada (Census 1976-2001)
(2 step weighted least squared estimation. Robust P-values in parenthesis)1
Low Skill Medium skill High Skill
HS dropout High School 1 yr PS 2 yrs PS 3-4 yrs PS University Pre boom (born 1953-1956)
1976 (20 -23) -0.02 0.03 -0.00 -0.02 0.00 -0.02 (0.771) (0.356) (0.887) (0.262) (0.996) (0.538) 1981 (25-28) 0.01 0.02 -0.01 -0.02* -0.01 -0.00 (0.892) (0.396) (0.665) (0.075) (0.704) (0.952) 1986 (30-33) -0.03 0.03 -0.01 -0.01 -0.01 0.01 (0.627) (0.277) (0.788) (0.641) (0.599) (0.676) Early boom (born 1957-1960)
1976 (16-19) 0.05 0.04 -0.02 -0.01 0.00 -0.02 (0.545) (0.242) (0.515) (0.377) (0.895) (0.652) 1981 (21-24) 0.02 0.05** -0.01 -0.01 -0.02 -0.01 (0.686) (0.042) (0.492) (0.395) (0.264) (0.749) 1986 (26-29) 0.00 0.03 -0.01 -0.00 -0.02 -0.03 (0.994) (0.238) (0.483) (0.895) (0.256) (0.265) 1991 (31-34) 0.01 0.04** -0.01 -0.01 -0.02 -0.03 (0.909) (0.039) (0.744) (0.251) (0.212) (0.212) Boom (born 1961-1964) 1981 (17-20) 0.04 0.07*** -0.03 -0.02 -0.01 -0.01 (0.463) (0.006) (0.110) (0.124) (0.593) (0.604) 1986 (22-25) 0.02 0.04* -0.01 -0.00 -0.04** -0.03 (0.667) (0.074) (0.471) (0.895) (0.039) (0.303) 1991 (27-30) 0.01 0.03* -0.02 0.00 -0.03** -0.01 (0.774) (0.085) (0.357) (0.719) (0.043) (0.497) 1996 (32-35) 0.04 0.02 -0.02 0.01 -0.03** -0.02 (0.383) (0.298) (0.290) (0.278) (0.042) (0.272) Slow down (born 1965-1968)
1986 (18-21) 0.04 0.03 -0.01 -0.02 -0.02 -0.02 (0.530) (0.270) (0.748) (0.123) (0.310) (0.355) 1991 (23-26) 0.03 0.03 0.01 0.02* -0.05*** -0.06** (0.533) (0.210) (0.664) (0.097) (0.008) (0.020) 1996 (28-31) 0.03 0.02 -0.00 0.02** -0.03* -0.05* (0.557) (0.386) (0.859) (0.045) (0.094) (0.058) Collapse (born 1969-1972) 1991 (19-22) 0.05 0.05** -0.01 -0.02 -0.04** -0.04 (0.385) (0.037) (0.531) (0.164) (0.041) (0.114) 1996 (24-27) 0.04 0.04 -0.00 0.01 -0.03* -0.05* (0.529) (0.121) (0.904) (0.500) (0.067) (0.062) 2001 (23-28) 0.02 0.02 -0.00 0.00 -0.04** -0.04 (0.678) (0.314) (0.902) (0.705) (0.023) (0.132) Post oil shock (born 1973-1978)
1996 (18-23) 0.06 0.06*** -0.01 -0.01 -0.03** -0.04*
(0.167) (0.005) (0.455) (0.169) (0.039) (0.052)
2001 (23-28) 0.06 0.05** -0.00 -0.01 -0.05*** -0.06***
(0.176) (0.018) (0.839) (0.142) (0.001) (0.010)
Observations 74 74 74 74 74 74
(1) Data is aggregated at the cohort-province level. Estimated using 2 step weighted least squares, where the weights are the mean
number of observations in the relevant cohort-province cell. * significant at 10%; ** significant at 5%; *** significant at 1%
Figure 1.World Oil Prices
Source: Historical Statistics of Canada, Value of Crude Petroleum Produced, thousands of dollars, Series Q20
Figure 2: Per Capita Private Sector Investment,
Saskatchewan, Alberta, and Ontario (1992 dollars)
Sources: Capital Expenditures, Total Private Investment, 1963-1990: CANSIM v50545, v50326, v49778. Capital Expenditures, Private, 1991-2004: CANSIM v759375, v759368, v759354. Population: CANSIM
v469503, v469188, v468558. Consumer Price Index, all-items, Canada: CANSIM v737344.
0 20 40 60 80 100 120 1946 1949 1952 1955 1958 1961 1964 1967 1970 1973 1976 1979 1982 1985 1988 1991 1994 1997 2000 2003 2006 Oil price in 2001 $C 0 2000 4000 6000 8000 10000 12000 1963 1966 1969 1972 1975 1978 1981 1984 1987 1990 1993 1996 1999 2002 Alberta Saskatchew an Ontario
Figure 3. Employment rates by Province 1976-1992
Source: CANSIM series v2461476.. v2467987
40 60 80 100
1976 1977 1978 1979 1980 1981 1982 1983 1984 1985 1986 1987 1988 1989 1990 1991 1992
BC Alberta Ontario Saskatchewan Manitoba QUEBEC
Male Employment rate
30 50 70
1976 1977 1978 1979 1980 1981 1982 1983 1984 1985 1986 1987 1988 1989 1990 1991 1992 1993
QUEBEC Ontario Manitoba Saskatche3wan Alberta BC
Figure 4. Weekly Earnings in Selected Cities (industrial composite)
Figure 5: Personal Income Per Capita Relative the Canadian Average, 1946-2004 0 20 40 60 80 100 120 140 1946 1948 1950 1952 1954 1956 1958 1960 1962 1964 1966 1968 1970 1972 1974 1976 1978 1980 1982 1984 1986 1988 1990 1992 1994 1996 1998 2000 2002 2004 C an ad a= 100 MB SK AB
Source: Provincial incomes are divided by the value of Canada in a given year. (Sources: Personal Income Per Person 1946-1980, Average Personal Income: Economic Reference Tables (1991),
Published by Government of Canada, Department of Finance (Table 16). Personal Incomes Per Person 1981-2004 from Cansim Table 3840013; Canada, CANSIM II SERIES V691802, Manitoba, CANSIM II SERIES V691963, Saskatchewan, CANSIM II SERIES V691986, Alberta, CANSIM II SERIES V692009)
Figure 6. Percentage not enrolled in a post secondary program by province.
Source: Labour Force Survey (1976-2006)
Figure 7. Oil Prices and the Enrolment Gap (Alberta vs the rest of Canada)
Labor Force Survey and Historical Statistics of Canada, Value of Crude Petroleum Produced, $000, Series Q20
S 0.4 0.45 0.5 0.55 0.6 0.65 0.7 0.75 0.8 0.85 1976 1978 1980 1982 1984 1986 1988 1990 1992 1994 1996 1998 2000 2002 2004 2006 ON MB SK AB BC % not enrolled in educational program 0 20 40 60 80 100 120 1976 1978 1980 1982 1984 1986 1988 1990 1992 1994 1996 1998 2000 2002 2004 2006 2008 -16 -14 -12 -10 -8 -6 -4 -2 0 2 Oil price in 2002 Enrolment gap (% of 17-24 yos)
Figure 8a Distribution of Age at Graduation of Highest Degree. AB Males
Figure 8b Distribution of Age at Graduation of Highest Degree. AB Females
Source: Authors calculations using the IALS. The 50 point estimate Epanechnikov kernel function with optimal width is used