Developing and applying a multi-purpose land cover validation dataset for Africa
1
Tsendbazar, N-E1*., Herold, M1., de Bruin, S1., Lesiv, M2., Fritz, S2., Van De Kerchove, R3., Buchhorn, M3.,
2
Duerauer, M2., Szantoi, Z4,5., and Pekel, J-F4
3
1 Wageningen University & Research, Laboratory of Geo-Information Science and Remote Sensing,
4
Droevendaalsesteeg 3, 6708 PB, Wageningen, the Netherlands
5
2 International Institute for Applied Systems Analysis (IIASA), Schlossplatz 1, A-2361 Laxenburg, Austria.
6
3 Flemish Institute for Technological Research (VITO), Mol, Belgium
7
4 European Commission, Joint Research Centre, Directorate for Sustainable Resources, 21027 Ispra, Italy
8
5 Department of Geography and Environmental Studies, Stellenbosch University, Stellenbosch 7602, South
9
Africa
10
* Corresponding author: [email protected]
Developing and applying a multi-purpose land cover validation dataset for Africa
12
Abstract 13
The production of global land cover products has accelerated significantly over the past decade thanks 14
to the availability of higher spatial and temporal resolution satellite data and increased computation 15
capabilities. The quality of these products should be assessed according to internationally promoted 16
requirements e.g., by the Committee on Earth Observation Systems-Working Group on Calibration and 17
Validation (CEOS-WGCV) and updated accuracy should be provided with new releases (Stage-4 18
validation). Providing updated accuracies for the yearly maps would require considerable effort for 19
collecting validation datasets. To save time and effort on data collection, validation datasets should be 20
designed to suit multiple map assessments and should be easily adjustable for a timely validation of new 21
releases of land cover products. This study introduces a validation dataset aimed to facilitate multi-22
purpose assessments and its applicability is demonstrated in three different assessments focusing on 23
validating discrete and fractional land cover maps, map comparison and user-oriented map assessments. 24
The validation dataset is generated primarily to validate the newly released 100m spatial resolution land 25
cover product from the Copernicus Global Land Service (CGLS-LC100). The validation dataset 26
includes 3617 sample sites in Africa based on stratified sampling. Each site corresponds to an area of 27
100m×100m. Within site, reference land cover information was collected at 100 subpixels of 10m×10m 28
allowing the land cover information to be suitable for different resolution and legends. Firstly, using this 29
dataset, we validated both the discrete and fractional land cover layers of the CGLS-LC100 product. 30
The CGLS-LC100 discrete map was found to have an overall accuracy of 74.6+/-2.1% (at 95% 31
confidence level) for the African continent. Fraction cover products were found to have mean absolute 32
errors of 9.3, 8.8, 16.2, and 6.5% for trees, shrubs, herbaceous vegetation and bare ground, respectively. 33
Secondly, for user-oriented map assessment, we assessed the accuracy of the CGLS-LC100 map from 34
four user groups’ perspectives (forest monitoring, crop monitoring, biodiversity and climate modelling). 35
Overall accuracies for these perspectives vary between 73.7% +/-2.1% and 93.5% ±0.9%, depending on 36
the land cover classes of interest. Thirdly, for map comparison, we assessed the accuracy of the 37
Globeland30-2010 map at 30m spatial resolution. Using the subpixel level validation data, we derived 38
15252 sample pixels at 30m spatial resolution. Based on these sample pixels, the overall accuracy of the 39
Globeland30-2010 map was found to be 66.6 ±2.4% for Africa. The three assessments exemplify the 40
applicability of multi-purpose validation datasets which are recommended to increase map validation 41
efficiency and consistency. Assessments of subsequent yearly maps can be conducted by augmenting or 42
updating the dataset with sample sites in identified change areas. 43
Keywords: Land cover validation, Validation data, Multi-purpose assessments, Discrete and fractional 44
land cover, Map comparison and User specific accuracies. 45
1. Introduction 46
Land cover mapping at continental and global scales provides valuable information on the earth’s 47
surface and is used for many applications aiming to understand and to adapt to the changing environment 48
(Verburg et al. 2011). As such, good quality land cover maps are required by multiple institutions, 49
governments and researchers related to climate change, biodiversity and conservation, and zero-hunger 50
efforts (Romijn et al. 2016). 51
The first satellite-based global land cover map dates back to 1994 (DeFries and Townshend 1994). Over 52
the past decades numerous global land cover maps were produced using medium resolution satellite data 53
(Arino et al. 2007; Bartholomé and Belward 2005; Friedl et al. 2002; Land Cover CCI. 2014; Tateishi 54
et al. 2011). Pioneering the productions of higher resolution land cover mapping at large scale, 55
researchers have created global and continental scale land cover products using Landsat (Chen et al. 56
2015; Gong et al. 2013; Hansen et al. 2013) and Sentinel-2 data (CCI Land Cover 2017a). Our 57
understanding of the changing environment is further enhanced with the recent land cover change 58
products namely annual LC-CCI land cover maps (CCI Land Cover 2017b), Global Surface Water 59
Explorer (Pekel et al. 2016), Global Human Settlement Layers (Pesaresi et al. 2016) and Global Forest 60
Change datasets (Hansen et al. 2013). 61
Advancements in land cover mapping at global or continental scales are being made continuously thanks 62
to open access high spatial and temporal resolution remote sensing data and increased processing 63
capabilities such as cloud computing. This is evident in the acceleration of developments of new land 64
cover products over the current decade (Herold et al. 2016) and in the emerging high resolution land 65
cover products generated using cloud computing facilities such as the Google Earth Engine (Gorelick et 66
al. 2017). Complementing the higher resolution (~30m) large scale land cover mapping (e.g., CCI Land 67
Cover (2017a) and Chen et al. (2015)), Copernicus Global Land Service (CGLS) aims to provide an 68
operational global land cover mapping by focusing on yearly mapping from 2015 onwards with flexible 69
thematic detail. The first product was generated for Africa at 100m resolution and it includes discrete 70
(fixed legend) and fractional (vegetation continuous field layers providing estimates of fractions of land 71
cover types: trees, shrubs, herbaceous vegetation and bare soil) maps (Copernicus Global Land Service 72
2017). 73
Although, the validation of global land cover products has become a common activity for assessing their 74
quality and usability (Herold et al. 2016), validation activities should adjust to the emergence of new or 75
subsequent products without much additional effort. Most global land cover validation datasets are 76
collected via visual interpretation (Chen et al. 2015; Tsendbazar et al. 2015b; Xiong et al. 2017), a labour 77
intensive task requiring efforts of multiple mapping and image interpretation experts (Defourny et al. 78
2011; Mayaux et al. 2006; Scepan et al. 1999). To guarantee the independence from the training data 79
and the consistency of the validation results (as well as to save time and effort), such datasets should be 80
designed to be suitable for multiple map assessments and could be re-used, to provide timely quality 81
assessments on the new and subsequent land cover products. 82
However, most existing validation datasets were generated to validate a single land cover map and their 83
characteristics such as sample site areas and thematic legends are not suitable to be used for validating 84
multiple maps. For example, a validation dataset (with some 150 000 sample locations) for the 85
Globeland30 map (Chen et al. 2015) is limited to assessing other maps having similar resolution as the 86
Globeland30. Similarly, the validation dataset developed for the GlobCover 2009 map (Defourny et al. 87
2011) is constrained to be used for assessing maps with medium resolution (~300m) (CCI Land Cover 88
2017b). A recent review of metadata on global land cover validation datasets found that re-using a 89
validation dataset to assess another map usually comes at a cost, namely loss of spatial and thematic 90
detail (Tsendbazar et al. 2015b). This restricts the usage of validation datasets for purposes such as 91
assessing fraction maps, map comparisons and map assessments from different users’ perspectives. For 92
example, most validation datasets represent the reference land cover as discrete classes according to 93
fixed legends. Therefore they do not record land cover fraction information (e.g., tree cover fractions). 94
As such their utility for validating land cover maps is limited (Tsendbazar et al. 2015b). 95
The call for a validation dataset suitable for multiple map validation was initiated by an international 96
community, i.e., the Global Observations of Forest and Land Dynamics (GOFC-GOLD) (Herold et al. 97
2009). GOFC-GOLD emphasizes the importance of inter-operability and comparability of global land 98
cover maps to help map users select the most suitable maps for their needs (Herold et al. 2008). A 99
statistical comparison of several land cover maps requires a validation dataset that has been acquired by 100
transparent means and that is suitable for multiple map assessments in terms of spatial resolution and 101
thematic legends. For example, the class “forest” can have different definitions (e.g., >30% or >60% 102
forest density)(Jung et al. 2006), thus the validation dataset used for comparison should be able to 103
accommodate such differences. Therefore, GOFC-GOLD and the working group on calibration and 104
validation of the Committee on Earth Observation Satellites (GEOS-WGCV) proposed a multi-purpose 105
validation dataset (Herold et al. 2009) which was further detailed in Olofsson et al. (2012). For improved 106
re-usability, the dataset was designed to be flexible in terms of sample selection, sample unit area and 107
thematic detail (Olofsson et al. 2012). For example, the reference land cover in a sample unit area (5km 108
× 5km) is generated from classifications of very high resolution (2m) images and this makes the dataset 109
suitable for assessing maps with different resolutions up to 5km × 5km. Fractional coverage of land 110
cover types within the sample unit area can also be estimated with this dataset. The initial sample 111
comprised 500 sites and could be increased if required (Stehman et al. 2012). The dataset has been 112
published by the United States Geological Survey (Pengra et al. 2015). However, thematically it only 113
comprises four land cover categories, i.e., trees, water, bare, and other. 114
Map users may require different thematic classes depending on the purpose of applications using land 115
cover maps (Tsendbazar et al. 2016a). For instance, confusion between bare land and natural grassland 116
may not be important for users who are only interested in cropland areas. The overall map accuracy of 117
cropland/non-cropland areas would be different than the overall accuracy reported by the map producers 118
that report confusion errors for all classes. To report map accuracy from different users’ perspective, a 119
validation dataset needs to be compatible with multiple legends. Tsendbazar et al. (2016b) used a re-120
interpreted version of the GlobeCover-2005 validation dataset for validating and comparing three global 121
land cover maps for 2005 from different users’ perspective. Although this dataset’s thematic detail is 122
compatible with multiple maps, it is only suitable for validating medium resolution (~300-500m) global 123
land cover maps (Defourny et al. 2011). Pengra et al. (2015) and Tsendbazar et al. (2016b) showed that 124
more efforts are needed to create validation datasets that match different spatial and thematic detail as 125
well as different users’ perspectives. 126
Subsequent releases of land cover products should be provided with updated independent validation 127
reports according to the Stage 4 validation requirements of the CEOS-WGCV (Herold et al. 2009). Most 128
currently available global land cover products do not meet this requirement. Apart from the CCI-2015, 129
which was validated using the GlobCover-2009 validation dataset (CCI Land Cover 2017b), none of the 130
yearly CCI-LC land cover products has been validated. The same applies to the MODIS land cover maps 131
for which only the accuracy of the 2005 map was assessed (Friedl et al. 2010). Validation of new land 132
cover products would benefit from a validation dataset that is updated using less demanding efforts, 133
such as re-interpreting and adding additional sample locations in identified change areas. Stehman et al. 134
(2012) recommended using stratified sampling to facilitate sample augmentation. 135
In this work, we aim (i) to develop a flexible validation dataset suitable for assessments of multiple land 136
cover maps, and (ii) to illustrate its applicability for multiple-purposes in three different assessments 137
namely validation of discrete and fractional land cover maps, map validations from user’s perspectives 138
and validating a different resolution map for a comparison purpose. It builds on an independent 139
validation activity of the CGLS Dynamic Land Cover product (CGLS-LC100) (Tsendbazar et al. 2017). 140
The CGLS-LC100 is a part of a framework for operational implementation of yearly global land cover 141
mapping. We describe the design and production of the CGLS-LC100 land cover validation data for 142
Africa suitable for assessing land cover maps at 10-100m resolution. Applicability of the validation 143
dataset for multiple purposes is demonstrated for three different assessments requiring different accuracy 144
metrics, legends and resolutions. Firstly, we calculated different accuracy metrics appropriate for 145
assessing the discrete versus cover fraction CGLS-LC100 maps of Africa for the reference year of 2015. 146
Secondly, to compare with the CGLS-LC100 accuracy, we used the validation dataset to assess the 147
accuracy of 30 m resolution Globeland30 2010 map for Africa. Lastly, we assessed the accuracy of the 148
CGLS-LC100 from different users’ perspectives requiring varying legends. While the current study 149
focuses on validation data at African continental scale, the dataset design can be expanded to global 150
scale which can be used for assessing global land cover maps. 151
2. Methods and materials
152 153
2.1.Validation data collection
154
2.1.1. Sampling design
155
A probability sampling scheme was used to allow design-based inference of map accuracies. The sample 156
selection scheme had to be suitable for validating the CGLS-LC100 maps and other land cover maps. 157
Therefore, appropriate choices for sample size, sample selection scheme and sample unit size (spatial 158
support) were considered given constraints imposed by allowable error (Foody 2009; Olofsson et al. 159
2012). 160
Considering the efforts required to collect the validation dataset (expert training, interpretation and 161
quality checking: see Section 2.1.2) a sample size of 2700 sites was considered feasible. Such sample 162
size is similar or larger than those used for statistical assessments of large scale land cover maps 163
(Bontemps et al. 2011; Mayaux et al. 2006; Tateishi et al. 2014). 164
The criterion of statistical probability sampling with known and non-zero inclusion probabilities was 165
followed. Due to its efficiency and ease of accommodating modifications such as an increase in sample 166
size (Olofsson et al. 2012), we used stratified random sampling. We used a global stratification by 167
Olofsson et al. (2012) that is independent from any land cover maps. This stratification is based on 168
Köppen climate zones and human population density following the assumption that current land cover 169
is influenced by climate as natural driver and human disturbances as anthropogenic driver (Olofsson et 170
al. 2012). The stratification according to Olofsson et al. (2012), originally at 5km resolution, was 171
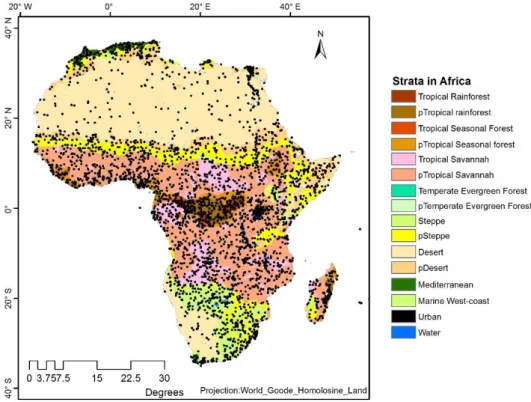
resampled to 100m resolution for this study. For Africa there are 15 strata to which a water stratum was 172
added (Figure 1). 173
The sample allocation process focused on strata in which some land cover classes that are more likely 174
to be misclassified (Olofsson et al. 2012). Since, the Sahel and dry savannah’s heterogeneous landscapes 175
in Africa are known to have lower map accuracies (Tsendbazar et al. 2015a), more sample sites were 176
allocated to these heterogeneous areas and to the populated strata (Figure1). The sample sizes per 177
stratum are listed in Table S1(Supplementary Materials). At each sample site location, reference land 178
cover of an area of 100m × 100m was identified. This support size coincides with the pixel size of the 179
Proba-V satellite data used to generate the CGLS-LC100 land cover products. 180
To increase the sample representation in rare classes such as wetland and urban, an additional set of 181
sample sites was collected. For this, the minimum required sample size per class was set to 250. If the 182
sample size for a specific mapped class was smaller than 250, additional sample sites were collected to 183
meet the requirement. This additional collection mostly focused on urban, wetland vegetation, water and 184
shrubs areas based on the CGLS-LC100 discrete land cover map. Therefore, the augmented sample sites 185
were selected independently of the initial stratification of Olofsson et al. (2012). For each stratum, 186
sample sites were randomly selected as shown in Figure 1. The obtained sample size amounted to 3617 187
sites including the initial 2700 sample sites. 188
189
Figure 1: Spatial distribution of all validation sample sites and the stratification by Olofsson et al 2012: ‘p’
190
before the strata names denote populated part of climate zone.
191
2.1.2. Response design
192
To allow multi-purpose assessments of land cover maps, the spatial and thematic representations of the 193
validation dataset are designed to be compatible for maps with different resolutions and legends. For 194
this, similar to the training data collection used for the CGLS-LC100 product (Lesiv et al. 2016a), each 195
sample site (100m × 100m) was divided into 10×10 small blocks (10m × 10m) and reference land cover 196
was collected at the subpixel level. This makes the validation dataset compatible for assessing maps 197
with 10-100m resolutions. For the thematic representation, we labelled the land cover in terms of generic 198
elements dominating the 10m × 10m subpixels. Land cover elements include trees (different leaf and 199
phenology types), shrubs, grass, crops, built-up areas, bare area, water body, snow &ice and regularly 200
flooded herbaceous area (wetlands). The land cover elements were defined according to the United 201
Nations Land Cover Classification System (UN-LCCS) (Di Gregorio 2005). This allows the validation 202
dataset to be thematically compatible for multiple maps by using different combinations of the land 203
cover elements based on legend definition requirements of multiple maps. 204
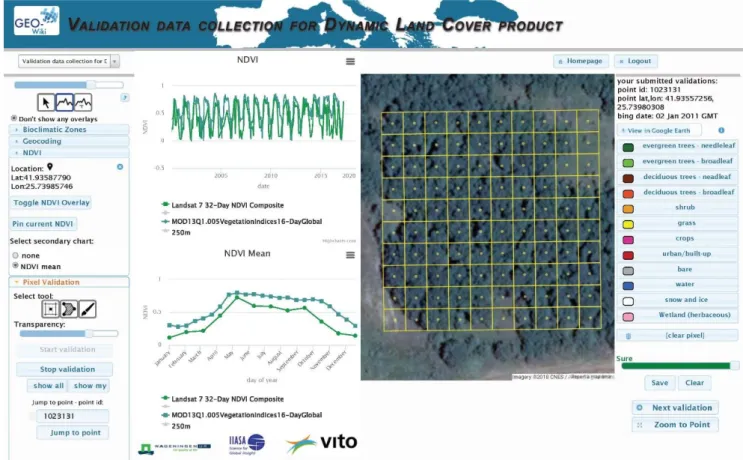
To collect reference land cover data for validation, we have developed a dedicated web-interface through 205
the Geo-Wiki platform (Fritz et al. 2011). The interface provides access to different remote sensing data 206
and allows labelling land cover (Figure 2). The data sources for interpretation include Google and Bing 207
maps as well as Sentinel-2 (Level1C single-date) images with acquisition dates around 2015. Historic 208
time series of NDVI profiles based on MODIS, Landsat and Proba-V data were used for plant phenology 209
identification (Figure 2). 210
211
Figure 2: Screen shot of Geo-Wiki based interface for land cover validation
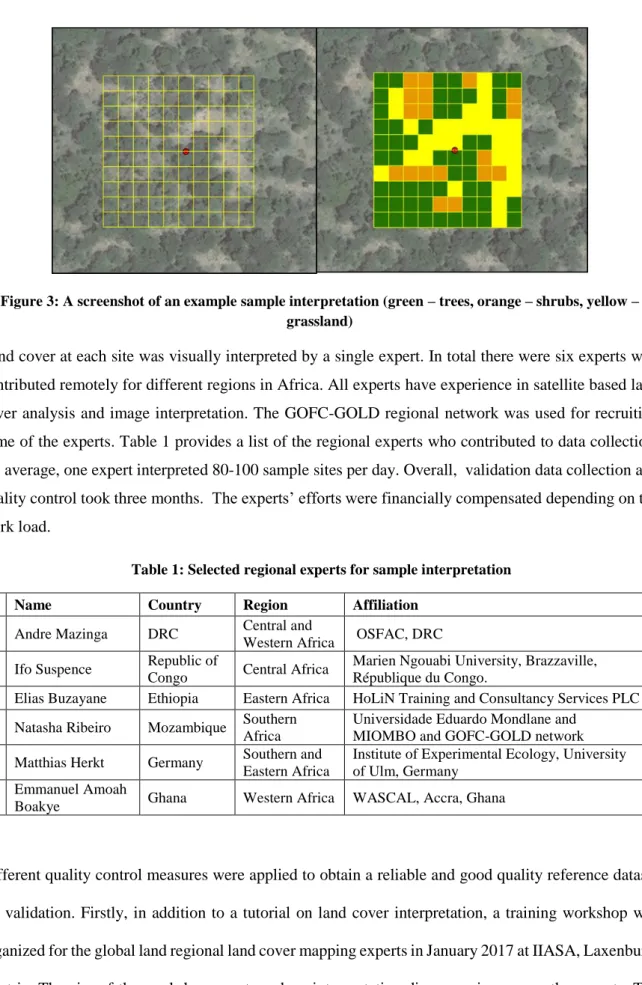
An example of labelling the land cover in a sample site is provided in Figure 3. 213
214
Figure 3: A screenshot of an example sample interpretation (green – trees, orange – shrubs, yellow –
215
grassland)
216
Land cover at each site was visually interpreted by a single expert. In total there were six experts who 217
contributed remotely for different regions in Africa. All experts have experience in satellite based land 218
cover analysis and image interpretation. The GOFC-GOLD regional network was used for recruiting 219
some of the experts. Table 1 provides a list of the regional experts who contributed to data collection. 220
On average, one expert interpreted 80-100 sample sites per day. Overall, validation data collection and 221
quality control took three months. The experts’ efforts were financially compensated depending on the 222
work load. 223
Table 1: Selected regional experts for sample interpretation
224
Name Country Region Affiliation
1 Andre Mazinga DRC Central and
Western Africa OSFAC, DRC 2 Ifo Suspence Republic of
Congo Central Africa
Marien Ngouabi University, Brazzaville, République du Congo.
3 Elias Buzayane Ethiopia Eastern Africa HoLiN Training and Consultancy Services PLC 4 Natasha Ribeiro Mozambique Southern
Africa
Universidade Eduardo Mondlane and MIOMBO and GOFC-GOLD network 5 Matthias Herkt Germany Southern and
Eastern Africa
Institute of Experimental Ecology, University of Ulm, Germany
6 Emmanuel Amoah
Boakye Ghana Western Africa WASCAL, Accra, Ghana
225
Different quality control measures were applied to obtain a reliable and good quality reference dataset 226
for validation. Firstly, in addition to a tutorial on land cover interpretation, a training workshop was 227
organized for the global land regional land cover mapping experts in January 2017 at IIASA, Laxenburg, 228
Austria. The aim of the workshop was to reduce interpretation discrepancies among the experts. The 229
experts were asked to interpret the same 30 sample sites (100m x 100m) and feedback on any 230
discrepancy was provided upon examination by global land cover mapping experts. The global land 231
cover mapping experts were independent from the CGLS-LC100 product generation. Secondly, 232
depending on the available sources of information (e.g., high resolution images and NDVI profiles) and 233
complexity of landscapes (e.g., small holder cultivation areas), the confidence in the interpretation can 234
be different. Therefore, we recorded the interpretation confidence levels (i.e., unsure, bit sure, quite sure, 235
sure). Three percent of the sample sites were tagged as “unsure” or “bit sure”. Lastly, all the 236
interpretations including these unsure interpretations were checked by global land cover mapping 237
experts and feedback on each interpretation was provided to the experts. The regional experts either 238
rebutted the feedback or corrected their interpretations where necessary. 239
2.2.Land cover products
240
To demonstrate applicability of the validation dataset for multiple applications, we selected two land 241
cover maps at different spatial resolutions and different legends: (1) the CGLS-LC100 V1.0 at 100m 242
resolution provided for the 2015 reference year over Africa (Buchhorn et al. 2017); (2) the Globeland30 243
2010 map (Chen et al. 2015). 244
The CGLS-LC100 V1.0 at 100m resolution product, provided for the 2015 reference year over Africa 245
(Buchhorn et al. 2017), is a new product in the CGLS portfolio. The CGLS-LC100 is based on the Proba-246
V 100m data archive (Dierckx et al. 2014), a high quality land cover training dataset (Lesiv et al. 2016a) 247
and several ancillary datasets. More description of the map generation is detailed in Buchhorn et al. 248
(2017). Apart from a discrete land cover type map, the product includes four vegetation continuous field 249
layers providing estimates of fractions (0 - 100%) for the land cover types: trees, shrub, herbaceous 250
vegetation and bare ground. 251
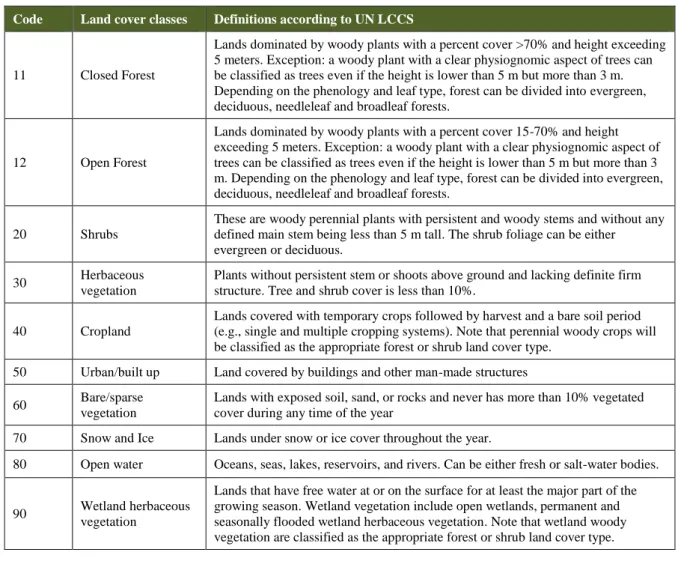
Table 2 lists the land cover classes and their definitions (Lesiv et al. 2016b). 252
Table 2: Land cover classes accounted for in CGLS dynamic land cover map
253
Code Land cover classes Definitions according to UN LCCS
11 Closed Forest
Lands dominated by woody plants with a percent cover >70% and height exceeding 5 meters. Exception: a woody plant with a clear physiognomic aspect of trees can be classified as trees even if the height is lower than 5 m but more than 3 m. Depending on the phenology and leaf type, forest can be divided into evergreen, deciduous, needleleaf and broadleaf forests.
12 Open Forest
Lands dominated by woody plants with a percent cover 15-70% and height exceeding 5 meters. Exception: a woody plant with a clear physiognomic aspect of trees can be classified as trees even if the height is lower than 5 m but more than 3 m. Depending on the phenology and leaf type, forest can be divided into evergreen, deciduous, needleleaf and broadleaf forests.
20 Shrubs
These are woody perennial plants with persistent and woody stems and without any defined main stem being less than 5 m tall. The shrub foliage can be either evergreen or deciduous.
30 Herbaceous
vegetation
Plants without persistent stem or shoots above ground and lacking definite firm structure. Tree and shrub cover is less than 10%.
40 Cropland
Lands covered with temporary crops followed by harvest and a bare soil period (e.g., single and multiple cropping systems). Note that perennial woody crops will be classified as the appropriate forest or shrub land cover type.
50 Urban/built up Land covered by buildings and other man-made structures
60 Bare/sparse
vegetation
Lands with exposed soil, sand, or rocks and never has more than 10% vegetated cover during any time of the year
70 Snow and Ice Lands under snow or ice cover throughout the year.
80 Open water Oceans, seas, lakes, reservoirs, and rivers. Can be either fresh or salt-water bodies.
90 Wetland herbaceous
vegetation
Lands that have free water at or on the surface for at least the major part of the growing season. Wetland vegetation include open wetlands, permanent and seasonally flooded wetland herbaceous vegetation. Note that wetland woody vegetation are classified as the appropriate forest or shrub land cover type.
254
We also assessed the Globeland30 map (Chen et al. 2015) for comparison. The Globeland30 project of 255
China’s Ministry of Science and Technology produced global land cover maps for the year 2000 and 256
2010. The maps were produced at 30m resolution using Landsat TM and ETM+ and the Chinese 257
Environmental Disaster Alleviation Satellite (HJ-1) data. We used the 2010 map for Africa. This map 258
has ten land cover classes of which eight occur in Africa (cultivated land, forest, grassland, shrubland, 259
wetland, water bodies, artificial surfaces and bare land) (Globeland30 2016). The overall map accuracy 260
has been reported to be 79.26% at global level (Chen et al. 2015) but no accuracy information is available 261
for Africa. 262
2.3.Validation of discrete and fractional land cover map
263
To assess the discrete CGLS-LC100 map, the land cover elements of 10 × 10 subpixels were summed 264
for each sample site to derive fractions of land cover types per validation site (e.g. 70% trees and 30% 265
grass = = 70 subpixels trees and 30 subpixels grass). This information was then translated to the CGLS-266
LC100 discrete legend using the UN-LCCS as a basis. For homogeneous sample sites, land cover 267
fractions were directly converted to land cover classes (e.g., 100% water proportion corresponds to water 268
body class). Approximately 37% of the sample sites were homogeneous (100% covered by a single land 269
cover type). In heterogeneous sample sites where conditions can concurrently meet definitions of 270
multiple land cover types, a priority rule was applied, similar to the CGLS-LC100 training data 271
translation approach (Lesiv et al. 2016a). In such cases, the preferential order was open water, urban, 272
cropland, closed forest, open forest, shrubs, wetland, herbaceous vegetation and bare/sparse vegetation, 273
respectively. In the legend translation, +/- 5% deviations from the legend definition thresholds were 274
allowed. This aimed to consider the geolocation error of Google and Bing Map images which were used 275
for land cover interpretation. 276
To estimate the accuracy of the land cover maps, we accounted for unequal inclusion probabilities 277
between different strata because sample sites were not allocated proportionally to the strata areas 278
(Olofsson et al. 2012; Wickham et al. 2010). Based on Pengra et al. (2015), the inclusion probability for 279
stratum h is πh=kh/Kh, where kh is number of sample sites in stratum h and Kh is the population size for
280
stratum h (see Table S1 for inclusion probabilities per stratum). Number of sites is based on the 100m 281
× 100m units. Inclusion probability for the additional sample sites were calculated based on the 282
population of possible sample sites within the rare classes of the CGLS-LC100 map. The estimation 283
weight, the inverse of inclusion probability (𝜔h=1/ πh ), was then calculated and used to construct the
284
confusion matrix accounting for unequal sample inclusion probabilities following the methods described 285
in Stehman et al. (2003) and Wickham et al. (2010). We then estimated the overall and class specific 286
accuracies and their confidence intervals (at 95% confidence level) following Stehman (2014) which 287
specifically addresses estimating map accuracies when the sampling strata are different from the map 288
classes. Thus, by appending three rare class strata to the original stratification, 19 strata were used in the 289
calculations. 290
Validation data does not contain information on temporary waterbody areas because of limited 291
availability on multiple high resolution images per year for each sample location. Thus, we merged the 292
mapped classes of permanent and temporary waterbody for the accuracy assessment. Owing to the 293
limited sample size for combinations of forest density (closed and open forest) and forest phenology, 294
the accuracy estimation focused on generic classes without taking specific forest phenology into 295
account. 296
To assess the fraction cover layers, fraction information of the land cover types in the validation dataset 297
was directly used. For each cover fraction layer, the mean absolute error (MAE) and root mean square 298
error (RMSE) were calculated (Foody 1996; Pengra et al. 2015). 299
𝑅𝑀𝑆𝐸𝑐= √∑𝑛𝑖=1𝜔𝑖(𝑝𝑖−𝑣𝑖)2
∑𝑛𝑖=1𝜔𝑖
(Eq.1)
300
where RMSEc is the root mean squared error of class c, vi is the reference fraction of class c (in percent), 301
pi is the mapped fraction of class c, 𝜔𝑖 represents the estimation weight for the sample site and n is the 302
total number of sample sites. 303 𝑀𝐴𝐸𝑐 =∑ 𝜔𝑖|𝑝𝑖−𝑣𝑖| 𝑛 𝑖=1 ∑𝑛𝑖=1𝜔𝑖 (Eq.2) 304
where MAEc is the mean absolute error of class c.
305
2.4.Accuracy comparison with other datasets at different spatial resolution
306
For map comparison, the validation dataset should be suitable for the maps being compared in terms of 307
thematic legend and spatial resolution. The CGLS validation dataset can be used to assess land cover 308
maps with 10-100m resolutions. Information on generic land cover elements of this dataset also makes 309
it suitable for maps with different legends. To compare the accuracy of the CGLS-LC100 discrete map, 310
the validation dataset was used to assess the accuracy of the Globeland30-2010 map (Chen et al. 2015). 311
This map was selected because its pixel size is smaller than the spatial support of the CGLS-LC100 312
validation dataset. 313
To make the validation dataset compatible with 30m resolution Globeland30 map, we extracted pixel 314
values of the Globeland30 map over each subpixel area (10×10m) of the validation dataset. Using the 315
subpixel centroid locations, we selected Globeland30 pixels that spatially overlap with the subpixels of 316
the validation dataset (at least nine subpixel centre points of the validation dataset). The reference land 317
covers over nine subpixels were aggregated to derive reference land cover for 30m pixels. For 318
homogeneous areas, the land cover elements were directly converted to land cover classes. In 319
heterogeneous areas that can have multiple possible land cover types, we used the dominant land cover 320
type as reference land cover. Sample pixels which did not have a clear dominance (e.g., four sub-pixels 321
of trees, four sub-pixels of shrubs and one sub-pixel of water), totalling to 1037 cases, were excluded 322
from the assessment. A total of 15252 sample pixels were available at 30m resolution. 323
Next, the Globeland30 map was evaluated using a stratified one-stage cluster approach (Pengra et al. 324
2015) because multiple 30m sample pixels within the 100m × 100m sites were used for the assessment. 325
Calculation of inclusion probabilities, accuracy estimates and confidence intervals followed the 326
stratified one-stage cluster approach described in Pengra et al. (2015) and Stehman et al. (2003). 327
2.5.Map validation from different users’ perspectives
328
We assessed the accuracy of the CGLS-LC100 product from the perspective of four user groups (forest 329
monitoring, crop monitoring, biodiversity and climate modelling). User requirements in terms of map 330
accuracy, spatial and thematic details were defined for the CGLS-LC100 product by the European 331
Commission’s Copernicus Global Land Monitoring program (Lesiv et al. 2016b). We adopted these 332
requirement specifications and derived lists of land cover classes that were deemed to be of interest to 333
the user groups. 334
Forest monitoring 335
Researchers and analysts engaged in forest monitoring need information on forest land cover classes. 336
These include closed forests, mixed forests or mosaics of forests with other land cover types, for 337
example, landscapes that are common in Savannah regions in Africa. 338
The current legend of the CGLS-LC100 discrete map includes closed forests (>70% tree cover) and 339
open forests (15-70% tree cover) classes. A tree cover mosaic class (30 – 70% tree cover) is also widely 340
used in forest monitoring applications (e.g., TREES3 dataset) (Achard et al. 2002; Mayaux et al. 2013), 341
We used the tree cover fraction layer of the CGLS-LC100 product to separate the open forests class in 342
the discrete map into two different classes (tree cover mosaic (30-70% tree cover) and open tree cover 343
mosaic (15-30% tree cover)). Figure 4a depicts a map with seven forest-related classes differing in terms 344
of phenology and tree cover densities based on the CGLS-LC100 discrete LC map and tree cover 345
fraction layer. 346
A similar procedure as specified in Section 2.3, was followed to translate the reference data and to assess 347
the accuracy. 348
Crop monitoring 349
Cropland/non-cropland masks are useful for crop monitoring applications. We created a cropland mask 350
based on the ‘cropland class’ of the CGLS-LC100 discrete map and assessed its accuracy from crop 351
monitoring perspective (Figure 4b). Area estimates of this class were also calculated for the whole of 352
Africa. 353
a. b.
c. d.
Figure 4. User specific maps based on the CGLS-LC100 products for (a) forest monitoring, (b) crop
354
monitoring, (c) biodiversity and (d) climate modelling
355
Biodiversity 356
Land cover maps provide base information for many studies involving biodiversity and conservation 357
(Tuanmu and Jetz 2014). In addition to land cover classes referred to in Section 2.3, we considered 358
different forest type classes as useful classes for biodiversity assessments. Similar to Section 2.3, the 359
temporary waterbody class was merged with the permanent waterbody class. Figure 4c depicts the 360
CGLS-LC100 map with eleven classes that were deemed useful for biodiversity assessments. 361
Climate modelling 362
According to the user requirements of the CGLS-LC100 product, the savannah class that is similar to 363
the open forest class is not distinctive for climate modelling purposes (Lesiv et al. 2016b). Thus, open 364
forest was merged with closed forest while only evergreen and deciduous forest types were separated 365
(Figure 4d). Similar to Section 2.3, the temporary waterbody class was merged with the permanent 366
waterbody class. 367
3. Results
368
3.1.Validation of discrete and fractional land cover maps
369
The CGLS-LC100 V1 product (the discrete map and four fraction layers) was assessed using the 370
validation dataset described in Section 2.1. The count-based confusion matrix before correcting for un-371
equal inclusion probabilities is provided in Table S2 (Supplementary Materials). 372
The estimated confusion matrix incorporating unequal inclusion probabilities is shown in Table 3. 373
Overall map accuracy of the CGLS-LC100 discrete map amounts to 74.6% ±2.1% (confidence interval 374
at 95% confidence level)(Table 3). 375
Table 3: Confusion matrix for the discrete CGLS-LC100 map for Africa, expressed in percentages. 376 Reference class S a m p le co u n t To tal Us er 's a cc u ra cy Co n fi d en ce in ter v al + /-Clo se d fo re st Op en fo re st S h ru b s He rb ac eo u s v eg . Cro p lan d s Urb an Ba re /S p arse v eg . Wate r Wetlan d M ap p ed c las s Closed forest 11.89 1.96 0.24 0.13 0.13 0.03 0.15 730 14.5 81.8 3.6 Open forest 1.68 11.04 1.49 1.54 1.19 0.02 0.02 0.58 584 17.6 62.9 4.3 Shrubs 0.07 2.19 5.90 0.92 0.43 0.03 0.25 0.00 0.09 253 9.9 59.7 9.0 Herbaceous veg. 0.23 2.07 2.00 10.92 0.87 0.04 0.70 0.07 0.25 517 17.1 63.7 6.3 Croplands 0.05 1.18 0.59 1.39 5.48 0.00 0.07 0.35 0.10 412 9.2 59.4 6.5 Urban 0.03 0.00 0.03 0.00 0.17 0.00 0.00 250 0.2 70.4 5.7 Bare/Sparse veg. 0.02 0.39 1.27 0.15 28.29 0.28 309 30.4 93.1 3.2 Water 0.01 0.01 0.01 0.01 0.00 0.87 0.03 312 0.9 93.3 2.8 Wetland 0.00 0.00 0.00 0.00 0.00 0.01 0.07 250 0.1 78.0 5.1 Sample count 695 645 292 554 383 180 284 343 241 3617 Total 13.9 18.5 10.6 16.2 8.3 0.3 29.3 1.6 1.3 100 Producer's accuracy 85.4 59.7 55.6 67.4 66.3 68.8 96.4 53.2 5.3 74.6 2.1 Confidence interval +/- 3.4 4.9 8.4 5.8 6.2 29.4 2.5 20.0 1.7
The closed forest and bare/sparse vegetation classes are mapped with relatively high accuracy while the 377
accuracies for open forest, herbaceous vegetation and cropland classes are relatively low. Among the 378
natural vegetation classes, shrubs have the lowest accuracy. The producer’s accuracy of the wetland 379
class is particularly low. Substantial wetland areas are omitted in the CGLS-LC100 map since they are 380
confused with the open forest and herbaceous vegetation classes (Table 3). 381
Table 4 lists the MAE and RMSE for the fraction cover maps. 382
Table 4. Accuracy of the cover fraction layers expressed in percentages.
383
Mean absolute error (MAE)
Root mean square error (RMSE) Tree fraction 9.32 16.75 Shrub fraction 8.83 15.09 Herbaceous vegetation fraction 16.21 24.84 Bare fraction 6.56 14.85 384
The bare area fraction map has the lowest error with a MAE of 6.5% and a RMSE of 14.8% while the 385
herbaceous vegetation fraction has the highest error with a MAE of 16.2% and a RMSE of 24.8%. 386
Upon visual inspection, the deviation from the validation dataset tends to be higher in regions bordering 387
The Sahara desert, The Congo basin and The Horn of Africa. 388
3.2.Accuracy comparison with other datasets at different spatial resolution
389
Based on the 15 252 sample pixels, the overall accuracy of the Globeland30 2010 for Africa was 390
assessed at 66.6% ±2.4 % (at 95% confidence level) (Table 5). 391
Table 5: Confusion matrix for the Globeland30 2010 for Africa, expressed in percentages 393 Reference class S a m p le co u n t To tal Us er 's a cc u ra cy Co n fi d en ce in ter v al + /-Cu lt iv ate d a re as F o re st Gra ss lan d S h ru b lan d Wetlan d Wate r b o d ies Artifi cial su rfa ce s Ba re lan d M ap p ed c las s Cultivated areas 3.84 0.39 1.45 0.24 0.07 0.09 0.04 0.11 1408 6.23 61.6 6.6 Forest 0.61 13.20 2.33 0.86 0.31 0.02 0.00 0.02 3491 17.35 76.1 3.2 Grassland 2.22 5.01 16.68 5.16 0.62 0.05 0.05 2.83 4567 32.62 51.1 3.8 Shrubland 0.31 1.05 2.97 1.48 0.26 0.02 0.00 1.3 1114 7.40 20.0 5.8 Wetland 0.008 0.913 0.25 0.009 0.39 0.155 0 0.025 940 1.75 22.5 9.6 Water bodies 0.004 0.08 0.001 0.00 0.04 1.39 0 0.02 1673 1.54 90.3 5.5 Artificial surfaces 0.024 0.10 0.12 0.00 0 0.001 0.17 0.251 712 0.66 25.9 12.9 Bareland 0.16 0.006 2.12 0.067 0.039 0.59 0.06 29.41 1347 32.45 90.6 4.4 Sample count 1453 4040 3693 942 1212 1739 534 1639 15252 Total 7.18 20.75 25.91 7.83 1.73 2.31 0.32 33.96 100 Producer's accuracy 53.4 63.6 64.4 18.9 22.8 60.2 53.1 86.6 66.6 2.4 Confidence interval +/- 6.5 3.5 4.5 6.1 10.8 24.9 23.5 4 394
Bareland has relatively high class accuracy, followed by the forest class. The forest class is greatly 395
confused with the grassland class and Globeland30 tends to map substantial forested areas as grasslands 396
(Table 5). Cultivated areas and shrubland are also under-estimated due to over-estimation of grasslands. 397
The shrubland and wetland class have the lowest accuracies compared to other classes. 398
The count-based confusion matrix for the Globeland30 map can be found in Table S3 (Supplementary 399
Materials). 400
3.3. Map validation from different users’ perspectives
401
The accuracy of the CGLS-LC100 map from different user’s perspective is summarized in Table 6. The 402
detailed confusion matrices are provided in Table S4-S7. 403
Overall map accuracy for forest monitoring was estimated at 81.3% ± 1.4% (Table 6). The confusion 404
matrix and class specific accuracies show that closed forests types (evergreen broadleaf and deciduous 405
broadleaf) are mapped with higher accuracy (Table S4). Closed evergreen broadleaf forest is mapped 406
with good accuracy (>90%). The accuracy of the tree cover mosaic and the open tree cover mosaic 407
classes are low. 408
The overall accuracy of the cropland mask was found to be 93.5 ±0.9% % (Table 6). The class specific 409
accuracies of the cropland class are 59.4 % and 66.3% for user’s and producer’s accuracy respectively 410
(Table S5). 411
Table 6 : A summary of the considered land cover classes and their accuracies for the users
412
User groups User specific maps and remarks Overall accuracy (area adjusted) / Estimate with 95% confidence intervals
General user (producer) Discrete land cover map with 9 general classes
74.6% ±2.1% Forest monitoring A map with 6 forest related classes
(Figure 4a)
81.3% ± 1.4%
Crop monitoring Cropland and non-cropland mask
(Figure 4b)
93.5 ±0.9% Cropland class:
User’s accuracy: 59.4 ±6.5 % Producer’s accuracy: 66.3 ±6.2%
Biodiversity Discrete land cover map with 11 classes
(Figure 4c)
73.7 % ±2.1% Climate Modelling Discrete land cover map with 9 classes
(Figure 4d)
Fractional land cover maps for trees, shrubs, herbaceous vegetation and bare areas
77.3% ± 2.1%
MAE: 9, 8.8, 16, and 6.5%, respectively RMSE: 16.7, 15, 24.8, and 14.8% , respectively
413
The overall accuracy was assessed at 73.7 % ±2.1% for biodiversity related use. The class accuracies 414
and the confusion matrix are provided in Table S6. The class accuracies are similar to those presented 415
in Table 3. The producer’s accuracy of the open forest, evergreen broadleaf class is low since this class 416
is mostly confused with closed forest evergreen broadleaf and open forest deciduous broadleaf classes. 417
For climate modelling users, the map overall accuracy was determined to be 77.3% ± 2.1% (Table 6). 418
The class-specific accuracies and the confusion matrix can be found in Table S7. For the evergreen 419
broadleaf forest class, the user’s and producer’s accuracies are 95% and 89.6% respectively. This class 420
appears to be slightly under-represented. The deciduous broadleaf forest is slightly over-represented 421
with users and producer’s accuracy of 72.9% and 74% respectively. In addition to the accuracy of the 422
discrete map from the climate modelling perspective, the accuracy of the cover fraction layers provided 423
in Table 6 can be important as climate modellers are often interested in land cover information related 424
to plant functional types and fraction information on the main land cover types are very useful towards 425 this. 426 4. Discussion 427
4.1.The multi-purpose validation dataset development and use
428
We designed and developed a protocol and validation dataset for independent and multi-purpose 429
assessments of land cover products, and we applied it to different land cover maps (discrete and 430
fractional) of Africa. Particularly, the dataset can address multi-purpose assessments of land cover maps 431
namely (1) validating discrete and fractional land cover maps, (2) map comparability, (3) user oriented 432
accuracy reporting, and (4) updated validation of subsequent land products and cost effectiveness for 433
data collections (Defourny et al. 2011; Herold et al. 2008; Mayaux et al. 2006; Tsendbazar et al. 2016b). 434
The results obtained in this study exemplify the first three purposes mentioned above. The last purpose, 435
updated validation of subsequent land products was not specifically demonstrated in this study. 436
However, the current design of the dataset should be suitable for this purpose as explained in this section. 437
Recording the reference land cover information at 10×10m sub-pixel level facilitated the following: 438
(i) To extract class fraction information within the sample site areas; 439
(ii) To collect information on the land cover elements such as trees and buildings to be used for 440
different legends; and 441
(iii) To validate land cover maps at finer resolution (e.g. at Sentinel-2 and Landsat scale) 442
These characteristics make this dataset suitable for multiple map validations requiring different legends, 443
resolutions and requiring different accuracy metrics. 444
A design of multi-objective accuracy assessment was previously introduced for National Land Cover 445
Data of the United States of America (Stehman et al. 2008). This design addresses different aims of 446
accuracy assessments such as class-specific accuracies, land cover proportion accuracies and net change 447
detection accuracy. This design is limited to one map with a fixed legend and resolution and it is for the 448
extent of the United States of America. The CGLS validation dataset is produced for the African 449
continent and the proposed approach can be expanded to global scale applications thanks to the global 450
stratification derived from Köppen climate zones and population density (Olofsson et al. 2012). The 451
current setup for data collection in the African continent (Section 2.1) can be replicated to other 452
continents to collect validation dataset at global scale. If the similar numbers of sample sites were 453
collected for the five other continents, the total sample size would be larger than 20 000. A stratification 454
independent from the target land cover maps allows collecting the validation data while the target map 455
is being produced, thus reducing the lag between map production and its accuracy assessment. 456
Regardless of the stratification chosen, the accuracy estimates will be unbiased for the true accuracy of 457
each map. However, the precision of the accuracy estimates computed from a stratification independent 458
of the target map will be lower than if that map itself would be used for stratification. 459
Thanks to the flexibility of the stratified sampling, the number of sample sites could also be increased 460
if required (Stehman et al. 2012). Increasingly, this characteristic is important to provide timely and 461
updated validation of subsequent land cover products following the requirements of the CEOS-WGCV 462
State 4 validation. For subsequent maps, temporary sets of sample sites can be added to the original 463
(permanent) sample to better represent modified or change recorded areas. A potential strategy would 464
be to re-interpret only part of the permanent sample sites rather than all of them assuming no changes 465
occurred in the sites not re-interpreted. The statistical implications of these adjustments need to be 466
further addressed. 467
4.2.Validation of the discrete and fractional land cover maps
468
We assessed the accuracy of the CGLS-LC100 discrete and fractional land cover maps using the 469
validation dataset described in Section 2.1. The overall accuracy of the discrete map was found to be 470
74.6% ±2.1%. This overall accuracy is comparable with the reported accuracy for the CCI-LC-2015 471
map at global scale (75.3% using only homogeneous sample sites) (Land Cover CCI. 2017). At the 472
African continental scale, Tsendbazar et al. (2015a) found overall correspondences of 50-63% for four 473
global land cover maps (GlobCover 2009, CCI-LC 2010, MODIS-2010 and Globeland 2010). Similarly, 474
the overall accuracy of the Globeland30-2010 map obtained in the current study was assessed at 66.6 475
±2.4% for Africa (Table 4). These results suggest that the CGLS-LC100 discrete map has higher overall 476
accuracy compared to Globeland30 map (Table 5) and other land cover maps for Africa (Tsendbazar et 477
al. 2015a). 478
Closed forest and bare/sparse vegetation classes have higher class specific accuracies followed by the 479
open forest, herbaceous vegetation and cropland classes (Table 3). Among the natural vegetation classes, 480
shrubs are mapped with the lowest accuracies owing to high confusion with open-forest and herbaceous 481
vegetation classes. Confusion between open forests, herbaceous vegetation and shrubs is a known 482
problem for land cover mapping in savannah ecosystems where different vegetation layers (woody and 483
herbaceous vegetation) co-exist (Huttich et al. 2011; Jung et al. 2006). The CGLS-LC100 map slightly 484
over-represents the bare/sparse vegetation class at the cost of herbaceous and shrubs areas, particularly 485
in border regions of the Sahara and Namib deserts (Table 3). The cropland class is confused with open 486
forest and herbaceous vegetation (Table 3). This can be attributed to the difficulty of separating cropland 487
from herbaceous vegetation, and small-scale cultivation in heterogeneous landscapes (Xiong et al. 488
2017). 489
The producer’s accuracy of water and wetland classes are low, although 85% and 81% of the 490
corresponding validation sites showed agreement in the count-based confusion matrix (Table S2). The 491
confusion was mostly with herbaceous vegetation, croplands, open forest and bare sparse vegetation. 492
The very low producer’s accuracy of the wetland class indicates omission of wetland areas in the CGLS-493
LC100 map. The main wetland regions such as Okavango Delta in Botswana, and the Sudd in South 494
Sudan are under-represented in this map. Therefore, further improvements are needed particularly for 495
mapping the wetland and shrubs classes. 496
Among the land cover fraction maps, bare area has the lowest errors (MAE 6.5% and RMSE of 14.8%), 497
while, herbaceous vegetation has the highest errors. This can be attributed to the difficulty of separating 498
herbaceous vegetation from other land cover types. This is confirmed by Table 3 where the herbaceous 499
vegetation class is mostly confused with other classes. For the tree cover fraction map, there is no direct 500
comparison available for Africa. However, compared to reported errors in other regions, the tree cover 501
fraction of the CGLS-LC100 has similar or slightly lower errors (MAE 9.3% and RMSE 16.7%). For 502
example, in South-America, the Landsat based tree cover 2010 product by Hansen et al. (2013) was 503
found to have a MAE of 9.39% (Pengra et al. 2015). A Landsat based rescaled version of the MODIS 504
Vegetation Continuous Field percent tree cover product was reported to have 17% RMSE when 505
compared against LiDAR measurements of four regions in North America (Sexton et al. 2013). 506
In contrast to discrete land cover maps whose accuracies are often reported using overall and class 507
accuracies calculated using confusion matrices (Mayaux et al. 2006; Olofsson et al. 2014), cover fraction 508
maps (e.g., trees, shrubs and herbaceous vegetation) are assessed in terms of the deviation from the 509
reference fraction commonly represented by mean error, MAE and RMSE. Since most validation 510
datasets represent the reference land cover as discrete classes (Tsendbazar et al. 2015b), these datasets 511
cannot be used for assessing cover fraction layers unless the cover fraction layers are hardened (applying 512
a threshold to create discrete classes). Recording reference land cover at higher resolution (e.g., 10m) 513
allowed estimating fraction of main land cover types, thus making this validation dataset suitable for 514
assessing cover fraction layers. This way of collecting reference information could complement 515
substantially the validation datasets created by classification of very high resolution images (Pengra et 516
al. 2015) and LiDAR based measurements in limited locations (Sexton et al. 2013) referred in the 517
previous paragraph. In addition to the four land cover types assessed in this study, other thematic cover 518
fraction layers could also be assessed. 519
4.3.Accuracy comparison with other datasets at different spatial resolution
520
We also assessed the 30m resolution Globeland30 2010 map for Africa using our validation dataset. 521
This demonstrates the suitability of our validation dataset for assessing a higher resolution map for 522
comparison. Based on 15252 sample pixels derived from our validation data, the overall accuracy of the 523
Globeland30 was estimated at 66.6 ±2.4% (Table 5). This accuracy is lower than the accuracy reported 524
by the map producers (79.26% ± 0.2%) (Chen et al. 2015). However the accuracy by Chen et al. (2015) 525
is for the entire globe and while the results obtained in this study are for Africa, a continent that tends 526
to have lower map accuracy than other continents (Tsendbazar et al. 2016a). We used the dominant land 527
cover type for validation, because details in the legend definition of some classes were not clear for this 528
map. However, if more detailed information on the legend thresholds is made available, validation could 529
also be done based on the legend definition of the Globeland30 map. There is a 5-year difference in the 530
reference year of the Globeland30 2010 map and this might have an influence on the lower overall 531
accuracy for this map. The assessment of this map serves here to demonstrate our validation data 532
applicability for maps having different spatial resolutions. It should be noted that temporal discrepancies 533
between validation data and maps to be assessed should be kept at a minimum. 534
Since the CGLS-LC100 validation dataset has reference land cover information at 10m×10m subpixels 535
for a spatial support of 100m×100m, the validation dataset can be used for assessing and comparing the 536
accuracy of maps at 10-100m resolutions, including 10-20m resolution Sentinel-2 based land cover 537
maps. Recently, Lesiv et al. (2017) assessed the prototype version of the Sentinel-2 based CCI20 African 538
land cover map (CCI Land Cover 2017a) using the CGLS-LC100 training and validation datasets. In 539
this case, the reference land cover corresponding to the Sentinel-2 20m×20m pixels was extracted based 540
on 2×2 subpixels of the validation dataset. This further emphasizes the applicability of our validation 541
dataset for higher resolution map assessments. Using the validation data for higher spatial resolution 542
maps increases the number of sample sites (e.g., 15252 for 30m resolution Globeland30). However, in 543
this situation, the accuracy statistics should be estimated using cluster sampling equations (Pengra et 544
al. 2015; Stehman et al. 2003) since otherwise standard errors would be underestimated. 545
4.4. Map validation from different users’ perspectives
546
The land cover fraction information of the validation dataset allowed the assessment of the CGLS-547
LC100 product from different users’ perspectives. We created four maps with different legends (Figure 548
4) reflecting users’ preferences on different land cover types (Lesiv et al. 2016b), and our results showed 549
varying overall accuracies (73.7% ±2.1% for biodiversity to 93.5±0.9 for crop monitoring) (Table 6). 550
Differences can partly be attributed to the number of land cover classes considered in the assessments 551
but also the class combinations used matter. Accuracy for the biodiversity users was lower due to the 552
number of classes used in the assessment. The higher overall accuracy for crop monitoring (cropland 553
and non-cropland map) was to be expected since internal confusions among non-cropland classes are 554
discarded in this assessment. Thus, the cropland class accuracies are also important map quality 555
measures in this case. The overall accuracy of the CGLS-LC100 cropland mask is similar, but the 556
cropland class accuracies are lower compared to the Landsat based nominal cropland mask (Xiong et al. 557
2017). In the forest monitoring applications, a map with more forest classes was created by combining 558
the discrete and tree cover fraction map of the CGLS-LC100 product. This further illustrates the 559
suitability of the CGLS-LC100 product towards creating user-tuned maps. Note that the users of land 560
cover maps are not restricted to the user groups identified in this study and the overall map accuracies 561
will differ for different applications, i.e., different classes of interest are considered. 562
4.5.Lessons learnt on the multi-purpose validation data development
563
Although the validation dataset was successfully developed and utilized for assessing multiple land 564
cover maps, the dataset also has some limitations to be fully compatible for other map assessments. 565
Sample stratification is focused on the heterogeneity of landscapes (natural and human influenced) 566
(Olofsson et al. 2012) and it was not specifically designed to validate changes in the land cover, which 567
may be a prominent issue when the aim is to estimate change areas for each land cover type. For this, 568
additional strata (e.g., change areas for the corresponding period) need to be added to better represent 569
changed areas and the inclusion probability of the augmented sample sites need to be calculated 570
accordingly (Stehman et al. 2012). 571
Furthermore, the CGLS-LC100 validation dataset is based on the Proba-V grid at 100m and this could 572
be problematic for validating another map at 100m resolution in which the pixel alignment (grid) may 573
mismatch the Proba-V one. In contrast, for higher resolution maps e.g., 20-30m, the full coverage of the 574
reference land cover over the target pixel can be calculated and used as reference. For 10m resolution 575
map assessments, geolocation errors may have a bigger impact. To reduce impact of such errors, 576
assessment units of 2×2 or 3×3 pixels can be used after resampling the map to 20m or 30m resolution. 577
This also implies accuracy is evaluated at 20m or 30m resolution rather than at the original 10m. Such 578
approach has been used by Mayaux et al. (2006) and Land Cover CCI. (2014). 579
To support the use of this validation data for other map assessments, future work can focus on 580
developing a service to provide instantly validated user-tuned land cover maps of the CGLS-LC100 581
products. The validation results could also be provided when other land cover maps are uploaded to the 582
service. This ensures the validation dataset is used for validation purpose rather than training or 583 calibration purposes. 584 5. Summary 585
This study designed and developed a multi-purpose validation dataset that aims to be applicable for 586
multiple map assessments. The dataset was developed as part of an independent assessment of the 587
CGLS-LC100 land cover product for Africa. We demonstrated the applicability of the validation dataset 588
for multi-purpose assessments requiring different legends and spatial resolution and requiring different 589
accuracy metrics. 590
We collected a validation dataset consisting of 3 617 sample sites for Africa using a global stratification 591
independent from any land cover map. Reference land cover of the sample sites (100m × 100m area) 592
was recorded at 10m × 10m subpixels by visual interpretation on a dedicated branch of the Geo-Wiki 593
platform with contributions from several regional experts from Africa. Several quality measures were 594
applied to ensure data quality. The response design of this validation dataset facilitates flexibility 595
towards multi-purpose applications. For example, the ability to assess maps of different resolution (10-596
100m) is gained by subpixel level reference land cover information. The validation data also supports 597
assessment of maps with different legends. As opposed to creating legend categories by merging certain 598
classes, subpixel level reference land cover data allow specifically targeting classes defined by user-599
specific composition thresholds. Furthermore, the stratified sampling scheme enables sample 600
augmentation for classes of interest (Stehman et al. 2012). 601
The applicability of the validation dataset was demonstrated for (1) validation of discrete and fractional 602
land cover maps (CGLS-LC100 product: overall accuracy 74.6% ±2.1% for the discrete and MAE 603
6.15%-16% for the fraction cover layers); (2) map comparison (Globeland30-2010 map: overall 604
accuracy 66.6 ±2.4%); and (3) user oriented accuracy reporting (CGLS-LC100 product users: overall 605
accuracy: 73.7% +/-2.1% to 81.3% +/- 1.4%). 606
In addition, the validation dataset is compatible with CGLS’s focus on operational monitoring of land 607
cover with yearly releases of global maps. The global stratification used in the sampling facilitates 608
expanding to global scale by replicating the current setup for data collection in African continent for 609
other continents to collect validation dataset at global scale, with additional resources and expert 610
involvements. The flexibility of stratified sampling allows augmenting the validation dataset for 611
validating subsequent new maps to meet the updated validation requirement of the CEOS-WGCV Stage 612
4 validation. For the latter purpose, sampling needs to be densified in change area by re-interpreting 613
additional sample sites. On the contrary, validation sites in no-change areas can be re-used with little 614
effort by re-interpreting only a part of sample sites in no-change areas. 615
Although the validation dataset was demonstrated to be suitable for multiple purposes of land cover map 616
assessments, there are remaining aspects that require further attention. The validation dataset was not 617
specifically designed to validate changes in the land cover. Thus, if the aim is to estimate change areas 618
for each land cover type, additional strata (e.g., likely change areas) need to be added to better represent 619
those areas. Furthermore, as validation data collection is a collective work, significant effort is needed 620
to maintain a dataset up-to-date. Therefore, to maintain a full utility of a validation dataset, the 621
importance of updating should be recognized. To better understand the importance of the experts’ 622
contribution, interpretation variability and its cause are currently being investigated in separate study. 623
Finally, to provide timely assessments of new and yearly global land cover products, map producers are 624
encouraged to improve the efficiency of validation datasets given the available resources. In this respect, 625
the proposed design of the validation dataset can serve as a basis to improve upon. 626
Acknowledgments 627
This work was supported by the European Commission - Copernicus programme. The authors thank the 628
regional experts from Africa; Andre Mazinga, Ifo Suspence, Elias Buzayane, Natasha Ribeiro, Matthias 629
Herkt, and Emmanuel Amoah Boakye for their contributions in collecting the validation dataset. We 630
thank the anonymous reviewers for their constructive comments that helped us improve the manuscript. 631