This is the author version published as:
This
is
the
accepted
version
of
this
article.
To
be
published
as
:
This is the author version published as:
QUT Digital Repository:
http://eprints.qut.edu.au/
Jin, Hang and Feng, Yanming and Li, Zhengrong (2009)
Extraction of road lanes
from high-resolution stereo aerial imagery based on maximum likelihood
segmentation and texture enhancement
. In: Proceedings of DICTA 2009 :
Digital Image Computing :Techniques and Applications , 1-3 December 2009,
Medina Grand Melbourne, Melbourne, Victoria.
Extraction of road lanes from high-resolution stereo aerial imagery based on
maximum likelihood segmentation and texture enhancement
Hang Jin, Yanming Feng, and Zhengrong Li
School of Information Technology,
Queensland University of Technology, Brisbane, Queensland 4101, Australia [email protected]
Abstract—Accurate road lane information is crucial for advanced vehicle navigation and safety applications. With the increasing of very high resolution (VHR) imagery of astonishing quality provided by digital airborne sources, it will greatly facilitate the data acquisition and also significantly reduce the cost of data collection and updates if the road details can be automatically extracted from the aerial images. In this paper, we proposed an effective approach to detect road lanes from aerial images with employment of the image analysis procedures. This algorithm starts with constructing the (Digital Surface Model) DSM and true orthophotos from the stereo images. Next, a maximum likelihood clustering algorithm is used to separate road from other ground objects. After the detection of road surface, the road traffic and lane lines are further detected using texture enhancement and morphological operations. Finally, the generated road network is evaluated to test the performance of the proposed approach, in which the datasets provided by Queensland department of Main Roads are used. The experiment result proves the effectiveness of our approach.
Keywords-Road lane extraction; stereo aerial imagery; image analysis
I. INTRODUCTION
It is essential that road networks have lane-based features in order enable advanced vehicle navigation applications, such as, lane departure warning and lane-level navigation. These car navigation and safety systems require not only directional information but also an accurate locator service. To meet these requirements, road information must at least include the number of lane, their locations and symbol markings that function as directions guides. One of the common practices of acquiring lane-based roadway network data is to use the probe vehicle equipped with carrier-phase DGPS travelling down different lanes in the road-way [1]. This process is somewhat tedious and inherits some drawbacks, such as the probe vehicle cannot guarantee to stay in the same lane position without variations. Another method for obtaining lane-level road details is to automatically extract lane information from aerial imagery. This method has greater potential to speed up road safety application.
Although the Research on road information extraction from aerial and satellite images can be traced back to the seventies of the 20th century, only few papers address the
issue of lane marking extraction. The major reason for this
is probably due to the fact that this kinds of objects are quite small due to the ground sampling distance (GSD) of the images used for road extraction systems. Within the works of [2-6], road lanes and zebra crossing are also detected from large scale aerial images to provide additional cues for the road centreline extraction. For example, Zhang [3] tried to find zebra crossings with a colorimetric analysis in order to obtain the main road direction. Hinz and Baumgartner [2] proposed a radiometric model of dashed lines to extract those objets so as to assist the procedure of road surface detection. A graph approach was presented in [6] to group road markings patterns. A best-first-search was performed and leaded to find an optimal path in the graph to group those features.
As we can see that these existing road detection approaches from satellite or aerial images are basically limited to the extraction of the road centrelines rather than the road lane details. Until recently, Kim et al [7] proposed a approach to collect road pavement markings in urban areas from aerial images with the Ground Sample Distance (GSD) of 7 cm. The geometric properties and spatial relationship of the lanes and symbol markings are analysed by manual construction and template matching. A specific method for dashed lines and zebra crossings reconstruction has been presented in [8]. The strategy was based on the grouping of image features (i.e. segments) extracted from the images, but suffers from the problem of occlusions mainly due to cars and changing in illumination conditions like shadows areas as well as low contrast due to worn out markings. To overcome these limitations, Tournaire [9] further developed a top-down approach for dashed line detection relying on the stochastic method and definition of geometric, radiometric and relational models.
In this paper, we will design an image analysis based approach to automatically detect the road lane information and further reconstruct the lane level digital road map. The rest of the paper is organized as follows. In Section 2, the original aerial image is preprocessed and orthorectified so as to remove the displacement caused by the tilt of the sensor and terrain relief. In Section 3, we transform the orthorectified RGB image into new color spaces and then extract the road surface from the transformed image by using the method of Maximum Likelihood segmentation. In Section 4, the road lane lines are detected and extracted and furthermore the extracted lane data are vectorized and smoothed. The quality evaluation for the extracted road lane
2009 Digital Image Computing: Techniques and Applications 2009 Digital Image Computing: Techniques and Applications 2009 Digital Image Computing: Techniques and Applications
is given in Section 5. Finally the concluding remarks and the research findings are summarized.
II. PREPROCESSING
The purpose of preprocessing is to improve the image quality and gather data for the next step.
Figure 1. The flow chart of ortho-image production [10].
To obtain road lane details from the aerial images, the images have to be georectified, since only the features extracted from orthoimages can correctly represent the position of the ground objects [10]. Unlike the uncorrected aerial image, the true distance can be measured in the orthoimage since it has eliminated the topographic relief,
lens distortion, and camera tilt, and thus it can represent the earth’s surface accurately. Besides, it is easier to extract ground features in orthoimages, as certain attributes, e.g. the length and width of a road, have known [11].
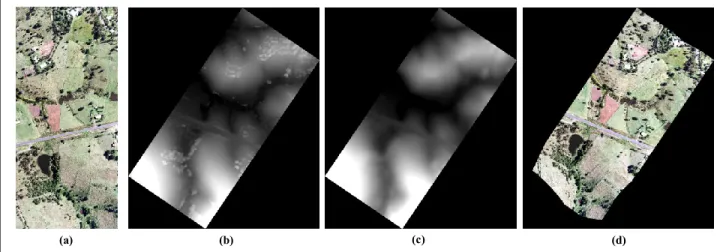
The procedure for geometric processing of stereo images includes two main steps: (i) the DSM generation; and (ii) the image orthorectification. For each image pair, over 50 tie points are selected manually. As the ground control points and the orientation parameters are already provided, thus in the first step, they are directly utilized with the selected tie points for the image triangulation. The images can be further orthorectified by using the DTM extracted from the images themselves (as shown in the work flow of Figure 1). The DSM was computed using a pyramid-based crossing-correlation and subsequent relaxation matching techniques. However, the generated DSM includes modelling of the surface of all entities such as buildings, trees, and not just the terrain, e.g., Figure 2(b). These kinds of ground objects have to be further eliminated before the image orthorectification process. Therefore, the generated DSM was further edited manually so as to remove the ground objects in order to obtain the Digital Terrain Model (DTM), see, e.g., Figure 2(c), which will be used to geometrically correct the raw image. The final orthorectified image is shown in Figure 2(d). The image orthorectification step was implemented using the commercial digital photogrammetric software “Virtuozo”.
Figure 2. (a) The raw aerial image, (b) The generated DSM, (c) The munual edited DTM, and (d) The final orthorectified image.
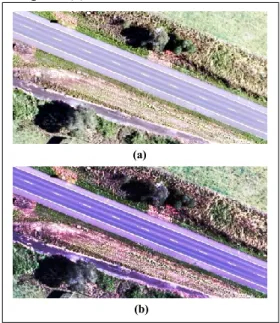
After the raw image orthorectification, the rectified images can be further The raw aerial images typically have a low local contrast due to a wide radiometric dynamic range of the scene content and possible atmospheric disturbances [12]. Therefore, Lookup Table (LUT) stretch function, which uses the mean and standard deviation to determine the range of data values to be transformed, is further used to enhance the image contrast and facilitate the subsequent road lane details extraction process. Comparing Figure 3 (a) with Figure 3 (b), the LUT technique can significantly enhance the contrast of the raw image.
III. SEGMENTATION
After the preprocessing, the orthorectified image can be further utilized to extract the road surface. In order to ensure that only necessary features are utilized to perform the segmentation, the features with slight contribution to the reparability of spectral classes can be disregarded by the Principal Component Analysis (PCA). For instance, the eigenvalues of the covariance derived from the image shown in Figure 4(a) are 15426.5, 554.2 and 393.0 respectively. It is obvious that the first component is predominantly larger than the others and the value is about
(a) (b) (c) (d)
Orientation elements Manual input of stereo tie points
Automatic stereo matching Derivation of Digital Surface Model (DSM) Orthorectification 285 272 272
94.2% with respect to the sum of three eigenvalues in the image. This means that the most of the information in the image is reflected by this component of the image, which is shown as Figure 4(b).
Figure 3. (a) The raw aerial image, and (b) The LUT enhanced mage.
The tested region is located in a rural area, which contains a large percent of vegetation such as trees and grass. Therefore, it is beneficial to mask out the vegetation features from the other objects, which can assist the road surface extraction processing indirectly. Normalized Difference Vegetation Index (NDVI) is a simple numerical indicator that can be used to enhance the vegetation features so that they are more isolated in feature space. NDVI
(−1 ≤ 𝑁𝐷𝑉𝐼 ≤ 1) is defined as eq.1 [13].
𝑁𝐷𝑉𝐼 =𝑁𝐼𝑅−𝑅𝑁𝐼𝑅+𝑅 (1)
where NIR and R are the reflectance values in the near-infrared channel and red channel, respectively.
However, as there are only three bands (Red, Green and Blue) without Near Infrared in our testing dataset. Thus referring to [4], we implemented a similar greenness measure using the band R and G rather than R and NIR with formula as
𝐺−𝑅
𝐺+𝑅 (2)
The greenness measure operation can enhance the vegetation in a RGB image, e.g., the greenness image of Figure 4(a) is shown in Figure 4(c). As illustrated the vegetation has the high grey values, and appears very bright in the image, while other objects have low grey values and thus are relatively dark.
Due to the different color of the road surface from the other ground objects, the RGB to the HIS color space transformation (refer to eq.3) is beneficial and the transformed Hue component is selected. The Hue component of the Figure 4(a) is shown in Figure 4(d), as we can find that the road surface appears darker comparing with other ground features. The scene using the first component of PCT, greenness image and the Hue components of the HIS space is presented in Figure 4(e). In the combined image, the road surface appears as yellow, the bared ground presents as peachblow, water body as blue, grass land as pink, and trees as green. However, it can be easily found that the house roofs and some bared ground surface also have the similar color as road surface, which will cause mistakes for the further image classification procedure.
𝛿 = 𝑀𝑎𝑥 𝑅, 𝐺, 𝐵 − 𝑀𝑖𝑛 𝑅, 𝐺, 𝐵 𝐻𝑢𝑒 = 60°𝐺−𝐵 𝛿 if 𝑀𝑎𝑥 𝑅, 𝐺, 𝐵 = 𝑅 60° 2 +𝐵−𝑅 𝛿 if 𝑀𝑎𝑥 𝑅, 𝐺, 𝐵 = 𝐺 60° 4 +𝑅 −𝐺 𝛿 if 𝑀𝑎𝑥 𝑅, 𝐺, 𝐵 = 𝐵 (3)
Figure 4. (a) The original image, (b) 1st component of PCA, (c) NDVI measurment, (d) Hue component, (e) Combination of b, c, d, and (f) Segmentation
result. (a) (b) (c) (f) (e) (d) (a) (b)
Image classification is implemented by the maximum likelihood (ML) segmentation algorithm, which is a common supervised image segmentation technique in the remote sensing domain. It generally assumes the normal distribution for all classes in each band and thus calculates the probability of any given pixel belonging to a specific class [13]. Each pixel is assigned to the class that has the highest probability (the maximum likelihood). The maximum likelihood classification used in this paper is implemented by calculating the following discriminate functions for each pixel in the image.
𝑔𝑖 𝑥 = ln 𝑝 𝜔𝑖 −12ln |∑𝑖| −21 𝑥 − 𝑚𝑖 𝑡∑𝑖−1(𝑥 − 𝑚𝑖) (4)
where:
i = class
x = n-dimensional data (where n is the number of bands)
𝑝 𝜔𝑖 = probability that class 𝜔𝑖 occurs in the image
and is assumed the same for all classes
|∑𝑖| = determinant of the covariance matrix of the data
in class 𝜔𝑖
∑𝑖−1 = the inverse matrix of ∑𝑖 𝑚𝑖 = mean vector.
Applying the segmentation algorithm onto Figure 4(e), we obtain the result as presented in Figure 4(f). The training samples were selected manually before the segmentation process. The total 6 classes are determined, namely, road surfaces (Red), house roofs (Green), Bare lands (Blue), water bodies (Yellow), vegetations (Cyan) and shadow areas (Magenta), and the training data is obtained manually. It is observed that almost all the road
surfaces are correctly separated except some driveways and bare ground that are misclassified into the road objects. Fortunately, these misclassified objects can be totally removed by the area filter based on the fact that they have smaller enough area than the road surface. Therefore, an object filter with the area threshold larger than the misclassified objects but smaller than the road surface was selected to smooth out these objects.
IV. LANE EXTRACTION
Up to now, we have obtained the segmented result of road surface, based on which the detection of lane details can be carried out accordingly. However, the lane lines do not have much contrast with respect to their road surface background, see e.g., Figure 4(a), which will increase the difficulty for detecting the linear lane feature. The lane markings appear as continuous or dashed white linear features, but some parts of the road surface can also present bright thanks to the high reflectance to the direct sun light in the day time or disturbs from the above vehicles and power lines. Consequently, a texture enhancement method is utilized to enhance the lane markings on the road surface based on the following mathematical qualitative measurement (eq.5).
𝑉𝑎𝑣𝑖𝑎𝑛𝑐𝑒 =∑(𝑥𝑖𝑗−𝑀)2
𝑛−1 (5)
where 𝑥𝑖𝑗 is the DN value of pixel (i, j), n is the number
of pixels in a window, and 𝑀 = ∑𝑥𝑖𝑗/𝑛 is the mean of the moving window.
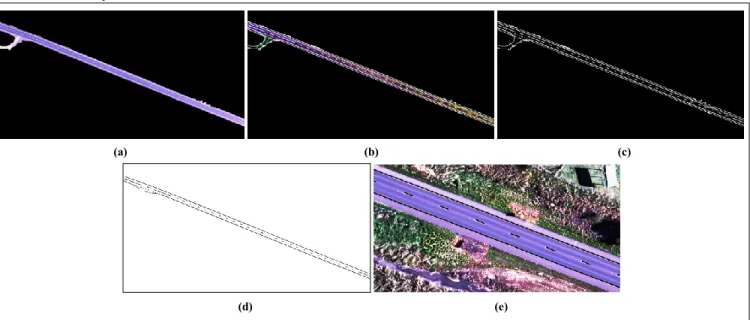
Figure 5. (a) The extracted road surface, (b) Texture enhanced road surface, , (c) Linear feature extracted result, (d) Extracted road lane feature, (e)
Extracted road lane (black) overlapped on the raw image.
As Figure 5(b) has illustrated, the linear features on the road surface are greatly enhanced, which can significantly facilitate the linear feature extraction. After the implementation of texture enhancement, the road lane markings can be easily filtered out using the image thresholding approach, and the extracted result is shown in
Figure 5(c). However, some other linear objects, such as, the over passing power lines and dirty linear features on the road surface, are simultaneously extracted. Therefore, the morphological operations, including morphological opening, closing, can be further used to remove these non-lane features. As we can find that the direction of the over
(a) (b) (c)
(d) (e)
287 274 274
passing power lines are almost perpendicular to the road axis, thus a directional morphological opening can be utilized to remove the white power lines. The dirty markings on the road surface can be masked out using an area filter with predefined filter range 𝜃 − 10, 𝜃 + 10 , and 𝜃 is the pixel number of a single lane line marking. The final extracted lane lines as shown in Figure 5(d).
After the morphological operation, we also employ the thinning algorithm proposed by Wang and Zhang [14] to thin the extracted lane features to a pixel width. We selected the Wang-Zhang thinning algorithm because it does not shorten the ends of the segment and its skeleton product is connected. And then a road network pruning method developed by Jin to vectorize the lane lines and remove the short dangling branches of the centreline caused by the thinning process, the details can be referred to [15]. The Douglas-Peucker simplification [16] with a tolerance of 1 and Bezier interpolation method are finally utilized to simplify and smooth the lane lines. We chose the cubic Bezier curve, which can solve the wiggle and smoothness problem to a great extent, and the formula is as followings:
𝐵 𝑡 = (1 − 𝑡)3𝑃
0+ 3(1 − 𝑡)2𝑡𝑃1+ 3(1 − 𝑡)𝑡2𝑃2+ 𝑡3𝑃
3, 𝑡 ∈ 0,1 (6)
where 𝑃0, 𝑃0, 𝑃0, and 𝑃0 are the sequential four points
on the road marking segments.
The final generated lane lines that overlapped on the original aerial image are illustrated in Figure 5(e), we can find out that the extracted road lane line markings fitted the original image very well.
V. RESULTS AND EVALUATION
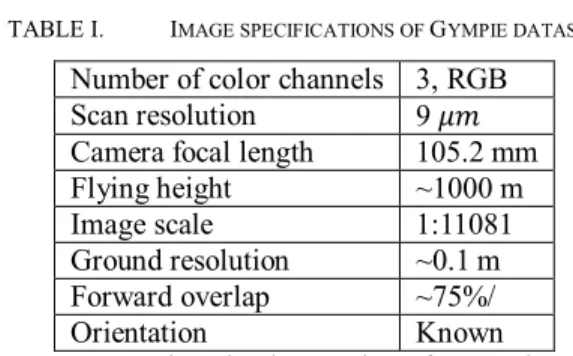
The proposed road lane extraction strategy is tested using the aerial image of Gympie, Queensland, acquired on 28 Nov, 2008. The detail information about the image dataset is presented in Table 1.
Within the test area, the road lane line markings were firstly manually delineated using the Photoshop software. And the manually delineated lane data was used as a reference road to assess the accuracy of the automatic lane extraction algorithm outlined in Sections 2 and 3. Three evaluation indicators presented in reference [13] are calculated for the quantitative comparison.
TABLE I. IMAGE SPECIFICATIONS OF GYMPIE DATASET
Number of color channels 3, RGB Scan resolution 9 𝜇𝑚
Camera focal length 105.2 mm Flying height ~1000 m Image scale 1:11081 Ground resolution ~0.1 m Forward overlap ~75%/ Orientation Known
Let Nce, Ntr and Nte be the number of correctly extracted
road lane length, the true lane length and the total length of extracted lane, respectively, the evaluation indicators are computed as
𝑜𝑣𝑒𝑟𝑎𝑙𝑙 𝑎𝑐𝑐𝑢𝑟𝑎𝑐𝑦 = 𝑁𝑐𝑒/𝑁𝑡𝑟 (5)
𝑐𝑜𝑚𝑚𝑖𝑠𝑠𝑖𝑜𝑛 𝑒𝑟𝑟𝑜𝑟 = (𝑁𝑡𝑒 − 𝑁𝑐𝑒)/𝑁𝑡𝑟 (6)
𝑜𝑚𝑖𝑠𝑠𝑖𝑜𝑛 𝑒𝑟𝑟𝑜𝑟 = 1 − 𝑁𝑐𝑒/𝑁𝑡𝑟 (7)
In the evaluation, a buffer with a width equal to the lane marking is built along the reference data. If the extracted lane line is within the reference data buffer, then it is counted as a matched extraction. Four representative test areas with a size about 2 km2 were selected from the dataset.
For all these test sites, the overall accuracy ranges between 87.4% and 97.5%, the commission error between 8.7% and 21.3%, and the omission error between 2.5% and 12.6%. The correctly extracted lane lines are greatly affected by the trees over the road and the shadows casted by the trees along the road. However, the results can be further improved by using knowledge based image analysis combining parallel lines analysis, DSM and vegetation recognition.
VI. CONLUDING REMARKS
In this paper, we have presented an efficient approach for road lane feature extraction from high resolution stereo aerial images. The experimental results for lane lines extraction from 10 cm GSD photogrammetry data demonstrate that the proposed approach can extract most of the lane feature despite that some are missing or distorted slightly. Overall, certain success has been achieved in our attempt of extraction of road lane information from high-resolution stereo aerial imagery based on image analysis. Further improvement many be achieved by using knowledge based image analysis combining parallel lines analysis, DSM and vegetation recognition.
ACKNOWLEDGEMENT
This work is partially supported by Chinese Scholarship Council (Grant No: 2007101585). The testing aerial image dataset is kindly provided by the Department of Transport and Main Roads, Queensland. The authors would like to thank Bofeng Li for his good suggestions in the data processing.
REFERENCES
[1] Du and M. J. Barth, "Next-generation automated vehicle location systems: positioning at the lane level," IEEE Transactions on Intelligent Transportation Systems, vol. 9, pp. 48-57, March 2008. [2] S. Hinz and A. Baumgartner, "Automatic extraction of urban road
networks from multi-view aerial imagery," ISPRS Journal of
Photogrammetry and Remote Sensing, vol. 58, pp. 83-98, 2003.
[3] C. Zhang, "Towards an operational system for automated updating of
road databases by integration of imagery and geodata," ISPRS Journal of Photogrammetry and Remote Sensing, vol. 58, pp. 166-186, 2004.
[4] E. P. Baltsavias and C. Zhang, "Automated updating of road
databases from aerial images," International Journal of Applied Earth Observation and Geoinformation, vol. 6, pp. 199-213, March 2005.
[5] S. Hinz and C. Wiedemann, "Increasing efficiency of road extraction
by self-diagnosis," Photogrammetric Engineering & Remote
[6] C. Steger, H. Mayer, and B. Radig, "The role of grouping for road extraction," in Automatic Extraction of Man-Made Objects from Aerial and Space Images (II). vol. 245-256, 1997, pp. 1931-1952.
[7] J. G. Kim, D. y. Han, K. K. Yu, Y. L. Kim, and S. M. Rhee,
"Efficient extraction of road information for car navigation applications using road pavement markings obtained from aerial images," Canadian Journal of Civil Engineering, vol. 33, pp. 1320-1331, 2006.
[8] O. Tournaire, N. Paparoditis, F. Jung, and B. Cervelle, "3D road-mark reconstruction from multiple calibrated aerial images," in
ISPRS Photogrammetric Computer Vision and Image Analysis (PCV'06) Bonn, Germany, 2006.
[9] O. Tournaire and N. Paparoditis, "A geometric stochastic approach based on marked point processes for road mark detection from high resolution aerial images " ISPRS Journal of Photogrammetry and Remote Sensing, Doi: 10.1016/j.isprijprs.2009.05.005, May 2009.
[10] N. Mori, "An ortho-image production method from stereoscopic
images," in 18th Asia Conference on Remote Sensing Kuala Lumpur,
Malaysia, 1997.
[11] E. P. Baltsavias, "Digital ortho-image - a powerful tool for the extraction of spatial- and geo-information," ISPRS Journal of Photogrammetry and Remote Sensing, vol. 51, pp. 63-77, 1996. [12] X. Jin and C. H. Davis, "An integrated system for automatic road
mapping from high-resolution multi-spectral satellite imagery by information fusion," Information Fusion, vol. 6, pp. 257-273 2005.
[13] J. A. Richards and X. Jia, Remote sensing digital image analysis: An
introduction, 4 ed. Heidelberg, Germany: Springer, 2006.
[14] P. S. P. Wang and Y. Y. Zhang, "A fast and flexible thinning
algorithm," IEEE Transactions on Computers, vol. 38, pp. 741-745,
May 1989.
[15] H. Jin, Y. Feng, and B. Li, "Road network extraction with new
vectorization and pruning from high-resolution RS images," in 23rd
International Conference on Image and Vision Computing New Zealand Christchurch, New Zealand: IEEE, 2008.
[16] J. Hershberger and J. Snoeyink, "Speeding up the Douglas-Peucker
line simplification algorithm," in Proceedings of the 5th
International Symposium on Spatial Data Handling, Charlestown, South California, USA, 1992, pp. 134-143.
289 276 276