RAPID EXCAVATION & TUNNELING CONFERENCE, June 2013
Washington, DC
Session: Design and Planning
Critical Assessment of RMR based Tunnel Design Practices:
a Practical Engineer’s Approach
Lowson, A.R.
PE, CEng
Mott MacDonald Limited, Tunnels Division, Croydon, Surrey, United KingdomBieniawski, Z.T.
Bieniawski Design Enterprises, Prescott, Arizona, USAABSTRACT: For professional tunnel engineers, for whom money and time are in short supply particularly in early stages of a project, this paper critically assesses what works best with the RMR system, today 40 years after its development and extensive accumulated experience. Five aspects of practical tunnel design are dealt with:
(i) new design charts for rockbolt, shotcrete and steel ribs support as a function of excavation span and rock mass quality,
(ii) deciding on tunnel shape and secondary liners, (iii) RMR ratings graphs updated for practical applications,
(iv) refining prediction of in situ modulus of deformation based on rock mass quality alone, and (v) new approach to handling conditions of squeezing ground and rock bursting. It is demonstrated how numerical modeling of tunnel design issues goes hand-in-hand with RMR-based estimation of rock mass properties and in situ quality.
INTRODUCTION
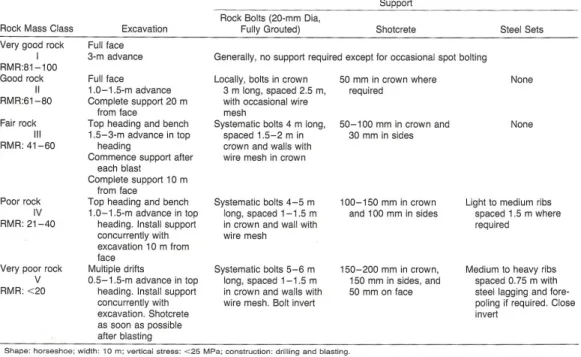
The tunnel support guidelines based on RMR were provided originally in the form of a table (Bieniawski 1989) giving support recommendations for a tunnel span/diameter of 10 meters. In view of the improving technology for rock bolting, shotcrete and steel ribs, it was left to tunnel designers to modify these guidelines for other tunnel sizes, which served its purpose well. Today, after 40 years of use, it has become apparent that it would be convenient for practical tunnel designers to have charts for the selection of rock support as a function of both tunnel size and rock mass quality. Accordingly, this is the main objective of this paper, together with updating the procedure for improved determination of the RMR ratings.
As shown in Table 1, the rock support measures for each rock mass quality include a combination of the various support types. Since, for example, two support methods are additive to some extent, determination of support requirements for individual types, such as rock bolts, shotcrete and steel ribs should be determined, and is dealt with in the next section.
An important question to be asked before proceeding with any recommendations is what is the current need by practical tunnel designers. It is the opinion of these authors that, with respect to modeling versus empirical assessments based on accumulated experience, using continuum models often gives unreliable results for support particularly at shallow depths, although it is useful for cases where squeezing effects are present and rock mass plasticity is extensive. For most purposes, a practical tunnel engineer needs design charts and simple aids to pragmatic design. It is not just an issue of difficulty or complexity; numerical modeling does not currently have a good way of modeling the support effect from interlocking blocks, unless one used discontinuum modeling software such as UDEC. However in this case, one faces the problem that the range of joint parameters that comes from laboratory tests is so wide that at one end any excavation is stable and at the other nothing is stable. Experienced modelers can produce convincing results but the modeling process is arguably rather subjective.
Accordingly, the practical tunnel engineer is interested in design rules for both shotcrete and rock bolts as a function of tunnel size as well as rock mass quality, for assessing final support requirements. We believe the tunnel industry takes a pragmatic view being comfortable with an easy-to-determine RMR rating, including joint orientation as a component.
Table 1. Original guidelines for support of rock tunnels based on the RMR system (Bieniawski 1989)
DESIGN OF SUPPORT SYSTEMS FOR UNDERGROUND EXCAVATIONS Design Load
Rock load on a support system is a function of rock mass condition and initial stress state. Where the rock mass is not overstressed and squeezing is not occurring, the design load is taken as:
Design Rock Load: (1)
where
γr
is a partial factor and
ρr
is rock density.
For γr =1.5 and ρr = 27kN/m3 this gives the following
results:
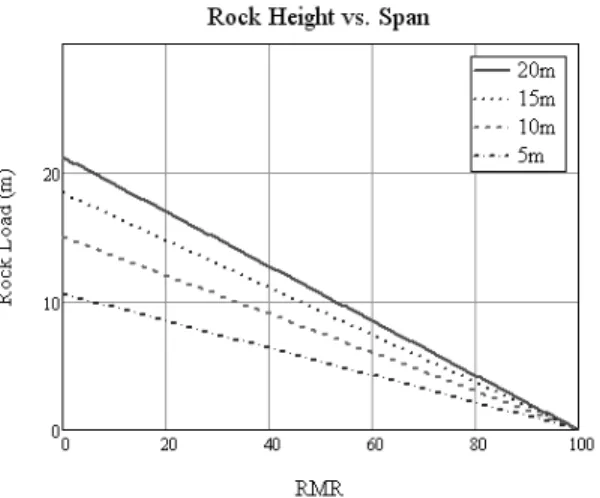
This relationship gives a rock load increasing linearly with decreasing RMR with a maximum value equal to excavation span for a 10m tunnel. For different sizes a modification factor has been applied so maximum load depends on the square root of the span. This was included to compensate for the thickness of
any loosened zone round the tunnel not being proportional to span. It should be noted this load is for gravity-driven situations where there is no overstressing of the rock mass.
Stand Up Time
Depending on rock mass quality and the tunnel span, in some circumstances a tunnel may not require any support as is evident from Figure 3. This will be reflected in the charts that follow for selection of rock bolts, shotcrete and steel ribs.
Figure 3. Stand up time of an unsupported tunnel span, as a function of rock mass quality RMR.
Figure 2.
Height of supported rock versus span
Bolt Spacing
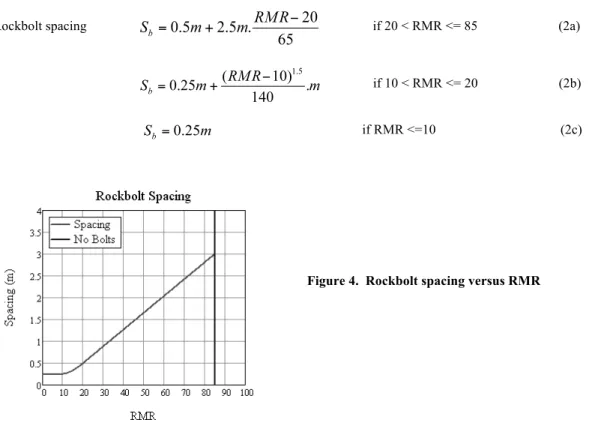
Bolt spacing is taken as a function of RMR only. Spacing has to reflect fracture frequency and the need for shotcrete to provide adequate support between the bolts at the better rock end of the scale where the shotcrete cannot realistically be considered as working on its own as an arch. Spot bolting only is assumed to be needed above RMR = 85.
Rockbolt spacing if 20 < RMR <= 85 (2a)
if 10 < RMR <= 20 (2b) if RMR <=10 (2c)
Bolt Length
Bolt length must vary with span and RMR. Based on empirical guidelines used in mining and the results of numerical modeling studies, the following relationship was obtained:
(3) where Span is width of excavation in meters and Lb is embedded bolt length in meters.
Figure 4. Rockbolt spacing versus RMR
Figure 5.
Rockbolt length chart
Rock bolt capacity
The support capacity of pattern rock bolting is assumed to be given by the capacity of each bolt divided by the area it has to support. Capacity of bolts reduces as RMR reduces because of both the difficulty of obtaining an effective bond and the reducing effectiveness of the bolts in mobilizing arching action in the rock mass. The relationship developed for this is shown below. The chart shows capacity for a typical 25mm bolt with an ultimate strength of 25 tons.
Bolt capacity (4)
where Fb is ultimate tensile capacity of bolt and
γb
is a partial factor.Shotcrete capacity
The design capacity of shotcrete support is based on the concept of the shotcrete acting simply as an arch in compression. The basic formula for this type of support is:
Support Pressure = Thickness x design strength / Radius
However, this has been modified to reflect the reality of both the real action of shotcrete and the construction process. Some different support situations are considered below:
Where rock is of good quality, RMR > 60, only a thin layer is required. Applying a thin layer of shotcrete to an irregular surface in blocky rock results in a layer of shotcrete that is itself irregular, and assuming it behaves as a stand-alone arch is not realistic. In reality its main function will be to lock adjacent blocks together to prevent dropouts and help the loosed rock in the blast damaged zone to support itself and any rock load outside this zone.
For medium quality rock, say RMR = 35 to 60, the shotcrete can more reasonably be thought of as acting as an arch. If large parts of the tunnel are in rock of this quality the tunnel shape will probably be a horseshoe with curved sidewalls, and certainly at the lower end of this scale the shotcrete will have filled a lot of the irregularities in the surface and the inside shape will be curved with few re-entrant areas.
Below RMR values around 35 the excavation is going to require multiple headings unless the tunnel is very small. This is done to keep the size of the face and therefore the size of any heading collapse to manageable proportions. Analysis of the support system by numerical methods or otherwise finds that the shotcrete is increasingly subjected to flexural and shear forces as well as simple axial compression.
Moment / Axial load charts (MN Curves) made to suit national design codes are widely used in the design of liner systems worldwide. If the axial load values on the Y-Axis are divided by member thickness the result is a Moment / Axial Stress curve. The curve shown below is for 32MPa cylinder strength shotcrete with a thickness of 300mm.
Figure 6. Design rockbolt capacity versus RMR for:
Fb = 250kN
γb
= 1.5A notable feature of this curve is the maximum design moment capacity occurring when mean axial stress is around 1/5 x cylinder strength. This is so no matter what shotcrete thickness (or design standard, provided it is follows limit-state principles) is used and this stress level is often used as a target value in the design of liner systems in soft ground. If thickness changes, the X-Axis scale will change but the Y-Axis scale and the shape of the curve remain the same.
This property has been used to develop a relationship for shotcrete design capacity, which reflects the real behavior of shotcrete round an excavation and the demands that are placed on it. The chart below shows design strength for 30MPa shotcrete.
Design capacity (5)
where fck is shotcrete cylinder strength and γs is a partial factor.
Shotcrete Support Chart
Based on the above relationships for the capacities of shotcrete and rock bolts a chart relating Span and RMR for a given thickness of shotcrete can be derived. The capacities of the rock bolts and the shotcrete are considered to be additive.
The irregularities in the lines around RMR = 50 to 20 reflect rock bolts ceasing to have significant support capacity. The middle option in the expression for rockbolt spacing in Eq. 2b, for RMR between 10 and 20, is used as a transition to give a reasonably smooth curve in the chart below.
Figure 7. Interaction curve for 32MPa shotcrete to
Eurocode 2.
Figure 8. Design shotcrete strength for:
fck = 30MPa
γs
= 1.5Non-Circular Profiles
The charts shown in Figs 9 and 10 are for cases where the shape of the tunnel above axis level is of a constant radius, so that Span = 2 x radius. In some situations, usually in good rock, flatter profiles are used with a relatively flat arch in the crown and smaller radius haunches. This is common in transportation tunnels and some large caverns. For these shapes the charts cannot be used directly. Support for these situations can be calculated basing rock load on Span and RMR, but then calculating the contribution of the shotcrete by dividing its design strength by the larger radius used in the crown. Alternatively the charts can be used but the shotcrete thickness must be factored up by crown-radius / half-span.
Steel Ribs
Steel ribs are used less than they once were because of advances in shotcreting technology including the development of wet-mix shotcrete, remotely operated shotcrete robots, and both steel and plastic fibers. These advances have made shotcreting both safer and less time consuming with the added advantage that primary support of good quality shotcrete can satisfy design-life requirements for permanent support that traditional ribs and lagging cannot.
These are still situations where steel ribs are the support system of choice. These situations include very wet excavations, where shotcreting can be ineffective, TBM situations where shotcreting can be disruptive and squeezing ground situations where ductility is particularly important and sliding joints may be necessary to accommodate high levels of convergence.
The design of steel ribs is carried out assuming the ribs are blocked at discrete intervals. Failure can then occur under the resulting combination of axial compression and flexure. Equations for the capacity of blocked ribs (Lowson 2012) are as follows:
Figure 9. Shotcrete design chart
Figure 10. Shotcrete thickness for different tunnel spans
Elastic limit (6)
Plastic Limit (7)
The terms As, Is, Spl and X are section area, second moment of area, plastic section modulus, and
section depth respectively, and Sr is rib spacing. If the blocking angle q is small, typical of ribs with any gap
behind filled with shotcrete, both formulas yield about the same result as an ultimate capacity, which is simply:
P = Asσy / r ‐ the plastic capacity of a circular ring.
The effect of the blocking angle is to reduce capacity as shown below for a typical steel rib arrangement consisting of 152 x 152 x 37kg/m UC’s with 250MPa yield strength at 1m rib centers in a 10m
tunnel.
Increasing the blocking angle from zero to 15 degrees reduces capacity by about 60%. This reduction is independent of yield stress and is higher for lighter ribs and for TH sections and smaller for heavier sections.
Shotcrete support will still be needed to support the ground between the ribs. In most situations the shotcrete can be designed on the basis of carrying a nominal rock load equal to the rib spacing, with the remaining load being supported directly on the ribs, spanning between them as a series of jack-arches. Design of the shotcrete can then be done by considering the shotcrete carrying the load as a simply supported beam spanning between the ribs. The required thickness of shotcrete is then:
(8)
where Sr is rib spacing, ρr is rock density, γr and γf are partial factors on loading and shotcrete flexural strength,
and fflex is the flexural tensile strength of the shotcrete.
For typical flexural strengths of 5MPa peak and a residual strength factor of 1/3, giving a residual flexural strength of 1.65MPa the required thicknesses for typical rib spacings are shown below. Flexure is critical over the full range shown, shear only becoming an issue at shorter rib spacings:
Figure 11.
Rib Support vs. blocking angle
Where it is possible to monitor the support and carry out remedial work if necessary the shotcrete thickness can be determined based on the thinner, uncracked value (dotted line). If it cracks more shotcrete can be added. If repair is not possible an assumption of cracked behavior can be used to allow for drying, thermal, or other effects that can cause cracking with or without a load.
In very poor ground with little or no shear strength the ground will not span effectively between ribs and a shotcrete and rib support system will need to be considered as acting compositely as an arch.
DECIDING ON TUNNEL SHAPE AND SECONDARY LINERS
The shape and size of a tunnel cross section are arguably the most important things a designer has to decide on. The size of the finished internal cross section will generally be driven by functional requirements, for example transportation tunnels will usually have to fit round some roughly rectangular shape to accommodate vehicles, while hydropower and water supply tunnels will need to have a minimum cross sectional area for water flow. Excavation shape has implications for construction as with the exception of TBM drives the invert of the tunnel will ideally be flat to accommodate construction traffic. Excavation shape also has important implications for the design of both primary and secondary liners as it is the major determinant of
how they will have to function as structures.
In principle the most structurally efficient shape for a tunnel is circular, because it means the liner can resist external loads from the ground or from groundwater by acting as a cylinder in compression. Whether the liner is made of steel or concrete a circular shape will minimize material costs and in the case of concrete the absence of flexural effects means reinforcement is often not necessary. However circular finished profiles are awkward to construct compared with D-shapes with flat bottoms both because of the special formwork needed for their construction and because a flat invert forms a better roadway for construction traffic.
The optimum shape for a tunnel is a complex function of the realities of construction, the loads that will be applied to the primary and secondary support, and the needs of the finished tunnel. Of these the difficulty and cost of the excavation process and the primary and secondary support systems are functions of the ground and its state of stress, and often also the groundwater regime. For construction purposes and the cost effectiveness of primary support systems ideal tunnel shapes are as shown in Table 2.
Table 2. Ideal tunnel shape versus ground condition
Ground Shape Comments
RMR > 50 D-shape with vertical or inclined sides and
flat invert. Easiest to construct
RMR 30 to 50 Horseshoe with curved sidewalls Reduces sidewall support costs
RMR 20 to 30 Horseshoe with curved sidewalls and curved
invert A curved shotcreted invert can be more economic that bolting the invert and / or an RC structural invert.
RMR 10 to 20 Shape made up of 3 or more curves Usually 3-curve comprising arch, haunch and invert radii, or 5-curve with arch, shoulder, sidewall, haunch, and invert radii
RMR < 10 Circular
Figure 12.
Shotcrete support between ribs
Secondary liners
Secondary liners, if required, will often have to be designed to carry structural loads. These may include rock loads but often the loading that is the biggest determinant of secondary liner design is water pressure. Where a lined underground structure is built below the existing groundwater table (phreatic surface to some) the structure has to either be designed as a permanent drain or the liner system has to be designed to be
watertight and carry external water pressure.
Permanent drainage of the ground above may in some circumstances, such as hydropower headrace tunnels in fair rock or better, be acceptable and can be done by providing weep-holes or a piped drainage system. However, where the rock is poor and erosion and loosening could occur over the long term this cannot be done. Otherwise environmental considerations, high permanent pumping costs, or functional requirements
may mean liners have to be watertight.
The easiest shape to design for external water pressure is a circular shape, because it can be designed as a compression structure and only the minimum thickness has to be decided, which is easy to do using standard structural codes.
The next most efficient shape is one that is continuously curved. With an appropriate choice of thicknesses and radii it can be designed as a compression structure, with little or no tension on either face. Where tension does arise in analysis and reinforcement is necessary it is often possible to reduce the amount needed to satisfy structural design code requirements by using a non-linear model for reinforced concrete. This is because the reason for using reinforcement is that the concrete is going to crack in tension, and where it is cracking due to flexure it becomes much more flexible once it has cracked. The stress / strain behavior of reinforced concrete can be thought of as elastic – brittle – strain-hardening – plastic, and the secant modulus of cracked reinforced concrete can often be shown to be half or less of its uncracked value, even allowing for long term creep. Some numerical modeling packages now support a non-linear constitutive model for reinforced concrete and doubtless more will in future. Cost effective designs can be made using such models and it will often be found that an acceptable shape can be developed that uses little more than code-minimum reinforcement to distribute and control cracking.
Where the tunnel itself is a straight-sided horseshoe a horseshoe shaped secondary liner may be the most economic solution as it minimizes concrete requirements. However, these need to be proportioned to be designable and these proportions have to be got right in the planning stage. This is particularly an issue with hydropower headrace tunnels where feasibility stage designs often simply show a D-shaped liner throughout, with reinforced concrete used in zones with poorer rock. Where structural liners have sharp corners the liner proportions should always be checked for shear capacity, as this will often govern the design. Shear should be checked an effective depth away from any corner or the end of any flat fillet in a corner, and good target mean shear stresses using factored ULS loads are 0.5MPa for a design with no shear reinforcement and 1.2MPa to 1.5MPa for an easily installable pattern of links.
Designs should consider the possibility of rock load being applied to the liner and for planning and proportioning purposes the liner can be designed to carry a uniform load equal to the rock load from equation 1 unless the rock mass is overstressed because of poor ground or high cover or both.
On many projects the ground will vary along the tunnel and it is usually not economic or practical to change the shape of the excavation to the ideal shape for a given rock class. This would mean changing to the shape one would choose if the whole tunnel was in a particular class of rock. The shape (or shapes) chosen, particularly for hydropower tunnels where simple D shapes are usually preferred, is often a compromise to provide an economic solution. The nature of that compromise, in terms of cost and also in terms of structural design, needs to be understood.
DETERMINING RMR PARAMETER RATINGS FROM CHARTS
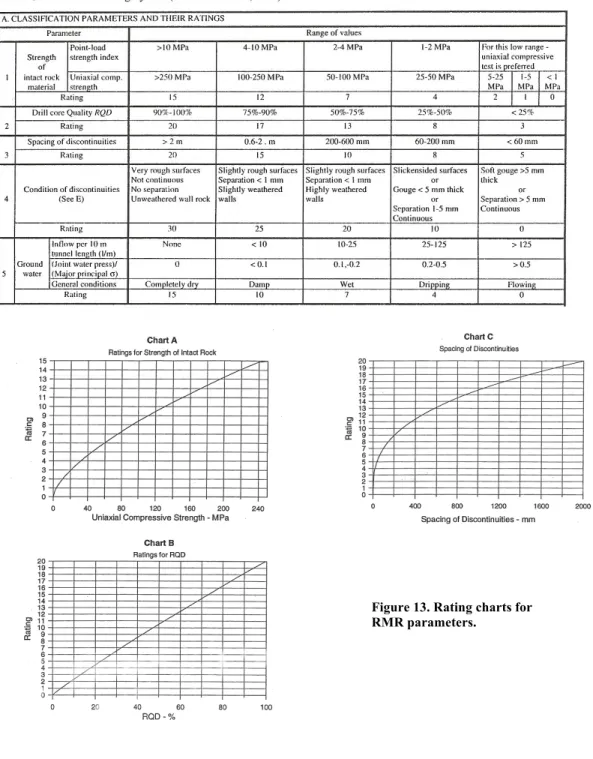
Certain misconceptions are evident in the literature (Bieniawski 2011) concerning determination of the RMR parameter ratings. Traditionally, these were determined as shown in Table 1. However, some users were not aware that the ratings in this table were the average values for the ranges shown, and not the minimum
values. For improved accuracy, it is better to use the recommended graphs, showing the continuous values of the ratings, as depicted in Figures A, B and C. An important aspect to note here is that, the minimum values of all parameters are zero, so that, at worst, the RMR may be zero and not as RMR=8, as some users concluded from Table 3.
Use of parameter RQD is not recommended
This parameter was included originally among the six RMR parameters because the case histories collected in 1972 all involved RQD. Over the years it became apparent that RQD was difficult to determine at tunnel face, being directed to borehole characterization, and it was subsequently combined with parameter "discontinuity spacing" ("joint" spacing) - and named "spacing density" since the two are interrelated. For the best practical use, this led to the preferred use of "fracture frequency" as an invert of "fracture density" - as depicted in Chart D. Neither of these approaches changed the basic allocation of rating values to these parameters.
Figure 13. Rating charts for RMR parameters.
ESTIMATION OF ROCK MASS DEFORMABILITY FOR ANALYTICAL MODELING Following the updated RMR determination procedure discussed earlier and analytical modeling performed in this paper, based on RMR expressions and data, the authors would like to comment on a practical aspect of determining the modulus of rock mass deformability, necessary for numerical analyses. First, one should note that there is a great difference between "determining" and "estimating" rock mass deformability:
determining is highly desirable, estimating is done in the absence of reliable in situ data for preliminary designs. The in situ modulus of deformation is needed for tunnel design to determine deformations and displacements in a tunnel under the load of the overburden and induced stresses. This type of input data is best obtained by such in situ tests as plate bearing tests or large flat jacks, but these are very expensive and time consuming, and accordingly seldom used nowadays. Thus, the RMR rock mass classification system was the first to be used for this purpose (Bieniawski 1978), proposing a direct correlation between rock mass quality and the field modulus of deformation EM, as depicted in Figures 15. This is preferable to using a ratio of the
laboratory-obtained modulus of elasticity to the field modulus, because the latter only adds another variable and uncertainty inherent in laboratory testing procedures. In practice, reliable intact rock modulus data are seldom available, and in some countries laboratories adhering to ISRM recommendations are difficult to find. On the other hand, the RMR - modulus direct correlation was based on numerous in situ large-scale tests, carefully monitored and analyzed, and the data obtained formed the bases of further studies.
Subsequently, Serafim and Pereira 1983 extended the validity of the original relationship to lower quality rock masses.
Today, it is unfortunate that we hear an argument that qualitative estimates are preferable since they are easier and cheaper to use, as it is clearly a step backwards adding more empiricism to an already empirical approach. Nevertheless some designers and planners accept such reasoning.
The authors recommend an approach first proposed by Palmström and Singh 2001, with different relationships for two ranges of RMR, depicted in Figure 15a,as the best fit to experimental data and represent a realistic practical approach, instead of relying on endless correlations appearing in the literature.
Figure 14.
Chart D for combined rating of the discontinuity density parameters: RQD plus discontinuity spacing.
Figure 15 a.
Rock-mass modulus Em vs. RMR (Palmström and Singh 2001)
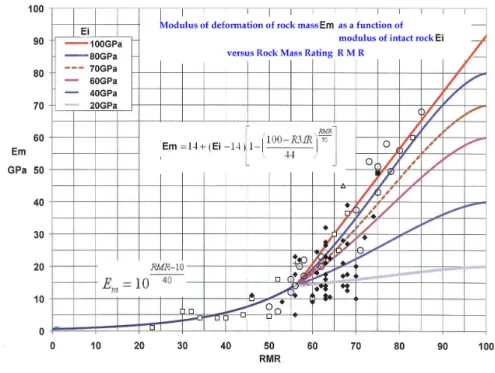
In this investigation, the authors propose an improved relationship for the range of RMR greater than 56. This reflects the idea that, at high RMR, deformations will be dominated by intact modulus, whereas at lower RMR weathering and joint infilling will largely control deformation. This approach has the advantage that modulus values are NOT overestimated at the higher range nor underestimated or overestimated at the lower range. This is more realistic than relying on one sigmoidal equation. The relationship for the range RMR below 56, remains as the one developed by Serafim and Pereira 1983:
for RMR <=56 (9) The new relationship developed by the authors for the higher range is:
for RMR > 56 (10)
Equation (10) is presented graphically in Figure 15b.
A note of caution: a number of sigmoidal equations have been proposed that give rock mass modulus as a function of intact modulus and a rock mass rating. These equations may give a good estimate of modulus given the correct input data, but it is difficult to obtain reliable intact strength or intact modulus values from laboratory tests on samples from highly disturbed rock masses. Because of this limitation something that is commonly done in practice is to base intact modulus values on test results done on good samples of intact rock from locations with competent rock, using either laboratory measurements of intact modulus or on an assumed ratio between intact strength and modulus for a particular rock type. This ignores the possibility that the material in zones with poor rock will often be highly weathered, and it ignores the possibility that even without weathering a zone of poor rock may represent rock, which simply has a lower intact strength.
Figure 15 b. Graphical representation of the Lowson - Bieniawski equation for estimating rock mass modulus of deformation, at RMR >56. Experimental data are defined in Figure 15 a.
Squeezing Ground
Squeezing is a slow convergence of the completed tunnel due to high in situ stresses relative to rock mass strength. It can be very difficult to control and can require very high support pressures possibly combined with high levels of convergence for the rock mass to achieve equilibrium.
The degree of plasticity that will occur around an excavation can be estimated using the ICE Index of Elastic Behavior (Bieniawski and Celada 2011) and this can be used as a guide to whether squeezing will be an issue. The ICE is defined as:
(11)
where: Global strength (12)
Vertical stress (13)
Maximum tangential stress if k > 1 (14)
or: if k <= 1 (15)
Here σci is intact rock strength, Hr is cover to surface, ρr is rock density, and k is ratio of horizontal
to vertical total stress at tunnel elevation.
The term Fs is a shape factor used to account approximately for different excavation shapes. Values
derived from numerical modeling studies are
6m circular Fs = 1.3 14m horseshoe Fs = 0.75 10m circular Fs = 1.0 25m x 60m (W x H) cavern Fs = 0.55
The term σcm used here is global rock mass strength. This is a higher value than the unconfined
strength of the rock mass and originated as a simple strength parameter that can be used for design of support pillars in mining, which are laterally restrained, to an extent depending on their shape, by the rock mass above and below. Rock on the intrados of a tunnel also has some degree of confinement resulting from the shape of the tunnel so the global strength value is relevant to stability.
Based on case histories, numerical modeling, and studies of axisymmetric rock mass behavior using algebraic models, a guide to the conditions where squeezing starts to be significant is:
ICE = 25
This corresponds to a lower limit on rock mass-strength to overburden-pressure ratio of 0.5 if the stress field is isotropic.
The relationships used for deriving the ICE Index can be rearranged to give maximum cover to avoid squeezing resulting in the following:
if k > 1 (16a)
or: if k<=1 (16b)
Another stress-related issue is rock bursting where otherwise competent rock suffers from spalling failure because of its stress state. Hoek and Brown (1980) and Palmström (1995) both present guidelines for intact-strength to tangential-stress ratio suggesting severe spalling effects might start around a ratio of 2. This occurs on the ICE = 25 boundaries at an RMR of 50. Heavy rock bursting will occur at an intact-strength / stress ratio of 1, which the ICE lines reach at RMR = 67.
Figures 16 and 17 below show the cover limits for ICE = 25 for different intact strengths and k-ratios. The plots become horizontal at RMR = 67 where severe rock bursting would occur even in massive rock.
The support charts in Figs. 9 and 10 are based on shotcrete having to resist flexural and shear loads during the construction of a tunnel using multiple headings and so the design strength has been reduced. In very poor rock conditions and, particularly if squeezing behavior is encountered, the invert will have to be closed close behind the heading and the shape will need to be if not circular then at least a reasonably structurally efficient one with a curved shape throughout. Once the invert is closed and the lining can work as a compression structure the reduction in design strength is no longer needed to the same extent. For a circular opening a support system design based on the charts above will have a support capacity equal to around 3 diameters of rock load, so the charts have a built-in allowance for a degree of squeeze. Below ICE = 25 (above the lines on the charts) the support pressure required for stability will start to exceed the design capacity of the support shown in Figs. 9 and 10.
It can be seen from Figures 16 and 17 that squeezing can occur at quite modest cover levels if RMR or intact strength is low, or if there is a high horizontal stress ratio. In many cases the zones of very poor ground encountered will be in short stretches at faults or localized shear zones where the poor ground is supported by more competent ground each side of it. However where squeezing can be predicted it should be allowed for in the design. Charts 15 and 16, or similar charts easily made using the ICE Index as defined above can be used as a simple method for deciding if stress-related problems can occur. Where squeezing is predicted numerical modeling studies should be carried out to investigate its severity and determine appropriate support. Specialist guidelines are also available for dealing with rockburst problems. Because of the complex interaction of excavation shape, in situ stress ratio, and rock mass failure characteristics simple charts cannot be used for support design where stress-related problems are expected, except perhaps, with care, for initial cost estimating for a project.
Figure 16.
Cover limit for different intact strengths, k = 1
Figure 17.
Cover limit for different k ratios, 50MPa intact rock strength
CONCLUSIONS
The objectives of this paper were to provide easy to use design charts for preliminary support design based on RMR, and to cover some of the other issues, excavation shape and squeezing ground in particular, that have to be considered in underground excavation design. The intention was to provide this guidance in a readily accessible form including where possible the mathematics used to generate the charts as well as the underlying logic.
The statement that these charts are for preliminary design must be emphasized. The same is true of all design charts and simplified methods for underground design. They are essentially expert systems, developed to give similar decisions on design to those an expert would make by following a set of rules. It is also true however that while an expert might arrive at what he considered to be a reasonable set of support designs based on information available before construction started, he might well decide it was appropriate to modify those designs during construction. This might mean more support or it might mean less, or it might mean favoring one type of support over another to suit the available equipment or the skills of the workforce. Ground conditions are inherently variable and the stress state of a rock mass can vary dramatically from “average” values assumed in design. There should therefore always be provision in any contract to allow some revision of preliminary support arrangements to suit actual conditions. It is often impossible to foresee every condition that will arise underground as the unexpected can always occur, but it is hoped that the content of this paper will help.
REFERENCES
Bieniawski, Z. T. 1973. Engineering classification of jointed rock masses. Trans. S. Afr. Instn. Civil Engrs,
no. 12, 335-343.
Bieniawski, Z. T. 1978. Determining rock mass deformability: Experience from case histories. Int. J. Rock
Mech. Min. Sci.,v. 15, 237-247. Bieniawski, Z.T. 1989. Engineering Rock Mass Classifications. John Wiley & Sons, New York.
Bieniawski, Z.T. and Celada, B. 2011. Forecasting tunnelling behaviour. Tunnels and Tunnelling Int.,
August, 39-42.
Bieniawski, Z.T. 2011. Misconceptions in the applications of rock mass classifications and their corrections.
www.geocontrol.es, link to: Bieniawski's window. Grandori, R., Bieniawski, Z.T., Vizzino, D., Lizzardo, L., Romualdi, P., and Busillo, A. 2011. Hard rock
extreme conditions in the first 10 km of TBM-driven Brenner Exploratory Tunnel. In RETC Proceedings, SME: Littleton, CO, 667-685. Hoek, E. and Brown, E.T. 1980. Underground Excavations in Rock. Institution of Mining and Metallurgy,
London.
Lowson, A.R. 2012. The support capacity of steel sets. Tunnelling Journal, May, 18-20. Lowson, A.R. and Bieniawski, Z.T. 2012. Validating the Yudhbir-Bieniawski rock mass strength criterion.
Proc. World Tunnel Congress, ITA, Bangkok. Palmström, A. 1995. Characterising rockburst and squeezing by the rock mass index. In Design and
Construction of Underground Structures, New Delhi, 23 - 25 February 1995. Palmström, A. and Singh, R. 2001. The deformation modulus of rock masses. Tunnelling and Underground
Space Technology, v.16, 115-131. Raymer, J.H. and Klecan, W. 2003. Predicting ground conditions and support requirements for Atlanta
tunnels using the RMR system. In RETC Proceedings, SME, ch. 74, 849-863. Serafim, J. L. and Pereira, J. P. 1983. Considerations of the geomechanics classification of Bieniawski. Proc.
Symp. on Enginnering Geology, Lisbon, v. I, 33-44.