Physics Procedia 33 ( 2012 ) 1338 – 1345
1875-3892 © 2012 Published by Elsevier B.V. Selection and/or peer review under responsibility of ICMPBE International Committee. doi: 10.1016/j.phpro.2012.05.220
2012 International Conference on Medical Physics and Biomedical Engineering
A New Feature Selection Method for Internet Traffic
Classification Using ML
Liu Zhen
a,Liu Qiong
baSchool of computer science and engineering ,South China University of Technology,Guangzhou, China [email protected]
bSchool of software,South China University of Technology,Guangzhou, China [email protected]
Abstract
If 248 statistical features are used to characterize network traffic flows, the computation cost of classifier will be overlarge. The feature selection methods referenced here improve the accuracy of majority classes and meanwhile decrease the accuracy in minority classes as the cost. As a result, it brings about the multi-class imbalance problem. In this paper, main contributions include two aspects below. 1) An evaluation criterion based on information theory was proposed to assess how much do one feature bias towards one class. 2) A new feature selection method named BFS was proposed to reduce features and alleviate multi-class imbalance. BFS was compared with fast correlation-based filter (FCBF) and full feature set using Naïve Bayes and ten skewed datasets. The results show that 1) BFS is more advantage to maintain the balance of multi-class classification results than FCBF, such as the reduction of g-mean is just about 8% using BFS, 2) classification accuracy of Naïve Bayes using BFS can achieve to 90%.
© 2011 Published by Elsevier Ltd. Selection and/or peer-review under responsibility of [name organizer] Keywords: machine learning; feature selection; multi-class imbalance; Internet traffic classification
1.Introduction
Valid network traffic classification is fundamental to numerous network activities, including anomaly behavior detecting, traffic engineering, and QoS deployment [1]. Simple port-based and packet payload-based classification techniques are weakened when dealing with the flows using port hopping and encryp-tion. Machine learning (ML) techniques provide a promising alternative in classifying flows based on statistical features. And it has been a hot in traffic classification in recent years.
As we all known that feature selection method plays an important role in ML traffic classification schemes. They are expected to reduce features and improve overall classification accuracy. Even though
© 2012 Published by Elsevier B.V. Selection and/or peer review under responsibility of ICMPBE International Committee. Open access under CC BY-NC-ND license.
the classification accuracy of majority classes is improved, the accuracy of minority classes is reduced significantly. They bring about the multi-class imbalance problem. In ML Internet traffic classification, the multi-class imbalance problem could be formulated as follows: Internet traffic classifiers are overwhelmed by the majority classes and ignore the minority classes. The classification accuracy of minority classes is very small even equal to zero.
However, minority class such as ATTACK could not be ignored and is also very important for some applications such as intrusion detection system. So, it is urgent to improve traditional feature selection methods to settle the multi-class imbalance. In this paper, we devised a new filter feature selection method to focus on alleviating the multi-class imbalance problem.
We investigated on information theory and FCBF feature selection method. A measurement was pro-posed to evaluate the bias degree of one feature in one class. Based on this measurement, we propro-posed a new filter feature selection method named BFS, which was compared with the traditional filter feature selection method FCBF [2] and full feature set (Fullset) on how feature selection methods impact on the multi-class imbalance classification results.
We use g-mean, Mauc, accuracy and recall as classification performance metrics. Experimental results
show that: 1) the number of features in feature subset of BFS is about ten, 2) relative the results of Fullset,
BFS reduce g-mean by 8% - 9%, which is much less than the reduction of FCBF (50%), 3) Mauc and
accuracy of BFS are higher than the results of FCBF in most datasets, 4) classification accuracy of Naïve Bayes using BFS can achieve to 90% on average.
The rest of this paper is organized as follows. We review related works in section 2. Then we describe our feature selection frameworks in section 3. Section 4 introduces the performance metrics. BFS is com-pared with FCBF feature selection method in section 5. Section 6 is the conclusion of this paper.
2.Related works
Feature selection methods are popular used in Internet traffic classification. And they are usually classi-fied into three categories: filter methods, wrapper methods and hybrid methods.
William et al. [3] found that feature selection using correlation-based feature selection (CFS) and con-sistency evaluation (CON) (CFS and CON are filter feature selection methods) can greatly improve com-putational performance, and meanwhile the classification accuracy is not significantly degraded.
Zander et al. [4] used wrapper feature selection method namely sequential forward selection (SFS), which selects features by evaluating the performance (intra-class homogeneity metric) of classifier using datasets characterized by feature subset (started from one feature). Ultimate goal is to select an optimal feature subset for this classifier.
Moore et al. [5] used FCBF feature selection method to filter the redundancy features and evaluated the classification performance (accuracy metric) using Naïve Bayes for searching an optimal number of fea-tures. Dai L. et al. [6] proposed ChiSquared-C4.5 feature selection method for Internet traffic classification. It filters out a feature subset using Chi-squared. And then, it justify whether this feature subset is selected through evaluating classification performance (accuracy metric). These two methods are wrapper feature selection methods.
The previous feature selection methods (especially the wrapper feature selection methods) lead to the multi-class imbalance problem. Because that their performance metrics (accuracy or intra-class homo-geneity) used for classifiers are dependent on the prior distribution. And, the classifiers will be over-whelmed by majority classes.
Recently En-Najjary et al.[7] build logistic regression model for every application class, and select a feature subset for each logistic regression model using parameter estimation. They handle the class imba-lanced problem through transferring the multi-class classification into two-class classification. Our ap-proach is different from them, we handle the multi-class imbalance problem straight.
3.Feature selection frameworks 3.1.Bias Coeficient Definition
Let A={A1,A2 ,Am} as the vector of features to characterize network flows, where m is the number of
features. Also, let C={C1,C2 ,Cq} be the set of traffic classes, where q is the number of classes of
inter-est. Our goal is to select an optimal balanced feature subset from A.
In designing our approach for Internet traffic classification, how to measure the bias degree of one feature in one class is a challenge. It is because that it is hard to define the positive features (bias towards minority classes) and negative features (bias towards majority classes) strictly [8] in multi-class datasets.
To address this challenge, we define bias coefficient to evaluate this bias based on information theory.
In order to realize bias coefficient, we have to discrete numeric features firstly, which can be
imple-mented by the supervised discretize method in WEKA [9]. After discretization, every numeric feature is discretized to few ranges of feature values (one range of feature values is as a feature value in the next paragraph). Definition of bias coefficient is inspired by the relative uncertainty (RU) [10].
We define H(X) as the information entropy of one variable X={x1, x2 , xn}. X may take Nx discrete
values. Suppose we observe X for m times. The RU of one random variable X is defined as:
max 2 ( ) ( ) ( ) ( ) log (min{ X, }) H X H X RU X H X N m (1)
Consider that Cj may have Ncj number of samples and Ai may take NAi number of values. And we
de-fine Njik as the number of samples whose value of Aiequal to the kth value in Aiand belong to Cj. The
conditional RU of Ai given Cj is calculated as:
2 1 2 ( ( / )*log ( ( / ))) ( / ) log (min{ , }) Ai k k Ai N i j i j k i j Cj p A C p A C RU A C N N (2) wherep A( ik/ )Cj Njik/NCj (3) Based on RU takes values [0, 1], the definition of Ais bias coefficient in Cj is:
B A C
( / ) 1
i jRU A C
( / )
i j (4)According to information theory, one variable has smaller value of RU, it is more certainty. If bias
coefficient of Ai is larger, it is more certainty to Cj. That means Ai bias towards Cj in higher degree.
3.2.BFS Method
In this paper, BFS focus on two goals: 1) selecting a feature subset which has balance bias degree to each class so as to alleviate the multi-class imbalance problem, 2) reducing features to improve the classi-fication accuracy like other feature selection methods.
Firstly, we calculate the bias coefficient of each feature in each class (expressed as Barray(Ai/Cj), i =
1 , m, and j = 1 , q) bias coefficient in each class (expressed as BclassArray(Cj)
= {Barray (Ak1/Cj), Barray(Ak2/Cj) , Barray(Akm/Cj)},j=1 ,q ) by descending order. The first one in sorted BclassArray(Cj) bias towards Cj in the highest degree.
On the other hand, we use the symmetric uncertainty (SU) to measure discriminating ability of
fea-tures. A feature has great discriminating ability if it has a high SU. The SU between Ai and C is:
( | ) ( , ) 2[ ] ( ) ( ) i i i IG A C SU A C H A H C (5)
where IG(Ai|C) is the conditional information gain of Aigiven C. H(Ai) and H(C) are the entropy of Ai and
C respectively. We calculate SU between each feature and class, and get array of su, which is expressed
as su(A) = {su(A1,C), su(A2,C) , su(Am, C)}).
Secondly, we select feature for every class. One feature is selected for one class Cj, if it has the
high-est value of SU among these features whose bias coefficient in Cj is during DQG ( =0.6 and ).
All classes feature builds up an optimal feature subset, which has balanced bias coefficient in each class
and great discriminating ability. The object function of selecting a feature for Cj is: ( ) arg max ( | ( / ) }) i j x i j A A FeatureSelection C su A Barray A C (6) 4.Performance metrics
g-mean and Mauc are used as our experimental metrics, since they are independent on prior distribu-tion [11]. In order to illustrate the classificadistribu-tion accuracy improvement by feature selecdistribu-tion methods,
accuracy and recall are also used to measure our classification results.
The calculating method of g-mean [11] is:
1 1 ( q jj)k j j n g mean n 1 q j ij i n n (7)
where njj is the number of samples in Cj and identified to be Cj. njj/n+jmeans the accuracy by class. k is
the number of classes participating in the classification. The smaller of g-mean, the multi-class imbalance
problem is more severity.
Mauc metric is the improvement of AUC (area under the Receiver Operating Characteristic curve),
since AUC could not be used in multi-class datasets. Mauc is as equation (8) [12], where |C| is the number
of classes participating in the classification. And, Si = rk, where rk is the rank of kth sample in Ci in the ranked list. niand njare the number of samples in Ciand Cj respectively.
{ , } && 2 ( , ) | | (| | 1) i j i j c c C i j Mauc AUC c c C C (8)
whereAUC C C( , ) [i j AUC C C( / )i j AUC C C( / )]/ 2j i (9)
where ( / )i j i i( i 1) / 2
i j
S n n AUC C C
n n (10)
Accuracy metric is the fraction of correctly classified flows over all classes. It represents the overall classification accuracy of classifier. Let niias the number of samples classified correctly in Ci, and n as the
total number of samples. Accuracy can be calculated as:
1 q ii i n accuracy n (11)
Recall metric is the fraction of flows of a specific class correctly classified. The recall of Cj is calcu-lated as equation (12), where njjis the number of samples classified correctly in Cj, and njis the number of samples of Cj. jj j n recall n (12)
5.Experiments 4.1.Datasets
In order to verify the effectiveness of our approach, we use ten skewed datasets which were generated for classification by Moore et al. [5]. They were split from the both link directions traces in a full 24 hour, week-day period using heuristic rules. All datasets are characterized by 248 flow features [13]. Table 1 is the classes of interest and the example applications. Table 2 is the content of total traffic flows.
TABLE I. NETWORK TRAFFIC ALLOCATED TO EACH CLASS
No. Classes Example application
1 WWW www
2 MAIL Imap, pop2/3, smtp
3 FTP-CONTROL ftp-control
4 FTP-PASV ftp-pasv
5 ATTACK Internet worm, virus attacks
6 P2P KaZaA, BitTorrent, GnuTella
7 DATABASE Postgres, sqlnet oracle, ingres
8 FTP-DATA ftp-data
9 MULTIMEDIA Windows media player,Real
10 SERVICES X11, dns, ident, Idap, ntp
11 INTERACTIVE ssh, klogin, rlogin, telenet
12 GAMES Half-Life
TABLE II. STATISTICAL INFORMATION OF TEN DATASETS
Total Flows Data Content
377526 328092/28567/3054/2688/1793/2094 /2648/5797/576/2099/110/8
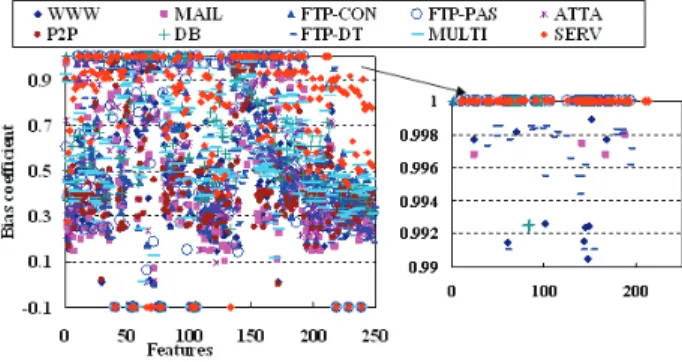
4.2.Bias Coefficient Results
In this section, we focus on illustrating the bias coefficient of every feature in every class. We take
xample. Results are shown in figure1. X-axis is the sequence number of features and y-axis
is the bias coefficient of every feature in every class. Because the samples of INTERACTIVE and
GAMES are less than ten, their results are not listed out. The detail of bias coefficients in the range
be-tween 0.99 and 1 is also given out. bias coefficients of some features equal to -0.1. Because that these
features have missing values, such as truncated_data (client-server/server-client) etc. And, they will be ignored in the process of BFS. This result also indicates that the bias relationship between feature and class is many to many .
Figure 1. Bias coefficients of features
4.3.Feature Selection Results
The number of features chosen for each dataset using BFS and FCBF is demonstrated in table 3.
TABLE III. NUMBER OF FEATURES IN EACH FEATURE SUBSET
Datasets BFS FCBF Dataset BFS FCBF Data01 10 8 Data06 9 6 Data02 10 7 Data07 11 7 Data03 10 5 Data08 11 8 Data04 9 6 Data09 10 6 Data05 9 7 Data10 10 7
The features chosen in more than five datasets using BFS and FCBF are as below. 1) BFS: server port, actual- data-pkts (client-server), min-segm-size (client-server), data-pkts (server-client), pushed-data-pkts (client-server), var-data-ip (server-client), bytes (client-server), initial-window-bytes (server-client). 2) FCBF: server port, missed data (client-server), req-1323-ts (server-client), RTT-full-sz-smpls (client-server) [13]. All of them are related with data size, and no feature is related with time. This indicates that time related features such as duration, are not useful as the above features.
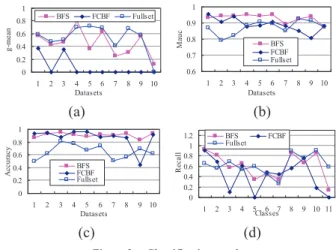
4.4.Classification Results
In order to demonstrate the ability of alleviating multi-class imbalance problem of BFS, we designed experiments to compare BFS with FCBF and Fullset.
In our experiment, FCBF and Naïve Bayes were implemented using WEKA tool [8]. The classifica-tion algorithm was trained by one dataset and tested on the other nine datasets. This process cycle of training with one dataset and testing against the other datasets was repeated once for each dataset. For every training dataset, we ignored the classes, which have less than ten samples. Because that their sam-ples are not enough to represent them.
The classification results of ten datasets are shown in figure 2. X-axis is the sequence number of data-sets and y-axis is the classification results in figure 2 (a), (b) and (c). Learn from figure 2 (a), using FCBF,
Naïve Bayes get zero value of g-mean in most datasets. Because some classes in these datasets have very
few samples and the feature subset of FCBF lacks information to characterize these classes, such as AT-TACK and SERVICES. While, the classification results of Naïve Bayes using BFS are better. There is no
zero value of g-mean and are mostly close to the results of Fullset. It is because that it consider not only
the discriminating ability of features but also the balance of features.
Figure 2 (b) shows that Mauc of BFS are larger than the results of FCBF and Fullset in most datasets.
The classification accuracy is also improved by BFS like FCBF in figure 2 (c). The highly classification accuracy of Naïve Bayes using BFS is achieved by not only improving classification accuracy in majority classes but also maintaining classification accuracy in minority classes. This could be illustrated by the
results of recall metric in detail, which is shown in figure 2 (d). And, x-axis represents the sequence
num-ber of eleven classes (the twelfth class is not shown because it has less than ten samples in all datasets) and y-axis represents the average recall of ten datasets.
Table 4 is the average results of the ten datasets. Average g-mean, Mauc and accuracy of BFS are
higher than the results of FCBF. Relative the results of Fullset, BFS reduce g-mean by 8% - 9%, while
FCBF reduce g-mean by 50% significantly on average.
The classification results demonstrate that BFS can alleviate the multi-class imbalance problem. At the same time, it is also able to improve the classification accuracy like other feature selection methods.
0 0.2 0.4 0.6 0.8 1 1 2 3 4 5 6 7 8 9 10 Datasets g-m ean BFS FCBF Fullset 0.6 0.7 0.8 0.9 1 1 2 3 4 5 6 7 8 9 10 Datasets Ma uc BFS FCBF Fullset (a) (b) 0 0.2 0.4 0.6 0.8 1 1 2 3 4 5 6 7 8 9 10 Datasets A ccu racy BFS FCBF Fullset 0 0.2 0.4 0.6 0.8 1 1.2 1 2 3 4 5Classes6 7 8 9 10 11 R ecal l BFS FCBF Fullset (c) (d)
Figure 2. Classification results
TABLE IV. AVERAGE RESULTS OF TEN DATASETS
Results BFS FCBF Fullset
g-mean 45.30% 7.25% 53.53% Mauc 93.088% 88.93% 87.48% Accuracy 90.92% 86.92% 65.25%
5.Conclusion and future work
In this paper, we proposed a new filter feature selection method called BFS for ML Internet traffic classification. It was devised to alleviate the multi-class imbalance problem, reduce features, and im-prove classification accuracy. BFS selects an optimal feature subset which is balanced and has great
discriminating ability. In order to realize BFS, we proposed bias coefficient to measure the bias degree of
one feature in one class, and used SU to measure the discriminating ability of features. Compared with
FCBF, BFS is advantage to maintain the balance of multi-class classification results. Our experimental
results show that g-mean is not significantly degraded using BFS. Mauc and classification accuracy of
Naïve Bayes using BFS can achieve to 93% and 90% respectively. As a future work, we intend to im-prove our feature selection method on reducing the computation overhead.
Acknowledgment
The authors would like to thank Moore et al. for providing their traffic flow datasets publicly for re-searchers.
References
[1] T.T.Nguyen, G. Armitage. A survey of techniques for internet traffic classification using machine learning . IEEE Communications Surveys and Tutorials, 2008 Vol.10, No.4, pp. 56-76.
[2] L.Yu, H. Liu. Feature selection for high-dimensional data: a fast correlation-based filter solution Conf. Machine Learning (ICML 03), 2003, pp. 856-863.
[3] Nigel Williams, Sebastian Zander, Grenville Armitage. A Preliminary Performance Comparison of Five Machine Learning Algorithms for Practical IP Traffic Flow Classification . ACM SIGCOMM Computer Communication Review, 2006, Vol. 36, No.5, pp. 5-16.
[4] S. Zander, T. Nguyen, G. Armitage. Automated Traffic Classification and Application Identification using Machine Learning . Proc. of the IEEE 30th Conf. on Local Computer Networks (LCN 05), 2005, pp.250-257.
[5] A.W.Moore, D.Zuev. Internet traffic classification using Bayesian analysis techniques . Proc. of the 2005 ACM
SIG-ME on Measurement and Modeling of Computer Systems (SIGMETRICS 05), 2005, pp.
[6] Dai Lei, Yun Xiaochun, Xiao Jun. Optimizing Traffic Classification Using Hybrid Feature Selection . Proc. of the Ninth International Conference on Web-Age Information Management (WAIM 08), 2008, pp. 520-525.
[7] En-Najjary Taoufik, Urvoy-Keller Guillaume, Pietrzyk Marcin, Costeux Jean-Laurent. Application-based feature selec-tion for internet traffic classificaselec-tion . Proc. of 22nd Internaselec-tional Teletraffic Congress (ITC 2010), 2010.
[8] L. Tang, H. Liu. Bias analysis in text classification for highly skewed data . Proc. of the 5th IEEE International Confe-rence on Data Mining (ICDM 05), 2005, pp. 781-784.
[9] I.H. Witten, E. Frank. Data mining: practical machine learning tools and techniques . 2nd ed. [S.. l ]: Elsevier Inc, 2005, pp. 369-423.
[10] K. Xu, Z. L. Zhang, S. Bhattacharyya. Internet traffic behavior profiling for network security monitoring . IEEE/ACM Trans. Networking, 2008, Vol.16, No. 6, pp. 1241-1252.
[11] R. Alejo, J.M. Sotoca, G.A. Casan. An empirical study for the multi-class imbalance problem with neual networks . Lecture Notes in Computer Science, Progress in Pattern Recognition, Image Analysis and Applications, LNCS 5197, 2008, pp. 479-486.
[12] D. J. Hand, R. J.Till. A simple generalization of the area under the ROC curve for multiple class classification prob-lems . Machine Learning, 2001, Vol.45, No.2, pp. 171-186.
[13] A.W. Moore, D. Zuev, M Crogan. "Discriminators for use in flow-based classification . Technical Report RR-05-13, Department of Computer Science, Queen Mary, University of London, 2005, pp. 1-16.