U
NIVERSITY OF
S
URREY
D
OCTORALT
HESISP
LANETARY
R
OBOTIC
V
ISION
P
ROCESSING FOR
T
ERRAIN
A
SSESSMENT
Author:
Conrad Charles Spiteri
Supervisors: Prof. Yang Gao Prof. Sir Martin Sweeting
A thesis submitted in fulfillment of the requirements for the degree of Doctor of Philosophy
from the
University of Surrey
Surrey Space Centre
Faculty of Engineering and Physical Sciences University of Surrey
Guildford, Surrey GU2 7XH, U.K. 2018
Declaration of Authorship
I, Conrad Charles Spiteri, declare that this thesis titled, “Planetary Robotic Vision Pro-cessing for Terrain Assessment” and the work presented in it are my own. I confirm that:
• This work was done wholly or mainly while in candidature for a research degree at this University.
• Where any part of this thesis has previously been submitted for a degree or any other qualification at this University or any other institution, this has been clearly stated.
• Where I have consulted the published work of others, this is always clearly at-tributed.
• Where I have quoted from the work of others, the source is always given. With the exception of such quotations, this thesis is entirely my own work.
• I have acknowledged all main sources of help.
• Where the thesis is based on work done by myself jointly with others, I have made clear exactly what was done by others and what I have contributed myself.
Signed:
Date:
Abstract
Vision based object detection is a key feature within planetary rover navigation which facilitates several functions such as hazard avoidance, localization and path planning. Most of the current research is based on stereoscopic vision or multiple cam-eras strategically placed along the rover chassis that perform one specific function. This works for large rovers with sufficient processing power, however such resources would not be very practical for small or micro-rovers.
This thesis aims to extract terrain surface information from a single camera mounted on a micro-rover such as the Surrey Mobile Autonomy and Robotics Testbed (SMART) based on minimal computational resources. The terrain surface information can pro-vide feature inputs to other on-board navigation functions such as the Planetary Monoc-ular Simultaneous Localisation and Mapping (PM-SLAM) and constellation matching. The detected terrain surface can also be of scientific interest due of the geometrical characteristics produced from this research.
This research aims to improve the processing speed of the Guidance Navigation and Control (GNC) system using low level 2D image processing techniques. The meth-ods employed result in a faster "perception stage" of the GNC with lower processing power requirements, creating structural information, shape descriptors and cognitive segmentation/classification of the rover’s surrounding environment.
Although the initial application of this research is for planetary rovers, the research outcome is envisaged to be relevant, and hence transferable, to other vehicle navigation problems used on land, air or under water.
Acknowledgements
The last several years spent completing my Ph.D have been both challenging and illuminating. The experience has been extremely rewarding, and I’m thankfull to have had the opportunity to expand my analytical and research skills and to grow and learn so much over the course of my studies. While the work presented in this thesis is the product of one person there are numerous people without whom it would never have reached completion. I would like to take the opportunity to extend my sincerest gratitude to a few important people to whom I and this work owe a great deal.
First and foremost I would like to thank my supervisor, Professor Yang Gao, for the opportunity to complete a Ph.D. with the STAR Lab group at the Surrey Space Centre and guidance through the course of my studies. It has been an honour and a pleasure to be able to contribute to the research efforts at such an esteemed centre. Without the experience, insight and knowledge of Professor Gao I would not have been able to complete the work in this thesis. Under her supervision I was constantly challenged to achieve a high standard and given the support to achieve it. Thanks also to my co-supervisor Professor Sir Martin Sweeting for his inspiration and comments.
I would like to thank my wife Simone for all of her love and support. Throughout my academic career she has been an enthusiastic cheerleader offering encouragement, advice, financial support as well as immeasurable patience. Thanks are also due to my daughter Amelia who inspired me to pursue my post-graduate studies.
Finally, I would like to thank my friends and colleagues at the SSC and STAR Lab, including Dr. Said Al-Milli, Dr. Affan Shaukat, Guy Burroughes and Abhinav Bajpai. Our various discussions have always proven to be useful and enjoyable.
I would also like to acknowledge the support of the European Commission for the FASTER Project funded under the European Union’s Seventh Framework Programme for research, technological development and demonstration under grant agreement no 284419. The FASTER Consortium was led by DFKI, and Surrey’s contribution to FASTER was led by Dr. C Saaj.
Contents
Declaration of Authorship iii
Acknowledgements vii 1 Introduction 1 1.1 Background . . . 1 1.2 Motivations . . . 2 1.3 Objectives . . . 4 1.3.1 Towards a Real-time GNC . . . 5
1.3.1.1 Monocular 3D Map Generation . . . 7
1.3.1.2 Image Based Soil Analysis . . . 8
1.3.1.3 Salient Object detection . . . 9
1.4 Novelties and Contributions . . . 11
1.4.1 Evaluation of Monocular DTM reconstruction methods . . . 11
1.4.2 Image Based Soil Analysis . . . 12
1.4.3 Salient Object detection . . . 12
1.4.4 Constraints and assumptions . . . 13
1.5 Structure . . . 14 ix
1.6 Publications . . . 15
2 Literature Review 19 2.1 Terrain Classification and Object Detection . . . 19
2.1.1 Short and medium range . . . 21
2.1.2 Long range . . . 23
2.2 Digital Terrain Model reconstruction . . . 24
2.2.1 Stereopsis . . . 25
2.2.1.1 Fixed Baseline . . . 25
2.2.1.2 Dynamic Baseline . . . 28
2.2.1.3 Correspondence problem . . . 29
2.2.2 Monocular . . . 31
2.2.2.1 Shape from Texture . . . 32
2.2.2.2 Image defocus to obtain shape . . . 32
2.2.2.3 Depth inferred from supervised learning methods . . . 33
2.2.2.4 Shape from Shading . . . 33
2.2.2.5 Photometric stereo . . . 35
2.3 Image Based Soil Analysis . . . 36
2.3.1 Real-time visual sinkage detection . . . 38
2.3.2 Retrospective soil stiffness analysis . . . 39
2.4 Salient Object detection . . . 41
2.5 Conclusion and Future Work . . . 43 x
3 Digital Terrain Model Reconstruction 45
3.1 Introduction . . . 45
3.2 Theoretical evaluation . . . 46
3.2.1 Minimization Methods . . . 47
3.2.1.1 The Brightness constraint . . . 47
3.2.1.2 The Smoothness constraint . . . 48
3.2.1.3 The Integrability constraint . . . 48
3.2.1.4 The Intensity Gradient constraint . . . 48
3.2.1.5 The Unit Normal constraint . . . 49
3.2.2 Propagation . . . 49
3.2.3 Local . . . 49
3.2.4 Linear . . . 50
3.2.5 Specular Surfaces . . . 51
3.2.6 Vignetting Correction . . . 52
3.2.7 Assumptions within SfS Algorithms . . . 53
3.3 Depth Perception . . . 53
3.4 Datasets and Platforms . . . 56
3.4.1 Lab acquired images . . . 56
3.5 Experimental Evaluation of Theoretical Models . . . 58
3.5.1 Computational Performance . . . 61
3.6 Conclusion and future work . . . 63
4 Image Based Soil Analysis 65
4.1 Introduction . . . 65
4.2 Real-time visual sinkage detection . . . 66
4.2.1 Theoretical Design . . . 66
4.2.2 Datasets and Platforms . . . 73
4.2.3 Experimental Evaluation of Theoretical Model . . . 76
4.2.3.1 In-Lab Experiments . . . 76
4.2.3.2 Field Trial Testing . . . 80
4.2.3.3 Computational Performance . . . 88
4.3 Retrospective soil stiffness analysis . . . 89
4.3.1 Theoretical Design . . . 89
4.3.2 Datasets and Platforms . . . 91
4.3.3 Experimental Evaluation of Theoretical Models . . . 92
4.4 Conclusion and future work . . . 98
5 Salient Object Detection 101 5.1 Introduction . . . 101
5.2 Theoretical Design . . . 102
5.3 Datasets . . . 106
5.3.1 Ground-Truth Annotation of Image Data . . . 106
5.3.2 SSC Lab-based Test-bed . . . 106
5.3.3 RAL Space SEEKER Dataset . . . 107 xii
5.3.4 PANGU Dataset . . . 108
5.4 Experimental Evaluation of Theoretical Models . . . 108
5.4.1 Evaluation of Saliency Algorithm . . . 108
5.4.2 The SAMS Algorithm . . . 111
5.4.2.1 Computation of shape feature map . . . 111
5.4.2.2 Computation of feature maps . . . 112
5.4.2.3 Combining the feature maps . . . 114
5.4.3 Computation time . . . 119
5.5 Conclusion and future work . . . 121
6 Conclusion and Future Work 123 6.1 Towards a Real-time GNC . . . 123
6.1.1 Discussion and Analysis . . . 124
6.1.2 Conclusion . . . 128 6.2 Thesis Summary . . . 129 6.3 Future work . . . 130 Appendices 131 Bibliography 139 xiii
List of Figures
1.1 Functional configuration of a planetary robot autonomous operation. . . 3
1.2 Suggested changes to obtain real-time terrain assessment. . . 6
2.1 Visual processing for terrain modeling methods. . . 25
2.2 Calculating distance of a pixel from the camera using binocular method. 26 2.3 3-D visualization of extrinsic parameters showing the calibration pat-terns with respect to a PointGrey Bumblebee BEX2camera. (Calibration parameters are illustrated in Appendix A Figure 3) . . . 27
2.4 Calculating distance of a pixel from a moving camera using multi-view geometry (SfM) . . . 28
2.5 Lambertian reflectance model . . . 34
2.6 FASTERScout rover byDFKI[1] . . . 36
3.1 Map of tested SfS algorithms. . . 46
3.2 Side view of a rover detailing image parameters employed in Direct Depth calculation of point(x, y). . . 54
3.3 Lab images from the selected dataset. Left (a), Right (b), and resulting disparity map from stereo images (c). . . 57
3.4 Experimental rig used to collect the dataset detailing the measurements taken. . . 58
3.5 Comparison of DTMs. Left column; section of original image, Center column; Point Could generated from SfS, Right column Point Could
gen-erated from Stereo images. . . 59
3.6 SfS algorithm processing frame rate for various CPU speeds . . . 62
4.1 Model of Legged Wheel sinking into deformable terrain. [2] . . . 67
4.2 Dynamic mask components. [2] . . . 68
4.3 Binary image after segmentation and morphology. [2] . . . 70
4.4 Model of Legged Wheel sinking into deformable terrain. [2] . . . 72
4.5 Interface (green), Template (red) and Sinkage (blue). [2] . . . 72
4.6 Single Wheel-Leg Test Bed setup: (a) regolith filled rig, (b) moving car-riage, (c) translation linear bearings, (d) motor and timing belt. [3] . . . . 73
4.7 Wheel-leg support structure: (a) sinkage linear bearings, (b) linear trans-ducer, (c) counterbalance normal loads, (d) motor output shaft absolute encoder, (e) USB camera. [3] . . . 74
4.8 Asguard Wheel-Leg from DFKI [3] with blue legs and feet. . . 75
4.9 Processed images from the proposed algorithm for (a) Normal illumi-nation conditions (300-400 Lux), (b) Poor illumiillumi-nation conditions (10-15 Lux), (c) Poor lighting conditions and blurring (10-15 Lux). . . 77
4.10 Measured and Detected leg sinkage for (a) Load 3.5kg and illumination 300-400 Lux, (b) Load 3.5kg and illumination 10-15 Lux, (c) Load 1.0kg and illumination 300-400 Lux, (d) Load 1.0kg and illumination 10-15 Lux. 79 4.11 Chosen location atWest Wittering beach in the south-west of England. (a) overview of location during an experiment, (b) The rover and test rig assembly. . . 81
4.12 Error in annotation data. . . 84 4.13 Mismatch between the wheel encoder angular data and actual angular
position of the wheel’s leg (Red line is reported angular position by the encoder, Green line is the detected tip of the leg. . . 85 4.14 Sun glare distorting image color. . . 86 4.15 Algorithm frame rate for various CPU speeds . . . 88 4.16 Rover wheel sinkage extraction: (a) originalYutu PanCamimage; (b)
im-age section containing rover track marks in 2-dimensional pixel scale, corresponding to the red box region in (a); (c) DTM of the image sec-tion in 3-dimensional pixel scale where the z-axis values are illustrated in color codes; (d) dynamic sinkage profiles extracted from the image section for the middle and right track marks. . . 95 4.17 Thep-zmodel plots based on traditional method and modern method
for Luna 17, Apollo 15 and CE-3, illustrating final numerical results in Tables 4.4 & 4.5. #1 refers to the traditional method (4.3) #2 refers to the modern method (4.3.3). . . 97
5.1 Conspicuity maps for a sample image showing colour (a), intensity (b) and orientation (c) maps which are then combined into the actual saliency map (d) . . . 103 5.2 Example image from Lab-based dataset (a), saliency heat map overlayed
on original image (b), binary map generated by Otsu’s method (c) . . . . 104 5.3 Example image from the Lab dataset. . . 107 5.4 Example image from the SEEKER dataset [4]. . . 107 5.5 Example image from the PANGU [5] simulated dataset. . . 108
5.6 (a) Depth saliency model as proposed by Wang et al [6].(b) Proposed
Shape Augmented Monocular Saliency model. . . 113
5.7 (a) = Original image. Itti algorithm feature maps (b) = Intensity, (c) = Orientation and (d) = Final output. . . 116
5.8 Feature maps for SAMS algorithm where (a) = Intensity, (b) = Orienta-tion, (c) = Structure and (d) = Final output. . . 117
5.9 Result of thresholding the final feature maps for both algorithms. Blue boxes belong to the Itti algorithm while Red boxes belong to the SAMS algorithm. . . 117
5.10 Salient object detection on MER images using the SAMS (Red bounding boxes) and Itti (Blue bounding boxes) algorithms. Original image names within JPL’s PDS image repository are: (a) = 1n436950889fflc9h1p0723r0m1.img, (b) = 1n463314413fflchj3p1966l0m1.img, (c) = 1n468107164fflcibnp1825r0m1.img, (d) = 1n467395302dnlch0uf0006l0m1.img, (d) = 1n466780272dnlchzof0006l0m1.img118 5.11 Computation time of the various algorithms for each dataset. . . 120
5.12 SAMS algorithm frame rate for various CPU speeds. . . 121
6.1 Suggested changes to obtain real-time terrain assessment. . . 125
6.2 DTMs generated from SfS and their corresponding image. . . 127
3 PointGrey Bumblebee BEX2 stereo camera calibration parameters . . . . 133
List of Tables
2.1 Most frequently used cost functions in order of most commonly used . . 31
3.1 Most popular SfS algorithms categorised by technique. The number in parentheses indicates the year of publication. [7] . . . 47 3.2 Size of rocks when measured directly, derived from SfS algorithm and
derived from Stereo algorithm. All values inmm. . . 60 3.3 Deviation error for each of the derived parameters as a percentage of the
Ground Truth. . . 61
4.1 Vision based detection error as a percentage of ground truth. . . 80 4.2 Datasets characteristics and terrain type. . . 82 4.3 Average and maximum error for all images aggregated by datasets. . . . 84 4.4 Traditional soil stiffness analysis based on penetrometer data and BG
model . . . 90 4.5 Traditional soil stiffness analysis based on penetrometer data and BG
model . . . 96
5.1 Normalized performance results for various saliency algorithms on cho-sen datasets. Bold numbers are highest N-MODA values within each dataset. . . 110
5.2 Feature map weights and their results in %. Bold numbers indicate best results. . . 115 5.3 Performance evaluation between the Itti and the SAMS algorithms
ex-pressed as %. . . 115
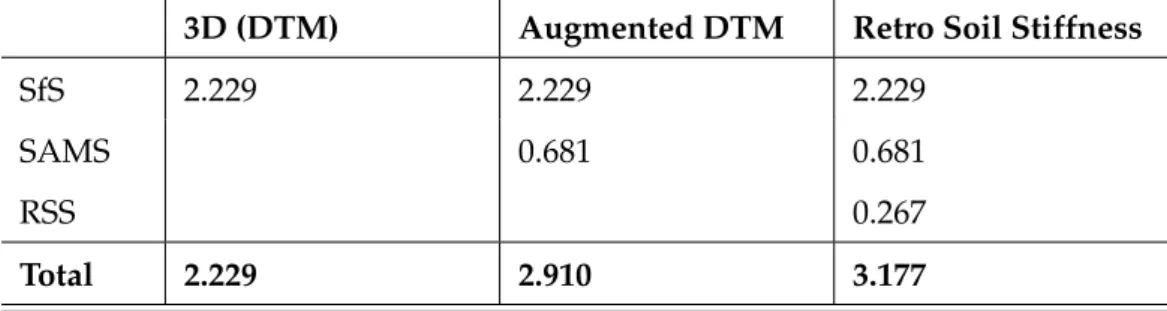
6.1 Execution time (in seconds) for each algorithm and combined timing. (SfS = Shape from Shading, SAMS = Structure Augmented Monocular Saliency, RSS = Retrospective Soil Stiffness analysis). . . 126 2 Size of rocks when measured directly, derived from SfS algorithm and
derived from Stereo algorithm. All values inmm. . . 140 3 Deviation error for each of the derived parameters as a percentage of the
Ground Truth. . . 141
List of Abbreviations
2D 2(two)Dimentional3D 3(three)Dimentional
ANN ArtificialNeuralNetworks
BG Bernstein-Goriatchkin model
CPU CentralProcessingUnit
CNSA ChinaNationalSpaceAdministration
DTM DigitalTerrainModel
DFKI DeutscheForschungszentrum fürKünstlicheIntelligenz GmbH
Dsp Disparity
Eng Energy function
FASTER ForwardAcquisition ofSoil andTerrain data forExplorationRover
FL FuzzyLogic
FOV FieldOfView
FPGA FieldProgrammableGateArray
GBVS GraphBasedVisualSaliency
GNC Guidance,Navigation andControl
GPU GraphicsProcessingUnit
HiRISE HighResolutionImagingScienceExperiment
HFOV HorizontalFieldOfView
IMU InertialMeasurementUnit
LIDAR LIghtDetectionAndRanging
LRV LunarRovingVehicle
MER MarsExplorationRover
MODA MultidimensionalOverlappingDeprivationAnalysis
MSL MarsScienceLaboratory xxi
NCC NormalizedCross-Correlation
OBC OnBoardComputer
PANGU Planetary andAsteroidNatural sceneGenerationUtility
PDS PlanetaryDataSystem
PMSLAM PlanetaryMonocularSimultaneousLocalisationAndMapping
PQFT Phase spectrum ofQuaternionFourierTransform
RAM RandomAccessMemory
ROI RegionofInterest
ROS RobotOperatingSystem
RBTC Rule-BasedTerrainClassifier
SAD Sum ofAbsoluteDifferences
SAMS StructureAugmentedMonocularSaliency
SDSR SaliencyDetection bySelf-Resemblance
SfM StructurefromMotion
SfS ShapefromShading
SIFT ScaleInvariantFeatureTransform
SLAM SimultaneousLocalisationAndMapping
SMART SurreyMobileAutonomy andRoboticsTestbed
SMP SurreyMobilityPlatform
SMPA SenseModelPlanAct
SSC SurreySpaceCentre
SSD Sum ofSquaredDifferences
SRA SpectralResidualAnalysis
STAR Lab SurreyTechnology forAutonomy andRoboticsLab STB SaliencyToolbox
SURF SpeededUpRobustFeatures
SWLTB SingleWheel-LegTestBed
USB UniversalSerialBus
VFOV VerticalFieldOfView
List of Symbols
Symbol Name
A Light source or Area
b Baseline
B Strength of specular reflection
c column
C Number of columns
d Disparity[d 0]T or Distance
dl,dr Distances from a point
dx,dy Delta(δ)
D Diameter or Detected object
Dm Diameter exponent e Epipole E Energy f Focal length g Gravity G Ground truth h Height
i Intensity or Iteration number
I Image
k Stiffness modulus
Lux Système international (SI) derived unit of illuminance
M Mass or Low order moments
n Unit normal
N Newtons or Number
~
N Surface normal vector
OR Spatial overlap
plz Total pixel length
P 3D point
r row
R Reflectance, Radius or Number of rows
~
S Light source vector
SM Sum of maps
t frame
T Translational velocity
V Relative motion
W Neighborhood of pixels or Width
x,u,p,X Coordinate
y,v,q,Y Coordinate
z,Z Coordinate or sinkage
zn Sinkage exponent
alpha Angle of camera (world coordinates)
β Angle from center of camera along y axis (camera coordinates)
γ Angle from center of camera along x axis (camera coordinates)
Energy function θ Angle ρ Albedo or pressure σ Slant τ Tilt ωx Weighting function
ω Angular velocity unit vector(ω1, ω2, ω3)
ωx(T) Weighted probability of class
Dedicated to my wife Simone and my daughter Amelia Mae who
have been my infinite source of inspiration.
Thank you
.
Chapter 1
Introduction
1.1
Background
Throughout history, mankind has always had an urge for exploration. While observa-tion of objects in space pre-dates reliable recorded history, it was the development of large rockets during the late 1950s that allowed physical space exploration to become a reality, giving rise to the opportunity for closer exploration of bodies within our so-lar system. From Earth orbiters such as theSputnik 1 to manned Lunar landings of the Apollomissions and the Voyager I &II probes, all the way to the latest rovers to wander on Mars, the past 50 years have seen a huge leap in space exploration and its technological progression.
Recent rover missions to Mars have returned a plethora of information about the geology and evolution of the planet. The rovers are capable of exploring various sites with diverse geological characteristics however they have a number of limitations which tend to reduce the scientific return of the mission. Planetary rovers operating on Mars suffer from intermittent communications, transmission latency, bandwidth constraints, and limited hardware resources. An elementary component in the suc-cess story behind such missions is the ever increasing level of autonomy built into
2 Chapter 1. Introduction these rovers. Without the rover being able to perform certain tasks, devoid of hu-man intervention, it would not be viable for the rover to cover the required distances. Future Martian surface exploration missions will demand an even higher scientific re-turn. Therefore future planetary rovers will require superior levels of autonomy [8] that would enable them to achieve the mission objectives with little intervention from ground control. Such levels of autonomy would necessitate efficient algorithms capa-ble of sensing and reacting to the rover’s environment in a timely manner.
1.2
Motivations
Sensing and detecting objects in a natural scene is an intricate challenge for mobile robots which involves a complex combination of vision processing and domain knowl-edge of the scene. The latter is even trickier for planetary rovers that are traversing unfamiliar terrain which increases the demand for more accurate and faster vision al-gorithms.
Knowledge of nearby rocks and impassable obstacles allows a planetary rover to adapt its control and plan traversal strategies to avoid collisions and other hazards, thus improving the mission’s scientific return [2]. Near-term scientific goals for Mars surface exploration are expected to focus on understanding the planet’s climate history, surface geology, and potential for past or present life. To accomplish these goals, plan-etary rovers will be required to safely access rough terrain with a significant degree of autonomy. On-board image understanding allows rovers to acquire and understand scene images autonomously when human guidance is unavailable. The comprehen-sion of images also allows planetary rovers to make the most of each command cycle by performing autonomous site characterization and prioritization of the most impor-tant data for downlink.
Most of the time, the problem of understanding a rover’s environment is addressed using multiple view geometry by acquiring scene images from different points of view, being through stereoscopic analysis, Structure from Motion (SfM) or by other means.
Chapter 1. Introduction 3 Such methods are typically associated with high computational costs and have limited range [9]. Whilst in terrestrial robots the processing costs are trivial, as processors and memory are getting faster and cheaper, the processing power available on planetary rovers has been slow to catch up due to various technical challenges [10] and hence, such algorithms are unable to operate at optimal speeds. Therefore due to lack of pro-cessing power and a limited range, planetary rovers travel at slow speeds and make frequent stops to analyse the terrain in its path [11]. Typically, this is an inherited char-acteristic of the rover’s Guidance, Navigation and Control (GNC) system.
The GNC system forms a crucial part of a planetary rover, allowing it to negotiate a path through challenging unstructured terrain. GNC architectures used in current missions restrain the traverse speed of existing rovers, especially when the driving mode is required to be fully autonomous [11].
Sensing Geometric Analysis Appearance Analysis Online Soil Analysis Scientific Interest Analysis Self-supervised Learning Terrain Classification Traversability Analysis Re-planning Request / Scientific Labelled Data Transmission
Way Point Path Planning Local Obstacle Avoidance Control Kinematic & Dynamic Model Localisation Off-line Semantic Mapping
Autonomous Terrain Assessment
Autonomous Data Selection
Terrain Map Slope, Roughness, Obstacles
Texture, Colour Statistics Slippage / Sinkage Map: Local Geometry / Terrain 3D Points 2D Image Various Images (2D, 3D)
FIGURE1.1: Functional configuration of a planetary robot autonomous operation.
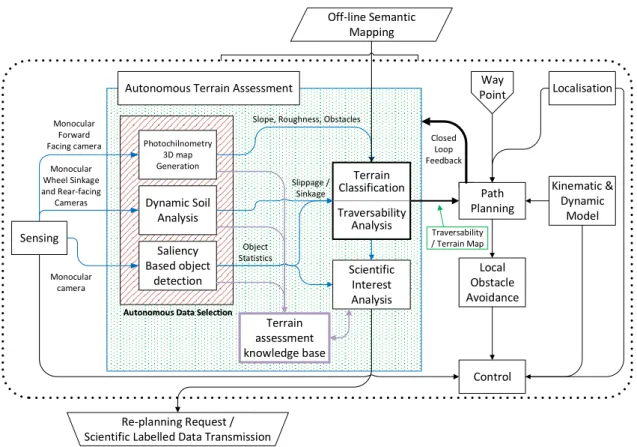
Figure 1.1 depicts a typical functional configuration of a planetary robot autonomous operation [12] where the “Autonomous Terrain Assessment” block (green dotted box)
4 Chapter 1. Introduction highlights the generation of a terrain and traversability map based on various sensor inputs. Such methods are typically unable to operate in Real-Time on a planetary rover due to the complexity of the vision algorithms in the “Autonomous Data Selection block (red pattered box). Enabling a rover to comprehend its environment quicker and hence allow a faster traverse rate, would increase the scientific value of a mission and enhance the potential success of the mission [13].
1.3
Objectives
Terrain assessment from monocular images for autonomous navigation of planetary rovers is a relatively new and challenging research area, not only because of the hard-ware limitations, but also because the rocks, obstacles and highly deformable terrain exhibit diverse morphologies and have no uniform properties to distinguish them from background soil.
The objective of this research is to propose novel alterations to existing Guidance Navigation and Control (GNC) architectures that will abate some of the current lim-itations, with the potential for application to future planetary exploration missions. Specifically this research aims to improve the processing speed of the Sense-Model-Plan-Act (SMPA) model by employing algorithms that require lower computational costs enabling the SMPA model to operate in as close to real time as possible given the system constraints.
In more detail, this PhD aims to supply terrain/traversability maps and a set of robust feature vectors of objects in the vicinity of a planetary rover, to other on-board GNC systems, consuming the smallest amount of resources possible and most impor-tantly, within a shorter time frame than existing state-of-the-art. The challenge is to ex-tract rock/hazard/terrain related information and generate traversability and terrain maps from monocular cameras using low-level 2D image interpretation methods.
The process involves a) validating a monocular based Digital Terrain Model (DTM) generation method that consumes less computing resources or generates the model
Chapter 1. Introduction 5 within a considerable shorter time-frame, b) extracting the soil properties from single monocular images in a continuous manner and c) identify objects of interest or poten-tial hazards using a low computational cost methods. The output from these methods are subsequently employed for use in hazard avoidance, navigation and localization. Furthermore detection of hazardous situations such as large obstacles and very lose de-formable terrain in the immediate vicinity of the rover can be reported directly to the reactive system of a rover, which is essential for safe traversal of unknown planetary terrains at elevated speeds.
However, the improvement of the actual GNC and its performance is outside the scope of this work. This thesis is concerned with presenting a GNC system with faster and more comprehensive information in an effort for the GNC system to perform faster operations. In effect, this work focuses on transforming data from the sensors into meaningful information that the GNC can process through the "Autonomous Data Se-lection block" in a more timely manner employing the theoretical and novel concepts proposed in this thesis.
1.3.1 Towards a Real-time GNC
Future planetary exploration missions will seek to expand upon the quantity, depth and diversity of scientific return compared to current missions. Some of the potential scenarios may include sample-return missions, geographical and geological surveys of larger areas and more precise localisation of specified objects of interest. Such com-plex mission scenarios introduce very challenging problems for the rover’s Guidance, Navigation and Control (GNC) system. Significantly reduced traverse times and an increased level of autonomy compared to the current state-of-the-art in rover GNC sys-tems, are key requirements in allowing planetary rovers to reach targets more quickly and more precisely [14].
The autonomous driving mode in current GNC architectures follow a SMPA paradigm requiring the rover to halt periodically, substantially reducing traverse speeds [11]. The Mars Science Laboratory(MSL) currently achieves a speed of 0.56 cm/s in autonomous
6 Chapter 1. Introduction SMPA-based drive mode. The SMPA traverse speed limitations are mainly due to the limited processing power available on-board the rover [15].
Sensing Photochilnometry 3D map Generation Dynamic Soil Analysis Saliency Based object detection Re-planning Request / Scientific Labelled Data Transmission
Way Point Path Planning Local Obstacle Avoidance Control Kinematic & Dynamic Model Localisation Off-line Semantic Mapping
Autonomous Terrain Assessment
Traversability / Terrain Map Slope, Roughness, Obstacles
Object Statistics Slippage / Sinkage Monocular Forward Facing camera Monocular Wheel Sinkage and Rear-facing Cameras
Autonomous Data Selection
Scientific Interest Analysis Terrain Classification Traversability Analysis Terrain assessment knowledge base Monocular camera Closed Loop Feedback
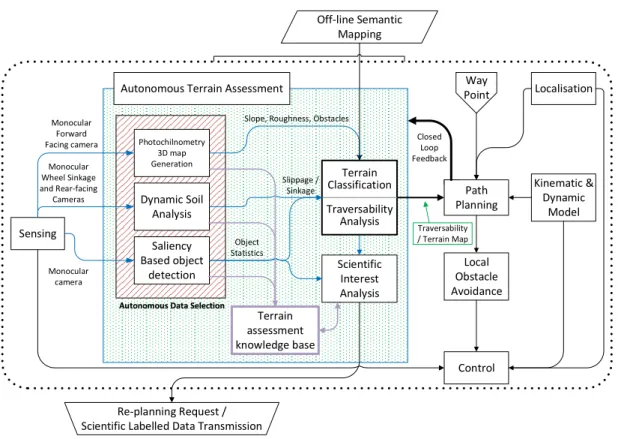
FIGURE1.2: Suggested changes to obtain real-time terrain assessment.
Figure 1.2 highlights the suggested changes to the "Autonomous Data Selection" block (red pattered box) in contrast to the method depicted in Figure 1.1, to obtain faster and more efficient terrain assessment. A ‘Terrain assessment knowledge base’ block has also been added to the figure (purple box and lines). It is envisaged that this block would contain historic terrain information which the system can refer to in order to improve the output of the presented algorithms. A closed loop feedback mecha-nism has also been added to the model. These additions are however not discussed or researched further and have been inserted to complete the model.
Several improvements to the GNC architecture have been proposed in literature [11] and although these improvements have proven to augment the accuracy and speed of the rover, their practical use, within planetary applications, is constrained by the lack of computational resources [16]. The pragmatic outcome is a trade-off between
Chapter 1. Introduction 7 the accuracy and speed which needs to be governed by the application and mission objectives [17].
The suggested "Autonomous Data Selection" block comprises of the following:
1.3.1.1 Monocular 3D Map Generation
One of the areas in the computer vision discipline that is gaining interest is Photo-clinometry, which coupled with other visual strategies such as cognitive segmentation and classification methods, has proven to be very effective within the mammal domain. Photoclinometry is an effectual means of recovering the three dimensional shape of an object or scene from a monocular image [18]. Photoclinometry or shape from shading (SfS) techniques have been exploited by planetary scientists for more than 50 years [19]. The manner in which light reflects off an object’s surface, and the shadows that are cast by the object provide an effective cue to determine the shape of objects. The resultant output being either the relative distance from camera to surface points, or the relative surface height above thex−y plane. Both these methods can be transformed into a digital terrain model. Furthermore SfS can be used to detect objects at a much further distance than stereo vision processing [9]. Being able to identify long-range obstacles and other terrain parameters is a relatively new area of research, whose results will be of clear relevance for planetary exploration.
As detailed in Chapter 3, SfS will generate a topographic model or Digital Terrain Model (DTM) of the area around the rover depending on the cameras’ point of view, using a single monocular image. The DTM can then be utilised to highlight the rough-ness, slope and most importantly any potential obstacles that may be hazardous to the rover if it were to attempt traversing that terrain. In addition, the DTM is utilised as the bases of one of the novel Image Based Soil Analysis algorithms, as detailed in Chap-ter 4 and the novel Structure Augmented Monocular Saliency algorithm as detailed in Chapter 5.
8 Chapter 1. Introduction
1.3.1.2 Image Based Soil Analysis
Planetary rovers are also likely to encounter challenging deformable terrain that affects their mobility. The deformable terrain may also become a hazard in which the rover can get entrenched, known as "embedding events". A typical example isMER-Arover, Spirit, which experienced multiple embedding events until finally on May 1, 2009 it became permanently immobilized and all attempted maneuvers to free the rover for the following eight months failed [20].
Highly deformable terrain also causes traction loss and wheel slip, where the rover would operate in a less efficient manner than originally anticipated. This results in slower traversal of the terrain and higher consumption of power resources [21].
Wheel sinkage assessment helps the rover characterize the regolith being traversed, allowing it to make judgements on whether the rover can get entrenched in the soil and make assumptions of the terrain it is about to negotiate. The sinkage of a wheel or leg can be accurately determined through vision based techniques [21, 22], however, most algorithms are inept at operating in real-time due to limited processing power available on planetary rovers [10, 15]. In such cases the rover needs to either halt in order to acquire and process an image, or only acquire sinkage readings periodically at the highest possible frequency, which is usually a considerable number of seconds apart. The stop and calculate scenario (part of the SMPA mode) would increase the traverse time of the rover and would not be practical when frequent measurements are required. In the periodic scenario there is a risk that the rover would already be in a hazardous position by the time the sinkage is calculated since the rover has moved to a new location making the calculation archaic.
As detailed in Chapter 4, a vision based algorithm that can assess the sinkage of a wheel for planetary rovers is believed to be the ideal means to make assumptions on the soil it is about to traverse. Two methods have been proposed where the first requires a specific hardware design while the second can be applied to current rover designs with retrospect analysis of the terrain just traversed by the rover. Both methods employ low level 2D image analysis using minimal computational resources [3].
Chapter 1. Introduction 9
1.3.1.3 Salient Object detection
Over the past few decades extra-terrestrial planetary rovers have evolved into highly complex intelligent systems utilising a variety of on-board sensors. In particular, ma-chine vision has played an important role in increasing rover autonomy. Visual feature detection remains a key research topic, especially for rover localisation, pose estimation and navigation. Moreover identification of landmarks such as, rocks in terms of point-based features (Scale-Invariant Feature Transform (SIFT), SURF and corner-point-based) us-ing supervised classification techniques are computationally intensive, and prone to failures due to the homogeneous surfaces texture of Mars and other such regolith cov-ered celestial bodies.Furthermore, image databases for training purposes (from previ-ous missions) are limited, and may over fit models to very specific terrain patterns that are not generic. Thus, it is important for landmarks, such as rocks, to be detected using methods that are generic, unsupervised, and do not rely on visual descriptors that are computationally intensive.
The use of stereopsis (or stereo vision) has been the most widely used solution for terrain mapping on Mars. However there will be a greater requirement for identifica-tion of terrain features, such as rocks, slopes and other related hazards as landmarks for future extra-terrestrial missions. Where stereo vision and active Light Detection And Ranging (LiDAR) based solutions do exist in terrestrial rovers for such applica-tions [24–26], they might prove to be computationally intensive or power intensive for planetary rovers. Alternatively, the use of monocular vision-based techniques may well be a more optimal solution in terms of hardware, software and resource consump-tion. There is an increasing understanding that monocular vision-based object detec-tion methods offer great potential for the identificadetec-tion of landmarks on planetary sur-faces. Most popular methods include; shape analysis and detection, edge-detection operators, interest-point detectors, and Haar-like features [9]. However, these features may exhibit suboptimal performance if training data is not sufficiently large.
Furthermore, monocular vision-based techniques can be used to detect objects at a much further distance than stereo vision processing [9]. For more than a decade,
10 Chapter 1. Introduction there has been an effort to develop machine vision paradigms that can extract regions of interest (ROI) in terms of their global and local conspicuity characteristics, known as visual saliency models [27]. At the time of writing, only one such method, i.e., Itti et al. [28], has been used for the detection of planetary rocks [29] within the context of planetary rovers. However, a more in depth investigation is required into such models, in order to identify the most feasible stimuli for such planetary mission applications.
As detailed in Chapter 5, an object detection technique dubbedStructure Augmented Monocular Saliency(SAMS) is proposed. The algorithm is able to reliably detect objects (e.g., ‘rocks’) from a single planetary 2D image. The proposed solution is based on existing state-of-the-art saliency algorithms and augmented using the DTM of a scene acquired using the photoclinomentry method described in Chapter 3. The SAMS tech-nique seeks to abate some algorithmic limitations of existing methods without a-priori model training requirements, lower computational complexity and greater robustness towards applications over long-distance planetary terrains.
Chapter 1. Introduction 11
1.4
Novelties and Contributions
The synergy of the above mentioned techniques will help to increase the execution speed of the ’Perception Stage’ within a GNC architechture. This should yield lower computational complexity, greater robustness and an inclination towards operating in real-time.
The contributions of this thesis in the area of computer vision for planetary explo-ration are summarised as follows:
1.4.1 Evaluation of Monocular DTM reconstruction methods
The photoclinometry module within the Autonomous Data Selection block is a DTM generation method that has been adapted for use on planetary terrain environments from a rover world frame. Although Shape-from-Shading is a well studied method for terrestrial applications and planetary images from satellites, to date there has been no direct research evaluating and investigating the photoclinometry methods from a planetary rovers’ perspective. This research aims to identify the most applicable state of the art algorithms for use within a planetary rover.
The theory behind various algorithms is evaluated together with the challenges of SfS algorithms from a planetary rover point of view. Furthermore, a number of datasets are used for the experimental evaluation of theoretical models in terms of accuracy and error when compared to DTMs generated from stereo vision methods and a ground truth. The objective is to validate a method, in both theory and practice, that creates a rough DTM using photoclinometry that is able to recreate the scene with the least possible computational resource use and to a limited degree of accuracy.
A geometric method for calculating the depth of an object of interest within the scene is also compared to stereo methods for accuracy. An analysis has been performed to determine the limitations of using this method in localisation applications.
12 Chapter 1. Introduction
1.4.2 Image Based Soil Analysis
Identifying wheel sinkage for planetary exploration rovers can give a critical insight about the terrain traversability and in particular the characteristics of deformable soils that the rover travels on. The Image Based Soil Analysis module within the GNC is able to detect the stiffness of the soil and its deformability using one or both the proposed novel theoretical techniques.
The first proposed method requires a camera mounted just below the wheel’s cen-ter of rotation looking at the wheel/sand incen-terface. The algorithm is dependent on correctly segmenting the contour of the wheel from the background and from the de-formable terrain.
The second proposed method can be adopted by most rovers that incorporate a rear facing camera looking at the tracks left in the rover’s wake. The retrospective wheel sinkage data can be adapted to model the stiffness of regolith for scientific purposes, attempt to predict the immediate stiffness and traversability of the soil in front of the rover and allow the rover to adjust it’s driving stratagy to adapt to the predicted re-golith type [30].
These methods allow the rover to potentially anticipate non-geometric hazards while the rover is in motion, aiding the GNC to operate more efficiently. Furthermore, a number of datasets are used for the experimental evaluation of theoretical models in terms of accuracy and error when compared to a ground truth.
1.4.3 Salient Object detection
Specific surface characteristics of objects on planetary surfaces may provide sufficient information for it to be distinguished in the visual scene. Salient object detection meth-ods provide a much swifter extraction of objects that may be of interest or of a haz-ardous nature.
Chapter 1. Introduction 13 is evaluated. Furthermore, a number of datasets are used for the experimental evalua-tion of theoretical models and corroborated to improve detecevalua-tion and execuevalua-tion alacrity when compared to the state-of-the-art saliency algorithms. The theoretical work pre-sented in this thesis discusses how such a method would augment the accuracy and efficacy of a saliency algorithm. This is then supported by lab experiments and tested on planetary images.
The synergy of these techniques will allow the GNC system to operate more efficiently, yielding lower computational complexity in an inclination towards operating in real-time.
1.4.4 Constraints and assumptions
Most of the research on SfS use synthetic images or images of objects with confined constraints such as homogeneous or known albedo, structured lighting or even images of specific singular objects. This is mainly due to the challenges that natural environ-ments present. The application of SfS within natural environenviron-ments becomes a difficult problem to solve and may require excessive computational power that surpasses the requirements of processing stereo images [21].
In a study about the composition of natural scenes [31] from a spectral perspective, Ruderman argues that albedo and various other object reflectance properties are non-linear and are conditioned by atmospheric conditions such as moisture and pressure, and the reflectance of various spectra from other objects. As the variation of these con-ditions on Mars and the Moon are negligible to non-existent, with objects having very distinct albedos [32–34], computing the DTM of a natural scene in such environments is much less challenging.
This research also focuses on possible applications within existing planetary rovers or with the possibility of minor modifications. Therefore and new or emerging tech-nologies which are not likely to fly to other celestial bodies within the immediate future are not considered.
14 Chapter 1. Introduction
1.5
Structure
The thesis is structured as follows:
• Literature review: Chapter 2 introduces a number of key concepts pertaining to components within the Autonomous Data Selection block of a typical GNC architecture state of the art with reference to planetary rovers (See figure 1.1). Furthermore the limitations of the components within this block are discussed to-gether with the state of the art relating to the suggested components or modules, namely; the digital terrain model reconstruction, the image based soil analysis and the salient object detection modules.
• Evaluation of Monocular DTM reconstruction methods: Chapter 3 illustrates the concepts behind the DTM reconstruction method. Experiments and analy-sis of the results based on the method of choice are presented and compared to current methods used.
• Image Based Soil Analysis: Chapter 4 presents two novel methods to charac-terise the soil that a rover is traversing. Both methods can gauge the stiffness of the soil and the amount of wheel sinkage that the rover might be or has ex-perienced. Several experiments and analysis of their results are presented and discussed.
• Salient Object Detection: Chapter 5 presents a novel Saliency based algorithm for object detection in a planetary environment such as Mars. The theoretical design of the algorithm and analysis of the experiments are presented and com-pared to state of the art saliency methods using typical datasets.
• Conclusion and Future work: In conclusion, Chapter 6 briefly describes how the computationally efficient algorithms presented above are capable of deliver-ing a set of robust feature vectors and other terrain/traversability maps to other on-board GNC systems. The feature vectors can in turn be integrated into a full system that would help to increase the traversal speed and effectiveness of plan-etary rovers compared to current systems.
Chapter 1. Introduction 15
1.6
Publications
Research material within this report has been published in the following journal arti-cles and conference proceedings together with an overview of the citation frequency of these publications shown in figure??(listed by contribution relevance with contribu-tion highlights in"italics"):
Publications that contribute to this research
1. Structure Augmented Monocular Saliency for Planetary Rovers Journal Paper -Conrad Spiteri, Affan Shaukat, Yang Gao - Robotics and Autonomous Systems, Volume 88, February 2017, Pages 1–10 - ‘published’ [35].
Researched and designed the algorithm, built test environment, analysed the data and compiled the manuscript.
2. Real-time Visual Sinkage Detection for Planetary Rovers - Journal Paper - Con-rad Spiteri, Said Al-Milli, Yang Gao, Aridane Sarrionandia – Robotics and Au-tonomous Systems - Vol 72, pages 307 - 317, 2015 - ‘published’ [2].
Refined the algorithm based on previous work [3], collected various datasets at a field trial, analysed the data and compiled the manuscript.
3. Lunar Soil Strength Analysis based on Chang’E 3 Data - Journal Paper - Yang Gao,
Conrad Spiteri, Chun-Lai Li, Yong-Chun Zheng - Advances in Space Research, Volume 58, Issue 9, 1 November 2016, Pages 1893–1899 - ‘published’ [36]
Researched and designed the algorithm, built test environment, analysed the data and compiled part of the manuscript.
4. Real-time Vision Based Dynamic Sinkage Detection for Exploration Rovers - Con-ference Paper - Al-Milli, S.;Spiteri, C.; Comin, F.; Yang Gao - Intelligent Robots and Systems (IROS), 2013 IEEE/RSJ International Conference on, pp.4675,4680, 3-7 Nov. 2013 – ‘published’ [3].
Researched and designed the algorithm, analysed some of the data and compiled part of the manuscript.
16 Chapter 1. Introduction 5. A Survey on Recent Object Detection Techniques Useful for Monocular Vision-based Planetary Terrain Classification - Journal Paper - Yang Gao,Conrad Spiteri, Minh-Tri Pham, Said Al-Milli - Robotics and Autonomous Systems, Volume 62, Issue 2, February 2014, Pages 151-167– ‘published’ [9].
Further expanded on previous work, added clarification where required, added a new sec-tion to complete a void in the research, compiled final version of manuscript.
6. Quasi-Thematic Feature Detection and Tracking for Future Rover Long-Distance Autonomous Navigation - Conference Paper - A. Shaukat, C. Spiteri, Y. Gao, S. Al-Milli, A. Bajpai - - 12th Symposium on Advanced Space Technologies in
Robotics and Automation ASTRA 2013 – ‘published’ [29].
Researched and designed one of two algorithms, built test environment, analysed the data and compiled part of the manuscript.
7. Next Generation GNC Architectures - Journal Paper - Affan Shaukat, Said Al-Milli, Abhinav Bajpi,Conrad Spiteri, Guy Burroughes, Yang Gao, Daisy Lachat, Matthias Winter - Astra 2015, At Noordwijk, the Netherlands, Volume: 13th Symposium on Advanced Space Technologies in Robotics and Automation ‘pub-lished’ [11].
Researched literature on a proposed algorithm and compiled part of the manuscript.
Publications that indirectly contribute to this research
8. Towards Camera-LIDAR Fusion-Based Terrain Modelling for Planetary Surfaces: Review and Analysis - Journal Paper - Shaukat Affan, Blacker Peter C., Spiteri Conradand Gao Yang - Sensors Journal, vol. 16, no. 11, p. 1952, 2016 - ‘published’ [37]
Researched and designed one of the algorithms, analysed some of the data and compiled part of the manuscript.
9. Multi-Level Soil Sensing Systems to Identify Safe Trafficability Areas for Extra-Planetary Rovers - Conference Paper - W. A. Lewinger, F. Comin, S. Ransom, L.
Chapter 1. Introduction 17 Richter, S. Al-Milli,C. Spiteri, Y. Gao, M. Matthews, C. Saaj - - 12thSymposium
on Advanced Space Technologies in Robotics and Automation ASTRA 2013 – ‘published’ [38].
Compiled part of the manuscript based on previous work [2] that is a key component of this paper.
10. Remote Sensing of Martian Terrain Hazards via Visually Salient Feature Detec-tion - Conference Abstract - Said Al-Milli, Affan Shaukat,Conrad Spiteri, Yang Gao - European Planetary Science Congress Vol. 9, 2014 ‘published’ [39]
Chapter 2
Literature Review
2.1
Terrain Classification and Object Detection
This Chapter introduces a number of key concepts pertaining to components within the Autonomous Data Selection block of a typical Guidance Navigation and Control (GNC) architecture state of the art with reference to planetary rovers (See figure 1.1).
A key component of the GNC system described in [12] is the ability to autonomously asses the terrain via the Autonomous Terrain Assessment block (See Figure 1.1 & 1.2). Terrain classification and object detection methods help create a topography map that categorises its traversability, highlight objects that may be a hazard to the rover and eventually plan an appropriate path.
Terrain classification and object detection methods start with the analysis of raw data from the rover‘s plethora of sensors. Cameras (both monocular and stereo) are the most common sensors used, followed by LIght Detection And Ranging (LIDAR) instruments which are often found in terrestrial applications [9]. They provide direct information about the terrain at mid-range to long-range distances. Motor encoders and other proprioceptive sensors such as vibration sensors, current sensors, and con-tact sensors provide indirect information of terrain at short-range or zero distance.
20 Chapter 2. Literature Review A wide variety of methods have been proposed for Terrain classification and object detection, covering all distances, from the zero to long-range. These include methods that work exclusively for a certain type of sensors or ranges, as well as those that fuse information from different types of sensors, and from different ranges. Sancho-Pradel and Gao have summarised the majority of recent Object detection methods in [12]. They group the Object detection methods into five categories, namely: geometric anal-ysis, appearance analanal-ysis, soil analanal-ysis, and scientific interest analysis .
Figure 1.1 illustrates the functional configuration proposed for autonomous plane-tary robots, which incorporates a terrain assessment module that can combine multiple features (i.e. geometry, appearance, terramechanic parameters and scientific interest index) in a decentralized fashion. These features are extracted by a set of specialized blocks derived from existing techniques and can be extended to accommodate new approaches and sensors.
Geometric information from sensors like LIDARs or stereo-vision work well for short to mid-range distances, however, the estimated Digital Terrain Model (DTM) in-formation becomes less reliable as the distance increases, and may not be sufficient to optimally navigate a rover through long distances. In addition LIDAR technology has not been extensively used in space missions due to the practical difficulties of maintain-ing the mechanical elements, high power requirements and weight constraints, how-ever, space ready 3D LIDAR systems for planetary rovers are starting to emerge [40].
At long-range distances, monocular images are probably the only reliable sensory input available [12]. Image cues can provide valuable information to complement ge-ometric methods in the analysis of a scene. Although they contain rich information for object detection, they are harder to process than other types of sensory input. One solution is to use low-level classifiers, a classification method that relies on a single visual feature such as colour, texture, and geometric properties [41]. Nevertheless, in unstructured environments such as Mars, none of these features are sufficient on their own for robust classification of the terrain.
Chapter 2. Literature Review 21 Martian-like environments, the colour variation is narrowed due to the lack of moisture and almost homogeneous dust covering the planet. Colour based classifiers also need to be carefully tuned in order to operate reliably. Image texture is a measure of special variation in intensity and is often used to detect structural, roughness or regularity differences in an image. Texture feature classifiers suffer from range sensitivity and from significant intra-class variability. Geometric-based classifiers suffer from the lack of regularity of objects found within a natural environment setting.
Vision-based Object detection methods can be roughly classified into two groups, those working at: 1) Short to mid-range distances, and 2) Long-range distances.
2.1.1 Short and medium range
A variety of terrain types is likely to be encountered thus pre-emptive planning based on input data is desirable [42]. The analysis of visual information (e.g. color & texture) from small terrain patches often provides a good balance between sensor complexity and object detection accuracy.
Shirkhodaie et al. [43] addressed terrain traversability as a classification problem where statistical information extracted from small image patches is combined with soft computing inference techniques. They presented a comparative study of the results obtained with three different classifiers based on: 1. Heuristic rule-based terrain classi-fier (RBTC) 2. Artificial neural networks (ANN) 3. Fuzzy logic reasoning (FL). Terrain patches were classified into one of the following types: a) sandy, b) rough, c) very rocky, d) rocky, e) impassable f) uncertain.
Visual appearance methods have also been proposed for estimating terrain geo-metric properties. Howard and Seraji [44] used monocular techniques to obtain terrain traversability factors such as obstacles, terrain roughness and terrain discontinuities.
Huertas et al. [45] presented a purely image-based set of algorithms for detecting most types of potentially fatal hazards, such as slope, roughness, rocks and craters. Craters, for instance, are located by extracting their rims (i.e., Canny edge detection
22 Chapter 2. Literature Review and edge grouping), fitting an ellipse to each edge group, and finally refining the el-lipses using the original intensity image. Rocks, on the other hand, are detected in two steps, namely shadow detection (using either k-means clustering or maximum entropy thresholding) and rock modeling (based on the shape of the shadows).
In [46], Angelova et al. used appearance information to recognize a set of previ-ously learned terrain classes. Following the texton-based texture recognition method proposed by Varma et al. [47], monocular images are used for classifying the terrain in each cell of a rover’s local map, by analysing terrain patches corresponding to the back-projections of map cells into the image plane.
Thompson and Cabrol [48] presented an object detection method that can be run on-board. Four general sedimentological “soil types” for the images were considered: drifts, ripples, dunes, and composite soil. In their method, they used the integral im-age transform to produce pixel-level texture features. A decision tree using integer arithmetic was used for fast object detection of probe patches. These two techniques combined an efficient algorithm requiring a small memory footprint.
Rock heights are a critical measurement for safe landing and rover traversal map-ping. Thus, one desirable goal is to derive a very good estimation of its height together with a good estimation of its location, and a reasonable approximation of its 2D hori-zontal cross-section. Serrano et al. proposed in [49] to use camera imagery at distances under 8 km to the ground, in order to identify craters and rocks, following Huertas et al.’s image-based algorithms, combining it with LIDAR and radar measurements.
Rock shapes are not only important for path planning and navigation, but also of in-terest to geologists and planetary scientists, who will benefit from methods for correct segmentation of rocks in natural scenes. However, planetary scenes are poorly suited for current visual segmentation techniques as they have no uniform property to distin-guish them from background soil. Dunlop et al. [50] presented a novel detection and segmentation method incorporating features from multiple scales to detect rocks from short-range to mid-range distances. These features include aspects such as texture, ob-ject attributes such as shading and 2D shape and scene elements such as the direction
Chapter 2. Literature Review 23 of illumination. Their method uses a “superpixel segmentation” followed by “region merging” to search for the most probable groups of superpixels. A learning algorithm with models of rock geometry definitions identifies whole rocks by scoring candidate superpixel groupings, however, the method is computationally expensive [46].
2.1.2 Long range
Many terrain assessment and path planning approaches proposed in the literature are capable of avoiding short-range geometric hazards such as rocks, steep slopes, rough terrains, etc. Learning to identify long-range hazards and other terrain parameters however, is a challenging problem, and is a relatively new area of research. A common approach for training the robot to remotely extract terrain information is near-to-far learning, which involves learning the mapping between some local terrain parameters that the rover has good access to (e.g. geometric information, colour, texture, vibration signature), and certain characteristics of a distant terrain area. These characteristics could be roughly divided into two groups, namely terrain class (e.g. traversable/non-traversable, type, etc.) and terrain traversability parameters, such as slip and rough-ness.
Bajracharya et al; [42] presented a method for learning Long-range vision-based object detection from short-range geometry-based object detection. The method con-sists of three steps where local terrains are classified into either traversable or non-traversable using a local terrain classifier that operates on stereo data, and the classifi-cation results are back-projected to the image as labeled image windows. Finally, the SVM classifier is re-applied to the image to classify terrains at long-range distances. In [51], Brooks and Iagnemma presented a vibration-based local classifier (trained of-fline) for supervising a longer range visual classifier in a similar manner.
Hadsell et al. [25] presented a self-supervised learning method for classifying com-plex terrain traversability at distances up to the horizon, therefore allowing high-level strategic long-range planning. The approach is similar to Bajracharya’s [42], in that long-range vision-based object detection is learned from short-range geometry.
24 Chapter 2. Literature Review Roughness is also an important factor in the assessment of the traversability of remote terrain areas. Rough terrains can have various negative effects on planetary rovers, such as reducing the reliability of electrical and mechanical systems, increasing the localization error and making maneuverers more complex. Furthermore, traversing rough terrains would typically require the vehicle to reduce its speed.
A self-supervised learning method for training a terrain roughness predictor using laser range data was presented by Stavens and Thrun [52]. The purpose of this work is not to estimate the roughness beyond the range of the lidar, but to decrease the mea-surement errors obtained while driving at certain speeds on non-flat surfaces, which at distances close to the LIDAR’s range can result in the creation of artificial obstacles. Current planetary robotic systems navigate using stereo data to reconstruct a digital terrain model with images taken at rest, hence avoiding this problem. Future missions however, will require more sophisticated hardware and algorithms that will allow the robots to assess the terrain in real-time, while in motion [9].
2.2
Digital Terrain Model reconstruction
Vision-based terrain model reconstruction has been an attractive solution for distin-guishing nearby objects for planetary rovers. It is perceived that in the near future, planetary rovers will require to perform this process faster in order to increase the traversal distances in an autonomous fashion [53]. This will necessitate algorithms that have the capability of real-time three dimensional scene analysis, which are quite con-voluted.
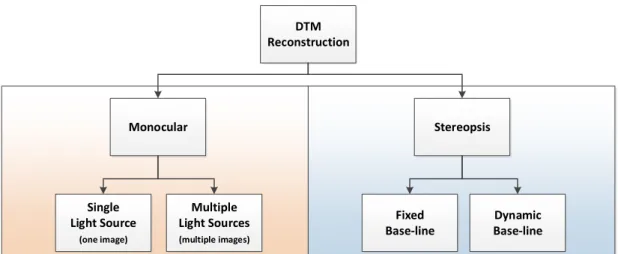
Visual processing for terrain modeling can arbitrarily be segregated into two cat-egories: stereopsis processing and monocular processing [54] which are then further partitioned as illustrated in Figure 2.1.
Chapter 2. Literature Review 25 DTM Reconstruction Monocular Stereopsis Fixed Base-line Dynamic Base-line Single Light Source (one image) Multiple Light Sources (multiple images)
FIGURE2.1: Visual processing for terrain modeling methods.
2.2.1 Stereopsis
Stereopsis (or stereo vision) takes advantage of the binocular disparity between two cameras pointing at the same scene from two different vantage points, similar to the human visual arrangement.
As depicted in figure 2.1 , Stereopsis can be further divided into two generic cate-gories; a) Fixed baseline and b) Dynamic baseline
2.2.1.1 Fixed Baseline
In a fixed baseline binocular stereo arrangement such as illustrated in figure 2.2 the cameras are rigidly mounted with a known baseline and the disparity between images allows the vision processing mechanism to recover 3D point clouds from the scene and eventually build a DTM from this information. However, the point cloud recovery becomes less reliable as distance from the camera increases and the accuracy is a di-rect relation to the separation between optical axes of the two cameras (parallax) [54]. Figure 2.2 illustrates the fundamental theory in calculating the distance of a particular pixel within the scene using binocular stereo with a fixed baseline.
In figure 2.2f is the focal length of the cameras,bis the baseline (distance between the centre point of the lenses assuming a pinhole camera model), dl and dr are the
26 Chapter 2. Literature Review
FIGURE2.2: Calculating distance of a pixel from the camera using binoc-ular method.
distances from the centre of the projected pixel onto the respective sensor of the left and right cameras andzis the distance to be calculated as per equation 2.1.
z= bf
|dl−dr| (2.1)
However, this assumes that the stereo camera has been calibrated and the images rectified. The geometry of a two-camera system is computed a priori in the stereo cal-ibration process. Typically a calcal-ibration process would involve capturing synchronous image pairs containing a chequered board or known pattern at various distances and orientations. The pixel location of the patterns are subsequently used to compute the 3D pose of the calibration board in each image pair and an accurate model of the stereo camera. The model consists of the intrinsic parameters of each camera such as the cam-era’s focal length, distortion and the extrinsic parameters, i.e. the rotation and shift in three dimensional space between the left and right camera. Figure 2.3 illustrates typical calibration data for aPointGrey Bumblebee BEX2stereo camera [55] (See [56] for calibra-tion methodology details). The plot is based on the extrisic parameters of the camera and helps to quickly discover obvious errors in the camera calibration by plotting the
Chapter 2. Literature Review 27 relative locations of the camera to the calibration pattern in the camera’s coordinate system. Corresponding points that have been identified in the rectified image pairs are then triangulated to recover their metric 3D coordinates with respect to the camera as per equation 2.1. 1314 1 8 25 29 7 24 22 11 27 6 12 21 28 10 20 23 9 2 26 4 400 3 30 5 15 16 18 300 200 17 19
Extrinsic Parameters Visualization
200 1200 100 X (mm) 1000 0 Y (mm) 2 -100 0 800 X c -200 Z (mm) 1 Zc Y c -300 600 400 -200 200 0
FIGURE2.3: 3-D visualization of extrinsic parameters showing the
cal-ibration patterns with respect to a PointGrey Bumblebee BEX2 camera.
(Calibration parameters are illustrated in Appendix A Figure 3)
.
Since the cameras are rigidly mounted the Fundamental matrix can be calculated to a degree of certainty with the error being proportional to the noise. In most cases this error is negligible for well calibrated cameras [57].The main issue is determining which pixel in the first camera corresponds to the same pixel in the second camera. This is known as the correspondence problem and is discussed later in this chapter (See section 2.2.1.3).
28 Chapter 2. Literature Review
2.2.1.2 Dynamic Baseline
FIGURE2.4: Calculating distance of a pixel from a moving camera using multi-view geometry (SfM)
.
The basic assumption of a dynamic baseline stereo algorthim, also known as Struc-ture from Motion (SfM), is that the scene does not deform or move. The relative motion denoted byV between camera positions and an arbitrary 3D pointP = [X, Y, Z]T can be described as equation 2.2
V =−T−ω·P (2.2)
whereT andωare the translational velocity vector and the angular velocity vector of the camera. The connection between the depth of 3D points and its 2D motion field is incorporated in the basic equations of the motion field, which combines equation 2.2 and the knowledge of perspective projection:
vx= Tzx−Txf Z −ωyf+ωzy+ ωxxy f − ωyx2 f (2.3) vy = Tzx−Tyf Z −ωxf+ωzy+ ωyxy f − ωxx2 f (2.4)
wherevx andvy are the components of motion field inxandydirection respectively.
Chapter 2. Literature Review 29 component of the x-axis, y-axis and z-axis directions.
The calculation of the fundamental matrix also necessitates the consideration of 36 parameters to account for epipoles at infinity and epipolar transformation elements that may be equal to 0. Various constraints and simplifications have been formulated to lower the degree-of-freedom of the equations, which leads to the different algorithms for depth estimation, each suitable for solving problem in a specific domain [58]. This leads to unwieldy implementations which require considerable optimization, yielding a high degree of error [59]. The error in the fundamental matrix accrues with every calculation since accumulated error in the determination of the rotation matrices and translation vectors increase due to odometry error [60].
Furthermore these errors are augmented when triangulating a pixel to extract its depth since the Fundamental matrix and a point in one image, define an epipolar line in the other image along which its corresponding point must lie [60]. (See Fig. 2.4). The epipolar line (etoe0 in f
![Figure 1.1 depicts a typical functional configuration of a planetary robot autonomous operation [12] where the “Autonomous Terrain Assessment” block (green dotted box)](https://thumb-us.123doks.com/thumbv2/123dok_us/378935.2541840/29.892.178.786.543.980/functional-configuration-planetary-autonomous-operation-autonomous-terrain-assessment.webp)
![Figure 3.1 depicts the SfS algorithms implemented, namely, 2 minimization ap- ap-proaches [107, 108] , a propagation [109], a local [110], and 2 linear methods [18, 111].](https://thumb-us.123doks.com/thumbv2/123dok_us/378935.2541840/72.892.160.671.474.554/figure-depicts-algorithms-implemented-minimization-proaches-propagation-methods.webp)