Finding overlapping communities based on
Markov chain and link clustering
著者
DENG Xiaoheng, LI Genghao, DONG Mianxiong, OTA
Kaoru
journal or
publication title
Peer-to-Peer Networking and Applications
volume
10
number
2
page range
411-420
year
2017-03
URL
http://hdl.handle.net/10258/00009213
doi: info:doi:10.1007/s12083-016-0457-0Finding Overlapping Communities based on
Markov Chain and Link Clustering
Xiaoheng Deng1, Genghao Li1, Mianxiong Dong2, and Kaoru Ota21
School of Information Sci & Eng, Central South University, Changsha 410083, China
2 Department of Information and Electronic Engineering, Muroran Institute of
Technology, Muroran 050-8585, Japan Correspondence:mx.dong@csse.muroran-it.ac.jp,
Abstract. Since community structure is an important feature of com-plex network, the study of community detection has attracted more and more attention in recent years. Despite most researchers focus on iden-tifying disjoint communities, communities in many real networks often overlap. In this paper, we proposed a novel MCLC algorithm to discover overlapping communities, which using random walk on the line graph and attraction intensity. Unlike traditional random walk starting from a node, our random walk starts from a link. First we transform an undi-rected network graph to a weighted line graph, and then random walks on this line graph can be associated with a Markov chain. By calculating the transition probability of the Markov chain, we obtain the similarity between link pairs. Next the links can be clustered into ”link commu-nities” by a linkage method, and these nodes between link communities can be overlapping nodes. When converting the ”link communities” into the ”node communities”, we make a definition of attraction intensity to control the overlapping size. Finally the detected communities are per-mitted overlapped. Experiments on synthetic networks and some real world networks validate the effectiveness and efficiency of the proposed algorithm. Comparing overlapping modularity Qov with other related
algorithms, the results of this algorithm are satisfactory.
Keywords: Community detection·Random walk·Link community ·
Overlapping community
1
Introduction
Including social, biological, and technological systems, many systems in world can be described as complex networks whose elements are neither purely regular nor purely random [1, 2]. One of the most relevant features of complex networks is community or modular structure, which should have more internal than external connections [3–5]. Communities often refer to groups or clusters, and people or things in same community often have more similarities.
Nowadays people’s life has been inseparable from the mobile network[6–8]. As mobile web evolved from proprietary mobile technologies and networks to
full mobile access to the Internet[9–12], much like web-based social networking, mobile social networking occurs in virtual communities. Finding and analyzing community structure provides invaluable help in deeply understanding the struc-ture and function of a network, as widely demonstrated by several case studies in social science[13], biology[14], ecology[15], economics[16] etc.
A large quantity of approaches for detecting community has been proposed over the years [17]. Most early approaches, such as the Kernighan-Lin algorithm [18], spectral partitioning [19], hierarchical clustering [20] , and modularity opti-mizing [21] etc, focus on identifying disjoint communities. This type of detection put each node into one and only one community. However, communities are nested and overlapped in most real world networks. For example, a social net-work where each vertex represents a person and communities represent different groups of friends: one community for family, another community for co-workers, still one for friends in the same sports club.
Fig. 1.Summary of the procedure for community analysis. From the network descrip-tion (top panel) and a suitable definidescrip-tion of link distance, a hierarchical tree is derived by cluster analysis(left panel). The network finally divided into two link communi-ties(bottom panel), overlapping node 4 is between two communities.
Indeed, overlap is quite a significant feature in real network. Therefore more and more researches focus on overlapping community detection, and many
mea-sures have been proposed. For instance, the CPM (Clique Percolation Method) algorithm [22] which is based on clique percolation , the LFM (Local Fitness Maximization) algorithm [23] which utilizes local expansion and optimization, the method based on a local definition of community strength [24], the link method which reinvents communities as groups of links rather than nodes [25], and some recent developed algorithms [26–29]. Among these measures, Evans et al. made a definition of line graph [30], and Ahn et al. proposed the notion of link community [25]. By coincidence, both of them divided network into small link groups and then mapped to node groups. As links reflect the relationship between node pairs, link based communities show the different features of groups in the whole network, and this paper focus on link based overlapping community detection method.
In addition, random walk has been a conventional method of detecting munities[31, 32]. Considering a network, there will be many links within a com-munity, and fewer links between communities. If you were to start at a node, and then randomly travel to a connected node, you are more likely to stay within a community than travel between. By doing random walks upon the graph, it is possible to discover where the flow tends to gather, and therefore, where clus-ters are. There are many algorithms finding communities based on random walk, but most of random walks start from node and their detected communities are disjoint [33–35].
In the paper, we proposed an overlapping community detection algorithm based on Markov chain and link clustering (MCLC). The rough procedure of this method is shown in Fig.1. The distance (similarity) between link pairs can be obtained by computing the transition probability through random walks on the line graph. When the distance is smaller, namely the similarity is lager, the link pairs are more likely to be assigned into a same community. Clustering the link pairs according to the distance, thus link communities output. Finally, the link communities can be converted to node communities by setting an appropriate threshold of attention intensity. The last identified communities may have some overlapping nodes.
2
Related work
2.1 The weighted line graph model of network
Generally, a network can be simply regarded as a graphG(V, E), where|V|=N represents vertices and |E| = M represents edges. In the most instances case the network is a directed weighted graph denoted by a N×N weight matrix W = [wij] , wherewij ≥0 is the weight of the linki→j. The graph adjacency
matrix A = [aij] is a N ×N binary matrix, where aij = 1 if wij > 0 , and
aij = 0 otherwise. In this paper, we consider the networks are undirected, namely
wij =wji. If the network is also unweighted, then all weights equal to 1 and
W =A.
Nodes and edges are two necessary roles of a network. Most of the network topology is based on the entities as the nodes, the relation as edges. However
Fig. 2.Four different matrices
Evans et al.[30] proposed a definition of ”line graph”, which regards the relation as nodes and the entities as edges. The incidence matrixB= [biα] is an important
bandage between node graph and line graph, which is aN×M matrix and the elementsbiαcan be obtained by
biα=
wij,nodeiandj are two ends of edgeα;
0, otherwise. (1)
The adjacency matrix of line graph L= [lαβ] is a M ×M binary matrix ,
where lαβ = 1 if link α and link β have a common node, otherwise lαβ = 0.
When random walking on the line graph, the probability of next step should be different. Thus we depend on a weighted link matrix H = [hαβ], which can be
obtained by matrixB: Hαβ= X i biαbjα si . (2)
wheresi is the strength of nodeiandsi=Pjwij=Pαbiα. The weights inH
indicate the strength of link pairs. As seen in Fig.2, it has displayed four different matrices and illustrated the transformation of a graph adjacency matrixA into a weighted matrixH. We find there are self-loops inH, that is to say, each link have connection in itself. Thus a random walker on line graph can stay in a link (or actually walk between two connected nodes).
2.2 The distance between links
The M ×M link weighted matrix H can be associated to a M-state Markov chain, the transition matrixP = [Pαβ] is defined by
pαβ=
hαβ P
βhαβ
(3)
Consider a large number of repetitions of a random walk start from linkα. [Pt]
αβ is the probability that the walker start fromαand stay inβ aftertsteps.
If random walks of length T are performed fromα, the excepted probability of visits to β is PTt=1[Pt]
αβ (1 ≤t ≤T). Cluster analysis can be used to group
”similar link pairs” into candidate link communities. We propose a (symmetric) similarityφαβdefined by φαβ=φβα= T X t=1 ([Pt]αβ+ [Pt]βα) (4)
Then the distancedαβ between link pair (α, β) can be obtained by
comple-menting the similarity and normalizing the results from 0 to 1,
dαβ=dβα= 1−
φαβ−min φ
max φ−min φ (5)
Note that the choice of the time horizon T is potentially critical. Cluster analysis yields a different hierarchical tree (dendrogram) for each time horizon T, whose choice is thus nontrivial. At the two extremes, settingT = 1 restricts the pairs of links which are candidate to nonzero similarity to neighboring pairs only, whereas larger and larger values ofT tend to make any link equally similar to any other.
2.3 The function of attractive intensity
Suppose a network withM links,CL={P1, P2, . . . , Pq}is a partition of the links
into q link communities, withS
cPc =E and Pc∩Pd =∅ for all c, d. In order
to convert link communities into node communities, we proposed a function of attractive intensityIPc i , which is defined as IPc i = P (i,j)∈Pcwij P jwij = s in i (Pc) si (6)
where (i, j) represents a link with two end nodesi andj, si is the strength of
nodei, sin
i (Pc) is the sum weight oficonnected links in link communityPc.
The value of IiPc is belong to [0,1], which indicates the attraction intensity from link community Pc to node i. WhenIiPc = 1, nodei is attracted by link
community Pc completely, namely i is contained by Pc; when IiPc = 0, link
need to consider the attractive intensity of edge nodes between link communities. These edge nodes can be expressed by:
edge node={u|(u, v)∈Pc,(u, w)∈Pd, c6=d} (7)
All the edge nodes can be regard as overlapping nodes, but the number of overlapping nodes is often large in this case. Here we set a threshold δ of the attractive intensity to control the overlapping size: if the maximal attractive intensityImaxto an edge node usatisfied
Imax= max 1≤c≤q{I Pc u }=I Pm u > δ (8)
and the link communityPmis unique, then the edge nodeucan be entirely
ab-sorbed into the link communityPm; otherwise the edge nodeuis an overlapping
node. As a result, some of edge nodes can be brought in an appropriate link community, the rest of edge nodes are still overlapping nodes.
3
The algorithm
According to the three main idea given above, our MCLC algorithm can be summarized as three main stage as follows:
1. Given an undirected network G(V, E), number each link, then compute the incidence matrix B and the weighted link matrix H, the pseudo-code of H generating is shown in Algorithm 1 ;
2. Calculate the distance(similarity) between link pairs by random walking on the weighted line graph. The pseudo-code of link distance calculating can be described in Algorithm 2. Then we use average-linkage clustering method to divide network intoqlink communitiesCL={P1, P2, . . . , Pq};
3. For internal nodes in a link community, assign the node to the same commu-nity; for edge nodes which are between link communities, assign some of the edge nodes to an appropriate link communities by setting a proper attrac-tion intensity threshold δ. As a result, the link communities change to node communities allowed overlap.
Average-linkage hierarchical clustering builds a link dendrogram from the links distance. If you want to get a partition ofqcommunities, cut the dendro-gram at the maximalqclusters. We give the pseudo-code of our MCLC algorithm in Algorithm 3.
The attraction intensity thresholdδis also belong to [0,1]. The lagerδ, the more difficult to meet the condition, in other words, the less edge nodes can be completely absorbed into a community. Generally we setδ= 0.5 in accordance with the notion of ”community in a strong sense” put forward by Radicchi et al.[4], or simply: in an undirected and unweighted network, if the most and more than a half of uconnected links are in a unique link community, then node u can be completely absorbed into the link community.
Algorithm 1Atrans2H 1: Input: graphG(V, E)
2: G(V, E)→graph weighted matrixW
3: Sort each edge inGand save in matrixLG
4: n=size(W,1) 5: m=length(LG) 6: B=sparse(n, m); 7: forαin 1 to mdo
8: if nodeiconnect to edge αinLG then
9: B(i, α) =W(i, j) 10: end if
11: end for
12: Compute the strength of each node and save in vector S 13: M=dig(1/S1,1/S2, ,1/Sn) 14: H=B∗M∗BT 15: Output:H Algorithm 2LinkDistance 1: Input:H,T 2: m=size(H,1) 3: P=sparse(m, m); 4: foriin 1 to mdo 5: forjin 1 to mdo 6: P(i, j) =H(i, j)/P jH(i, j) 7: end for 8: end for 9: D=sparse(m, m) 10: fort1 in 1 to Tdo 11: P tot=P 12: P curr=P 13: fort2 in 2 tot1 do 14: P curr=P∗P curr
15: P tot=P tot+P curr
16: end for 17: S= (P tot+P totT)/T 18: end for 19: S(i, i) = 0 20: D= 1− S−minS maxS−minS 21: Output:D
Analyzing the complexity of MCLC algorithm , the first step run in time O(k2
maxn). In the second step, it takes (tm2) to calculate the distance between
links. In the third step, it takes O(n) to transform link communities to node communities. Finally the total computing time isO(k2
maxn+tm2+n), the worst
Algorithm 3MCLC 1: Input: graphG(V, E), T, q
2: H←Atrans2H(G) 3: D←LinkDistance(H, T)
4: Cluster(D, q)→CL={P1, P2, . . . , Pq}
5: Find the edge nodes betweenCLand save in setU
6: foriinU do
7: forPcinCLdo
8: calculate attraction intensityIPc
i
9: end for
10: if Imax=IiPm > δandPmis uniquethen
11: nodeionly belong toPm
12: end if
13: end for
14: UpdateCLtoCN ={P1, P2, . . . , Pq}
15: Output:CN
4
Experiments and results
To evaluate the performance of MCLC, we implement our method and design experiments in Matlab platform, running on a PC with 2.94 GHz, 4 GB mem-ory and Win7 operating system. we have considered the algorithm in synthetic networks and some real world networks.
4.1 Synthetic networks
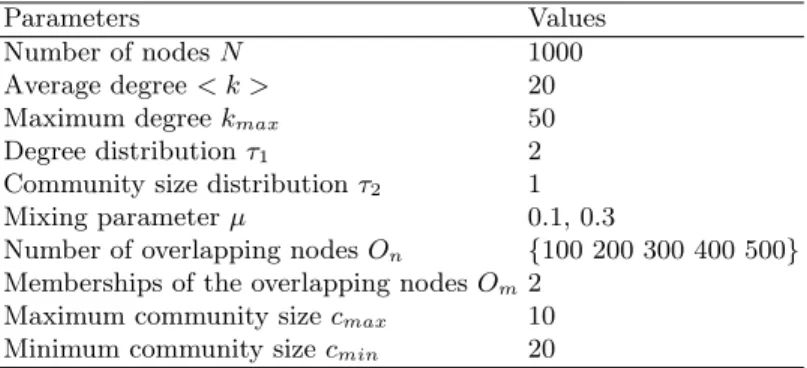
The LFR benchmarks is a widely accepted benchmark for testing community de-tection introduced by LancichinettiFortunato,and Radicchi [36, 37]. LFR bench-marks is a family of synthetically generated graphs, it contains several types and rich parameters to simulate various networks. In order to find the overlapping communities on undirected and unweighted networks, the parameters for the LFR benchmarks are given in Table 1.
Measuring Normalized Mutual Information (NMI)[38] is a common method to estimate the similarity between the true partition and the detected ones, which is defined as follows:
I(A, B) = −2 cA P i=1 cB P j=1 Nijlog(NijN/Ni.N.j) cA P i=1 Ni.log(Ni./N) + cB P i=1 N.jlog(N.j/N) (9)
where the number of real communities is denoted cA and the number of found
communities is denotedcB, the sum over rowiof matrixNij is denotedNi.and
the sum over columnjis denotedN.j. If the found partitions are identical to the
real communities, then I(A, B) takes its maximum value of 1. If the partition found by the algorithm is totally independent of the real partition, for example when the entire network is found to be one community, then I(A, B) = 0.
Table 1.The parameter settings of LFR benchmarks
Parameters Values
Number of nodesN 1000
Average degree< k > 20
Maximum degreekmax 50
Degree distributionτ1 2
Community size distributionτ2 1
Mixing parameterµ 0.1, 0.3
Number of overlapping nodesOn {100 200 300 400 500}
Memberships of the overlapping nodesOm2
Maximum community sizecmax 10
Minimum community sizecmin 20
For overlapping communities, the overlapping NMI [23] is extended from the NMI in Ref.[38]. For partitions C0 and C00 , the overlapping NMI is given as follows:
N(X|Y) = 1−[H(X|Y) +H(Y|X)]/2 (10) whereX(Y) is the random variable associated to the partitionC0(C00),H(X|Y) is the normalized conditional entropy of a coverXwith respect to coverY, which is defined as: H(X|Y) = 1 |C0| X k H(Xk|Y) H(Xk) (11)
We test our MCLC algorithm on these LFR benchmarks by setting four different attraction intensity threshold δ={0,0.5,0.7,1}. The results of exper-iments can be seen in Fig.3. The maximum value of NMI is close to 0.9 when µ = 0.1 and δ = 0. When the number of overlapping nodes On become lager,
the value of NMI is diminish. We find bothµ = 0.1 and µ= 0.3, the value of NMI is smaller when δ become lager. If δ is fixed, the value of NMI is larger when µ= 0.1. So we conclude MCLC algorithm can find suitable communities through setting proper attraction intensity threshold.
4.2 Real world networks
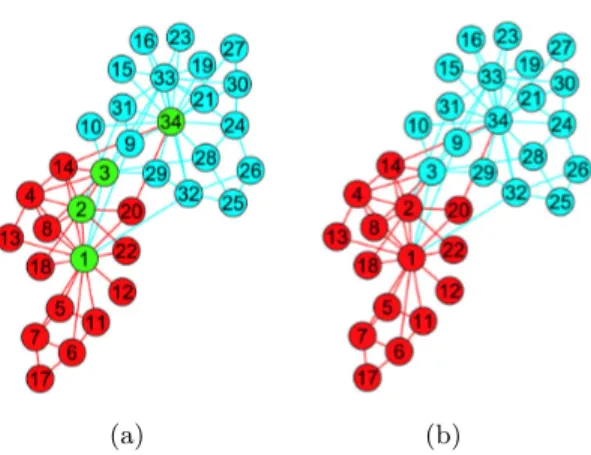
Zachary’s karate club network Zachary’s karate club network [39] is a real social network, which is a widely used network for testing communitys algorithm. There are 34 individuals and 78 links in the network, and the links represent friendships between individuals in the karate club. Later, the club split in two as a result of the contradiction between the administrator and the instructor. When we apply the MCLC algorithm to this network, the results can be shown in Fig. 4 .
We divide the karate club network into two communities using our MCLC algorithm with T = 1. First we set δ = 1, all the edge nodes (number 1,2,3, and 34) are overlapping nodes, the remain nodes are absorbed into two link communities, as seen in Fig. 4.(a). The maximal attractive intensities of the four
100 200 300 400 500 0 0.1 0.2 0.3 0.4 0.5 0.6 0.7 0.8 0.9 1 On (µ=0.1)
Normalized Mutual Information
δ=0 δ=0.5 δ=0.7 δ=1 100 200 300 400 500 0 0.1 0.2 0.3 0.4 0.5 0.6 0.7 0.8 0.9 1 On (µ=0.3) δ=0 δ=0.5 δ=0.7 δ=1
Fig. 3.The results on LFR benchmarks.
(a) (b)
Fig. 4.Zachary’s karate club network.(a)Two communities colored with red and blue respectively are generated by MCLC method whenδ= 1, and the green nodes represent the overlapping parts; (b)Two communities generated by MCLC method whenδ <0.6.
edge nodes are 0.8125, 0.8889, 0.6000 and 0.8824 respectively. So when we set δ <0.6, all edge nodes can be absorbed into the related link communities, the result can be seen in Fig. 4.(b). Except the node 3 is assigned error, other nodes are consistent with the real nodes partitions.
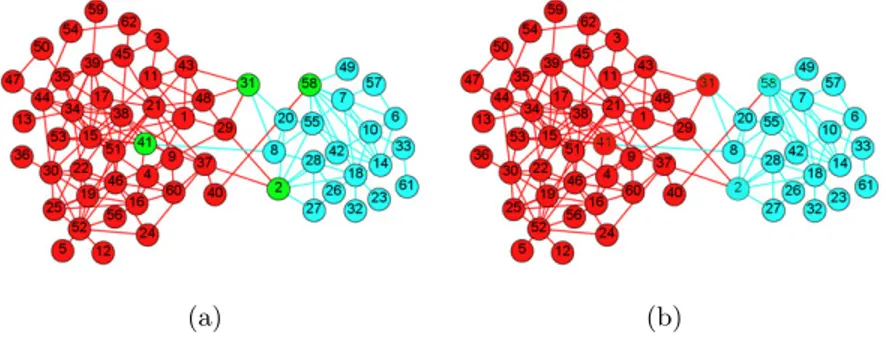
Dolphins network Dolphins network [40] is an undirected social network of frequent associations between 62 dolphins in a community living off Doubtful Sound, New Zealand, as compiled by Lusseau et al. (2003). In the 7-years obser-vation, the original community naturally divided two big group, then the larger group separated into four small group later.
(a) (b)
Fig. 5.Dolphins network. (a)Two communities generated by MCLC method, the red and the blue edges represent two link communities respectively, the green nodes rep-resent the edge nodes; (b) Whenδ <0.6, every edge node between link communities is distributed to node community respectively.
From Fig. 5, the network is divided to two large groups by our method with T = 1. Fig. 5(a) indicates two identified link communities using MCLC algo-rithm, and the green nodes (number 2,31,41,58) are edge nodes. The maximal attractive intensities of the four edge nodes are 0.7500, 0.6000, 0.8750, 0.8889 respectively. If we set δ < 0.6, all edge nodes can be absorbed into one neigh-bor community, as seen in the Fig. 5(b). Fortunately, the modified partition of dolphins is consist with the natural partition completely.
4.3 Comparison with other community detection methods
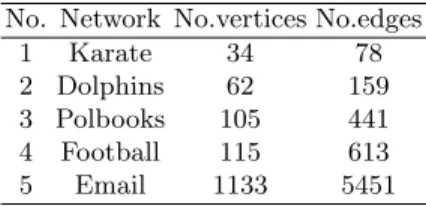
In this section, we compare our MCLC algorithm with CPM [22], Link [25] and UEOC [41] algorithms on the five real-world networks listed in Table 2.
Table 2.Five real-world networks
No. Network No.vertices No.edges
1 Karate 34 78
2 Dolphins 62 159
3 Polbooks 105 441 4 Football 115 613
5 Email 1133 5451
Here we choose the overlapping modularityQov [42], an extension of
modu-larity Q[43], to test community structure. It is defined as following:
Qov= 1 2m X l X {i,j}∈Cl 1 OiOj aij− kikj 2m (12)
where mrepresents the number of edges in the network,Oi(Oj) represents the
number of communities to which vertexi(j) belongs,aij is the element of
adja-cency of the networkki(kj) is the degree of vertexi(j).
Overlapping modularity Qov is an extension of modularity Q, which is the
fraction of the edges that fall within the given groups minus the expected such fraction if edges were distributed at random, and it have considered the influence of overlapping nodes. If each vertexisatisfiedOi= 1 , namely each vertex only
belong to one community, thenQov will reduce to modularityQ.
We have made many experiments on these five real networks, and compared the maximum Qov with different algorithms. To reduce the time cost, we set
T = 1 andδ= 0.5. From Fig. 6, the results of MCLC are very good among those methods, and it is the best on the four real world networks except Football.
Karate0 Dolphins Polbooks Football Email 0.1 0.2 0.3 0.4 0.5 0.6 0.7 0.8 0.9 1 Networks Q ov MCLC UEOC CPM Link
5
Conclusion
The MCLC algorithm, which can detect the overlapping community structure of complex networks, is proposed in this paper. First, it should generate the weighted line graph from the original network graph. Next, set M members walk on the line graph randomly. After walkT steps, and calculate the distance between links. Then the average-linkage method is adopted for producing the link partition. At last, we assign the edge nodes between link communities to neighboring communities by setting the threshold of attraction intensity. Results of the experiments on synthetic networks and the real-world networks are very good and validate the efficiency of the proposed algorithm. Comparing with some other algorithms, our method is as good as or even better. However, we have not done the experiments on the larger scale networks due to the limitation of devices, and the time complexity is higher than expected, which may be improved in the future.
Acknowledgments
The author gratefully acknowledges support from National Natural Science Foun-dation of China projects of grant No. 61272149, 61379058, 61379057, 61350011, JSPS A3 Foresight Program, and JSPS KAKENHI Grant Number 26730056, 15K15976.
References
1. Strogatz, S.H.: Exploring complex networks. Nature 410(6825), 268–276 (2001) 2. Albert, R., Barab´asi, A.L.: Statistical mechanics of complex networks. Reviews of
modern physics 74(1), 47 (2002)
3. Newman, M.E., Girvan, M.: Finding and evaluating community structure in net-works. Physical review E 69(2), 026113 (2004)
4. Radicchi, F., Castellano, C., Cecconi, F., Loreto, V., Parisi, D.: Defining and iden-tifying communities in networks. Proceedings of the National Academy of Sciences of the United States of America 101(9), 2658–2663 (2004)
5. Rosvall, M., Bergstrom, C.T.: Maps of random walks on complex networks reveal community structure. Proceedings of the National Academy of Sciences 105(4), 1118–1123 (2008)
6. Mianxiong, D., Kimata, T., Sugiura, K., Zettsu, K.: Quality-of-experience (qoe) in emerging mobile social networks. IEICE TRANSACTIONS on Information and Systems 97(10), 2606–2612 (2014)
7. Ping, Y., Cao, Z., Zhu, H.: Sybil-aware least cost rumor blocking in social networks. In: Global Communications Conference (GLOBECOM), 2014 IEEE. pp. 692–697. IEEE (2014)
8. Li, M., Zhu, H., Gao, Z., Chen, S., Yu, L., Hu, S., Ren, K.: All your location are belong to us: Breaking mobile social networks for automated user location tracking. In: Proceedings of the 15th ACM international symposium on Mobile ad hoc networking and computing. pp. 43–52. ACM (2014)
9. Zhu, H., Lin, X., Lu, R., Fan, Y., Shen, X.: Smart: A secure multilayer credit-based incentive scheme for delay-tolerant networks. Vehicular Technology, IEEE Transactions on 58(8), 4628–4639 (2009)
10. Du, S., Zhu, H., Li, X., Ota, K., Dong, M.: Mixzone in motion: achieving dynami-cally cooperative location privacy protection in delay-tolerant networks. Vehicular Technology, IEEE Transactions on 62(9), 4565–4575 (2013)
11. Zhu, H., Du, S., Gao, Z., Dong, M., Cao, Z.: A probabilistic misbehavior detection scheme toward efficient trust establishment in delay-tolerant networks. Parallel and Distributed Systems, IEEE Transactions on 25(1), 22–32 (2014)
12. Tao, J., Tan, C., Zhang, Z., He, J., Xu, Y.: Opportunistic forwarding based on the weighted social characteristics in msns. In: Communications (ICC), 2015 IEEE International Conference on. pp. 6318–6323. IEEE (2015)
13. Wang, T., Chen, Z., Li, K., Deng, X., Li, D.: Memory does not necessarily promote cooperation in dilemma games. Physica A: Statistical Mechanics and its Applica-tions 395, 218–227 (2014)
14. Jonsson, P.F., Cavanna, T., Zicha, D., Bates, P.A.: Cluster analysis of networks generated through homology: automatic identification of important protein com-munities involved in cancer metastasis. BMC bioinformatics 7(1), 2 (2006) 15. Krause, A.E., Frank, K.A., Mason, D.M., Ulanowicz, R.E., Taylor, W.W.:
Com-partments revealed in food-web structure. Nature 426(6964), 282–285 (2003) 16. Piccardi, C., Calatroni, L., Bertoni, F.: Communities in italian corporate networks.
Physica A: Statistical Mechanics and its Applications 389(22), 5247–5258 (2010) 17. Fortunato, S.: Community detection in graphs. Physics Reports 486(3), 75–174
(2010)
18. Kernighan, B.W., Lin, S.: An efficient heuristic procedure for partitioning graphs. Bell system technical journal 49(2), 291–307 (1970)
19. Pothen, A., Simon, H.D., Liou, K.P.: Partitioning sparse matrices with eigenvectors of graphs. SIAM Journal on Matrix Analysis and Applications 11(3), 430–452 (1990)
20. Hastie, T., Tibshirani, R., Friedman, J., Franklin, J.: The elements of statistical learning: data mining, inference and prediction. The Mathematical Intelligencer 27(2), 83–85 (2005)
21. Blondel, V.D., Guillaume, J.L., Lambiotte, R., Lefebvre, E.: Fast unfolding of communities in large networks. Journal of Statistical Mechanics: Theory and Ex-periment 2008(10), P10008 (2008)
22. Palla, G., Der´enyi, I., Farkas, I., Vicsek, T.: Uncovering the overlapping community structure of complex networks in nature and society. Nature 435(7043), 814–818 (2005)
23. Lancichinetti, A., Fortunato, S., Kert´esz, J.: Detecting the overlapping and hier-archical community structure in complex networks. New Journal of Physics 11(3), 033015 (2009)
24. Wang, X., Jiao, L., Wu, J.: Adjusting from disjoint to overlapping community de-tection of complex networks. Physica A: Statistical Mechanics and its Applications 388(24), 5045–5056 (2009)
25. Ahn, Y.Y., Bagrow, J.P., Lehmann, S.: Link communities reveal multiscale com-plexity in networks. Nature 466(7307), 761–764 (2010)
26. Havemann, F., Heinz, M., Struck, A., Gl¨aser, J.: Identification of overlapping com-munities and their hierarchy by locally calculating community-changing resolution levels. Journal of Statistical Mechanics: Theory and Experiment 2011(01), P01023 (2011)
27. Xie, J., Szymanski, B.K.: Towards linear time overlapping community detection in social networks. In: Advances in Knowledge Discovery and Data Mining, pp. 25–36. Springer (2012)
28. Dickinson, B., Valyou, B., Hu, W.: A genetic algorithm for identifying overlapping communities in social networks using an optimized search space. Social Networking 2013 (2013)
29. Mu, C., Liu, Y., Liu, Y., Wu, J., Jiao, L.: Two-stage algorithm using influence coefficient for detecting the hierarchical, non-overlapping and overlapping commu-nity structure. Physica A: Statistical Mechanics and its Applications 408, 47–61 (2014)
30. Evans, T., Lambiotte, R.: Line graphs, link partitions, and overlapping communi-ties. Physical Review E 80(1), 016105 (2009)
31. Pons, P., Latapy, M.: Computing communities in large networks using random walks. J. Graph Algorithms Appl. 10(2), 191–218 (2006)
32. Deng, X., Li, G., Dong, M.: Finding overlapping communities with random walks on line graph and attraction intensity. In: Wireless Algorithms, Systems, and Ap-plications, pp. 94–103. Springer (2015)
33. Van Dongen, S.: Graph clustering by flow simulation. University of Utrecht (2014) 34. Yang, B., Cheung, W.K., Liu, J.: Community mining from signed social networks. Knowledge and Data Engineering, IEEE Transactions on 19(10), 1333–1348 (2007) 35. Steinhaeuser, K., Chawla, N.V.: Identifying and evaluating community structure
in complex networks. Pattern Recognition Letters 31(5), 413–421 (2010)
36. Lancichinetti, A., Fortunato, S., Radicchi, F.: Benchmark graphs for testing com-munity detection algorithms. PHYSICAL REVIEW E 78(4, 2) (OCT 2008) 37. Lancichinetti, A., Fortunato, S.: Benchmarks for testing community detection
algo-rithms on directed and weighted graphs with overlapping communities. PHYSICAL REVIEW E 80(1, 2) (JUL 2009)
38. Danon, L., Diaz-Guilera, A., Duch, J., Arenas, A.: Comparing community struc-ture identification. JOURNAL OF STATISTICAL MECHANICS-THEORY AND EXPERIMENT (SEP 2005)
39. Zachary, W.W.: An information flow model for conflict and fission in small groups. Journal of anthropological research pp. 452–473 (1977)
40. Lusseau, D., Schneider, K., Boisseau, O.J., Haase, P., Slooten, E., Dawson, S.M.: The bottlenose dolphin community of doubtful sound features a large proportion of long-lasting associations. Behavioral Ecology and Sociobiology 54(4), 396–405 (2003)
41. Jin, D., Yang, B., Baquero, C., Liu, D., He, D., Liu, J.: A markov random walk under constraint for discovering overlapping communities in complex networks. Journal of Statistical Mechanics: Theory and Experiment 2011(05), P05031 (2011) 42. Shen, H., Cheng, X., Cai, K., Hu, M.B.: Detect overlapping and hierarchical com-munity structure in networks. Physica A: Statistical Mechanics and its Applications 388(8), 1706–1712 (2009)
43. Newman, M.E.: Fast algorithm for detecting community structure in networks. Physical review E 69(6), 066133 (2004)