DISCUSSION PAPERS IN ECONOMICS
Working Paper No. 00-16The Appeal of Voluntary Environmental Programs: Which Firms Participate and Why
(Revision of Working Paper No. 99-15)
Julio Videras
Department of Economics, University of Colorado at Boulder Boulder, Colorado
Anna Alberini
Department of Agricultural and Resource Economics, University of Maryland College Park, MD
October 2000
Center for Economic Analysis
Department of Economics
University of Colorado at Boulder Boulder, Colorado 80309
THE APPEAL OF VOLUNTARY ENVIRONMENTAL PROGRAMS:
WHICH FIRMS PARTICIPATE AND WHY?
JULIO VIDERAS AND ANNA ALBERINI*
Why do firms participate in EPA’s voluntary environmental programs? Possible reasons include: (i) to appeal to consumers who demand “green” products; (ii) to preempt government regulation; (iii) to seek regulatory relief from the agency; and (iv) to gain a competitive advantage over competitors. We examine the determinants of participation in voluntary environmental programs, focusing on testing hypotheses (i), and (iii). To test (ii), we use a different approach than in previous literature. We focus on a specified universe of firms (manufacturing firms in the Standard and Poor 500), and analyze their participation in each of three EPA voluntary programs (33/50, Green Lights and WasteWi$e) referring to differently regulated pollutants. Our empirical analyses reveal that (i) publicity is an important component of participation; (ii) the worse the environmental track record of the firm, the more likely is the firm to participate, but only in programs directly related to highly regulated pollutants; and that (iii) firms which scrutinize their environmental performance more carefully are wary of newer programs with uncertain reach of the public and uncertain benefits. Firms appear to value the information/technology transfer aspect of joining a program.
I. INTRODUCTION
In the early 1990s, the U.S. Environmental Protection Agency (EPA) initiated an alternative approach to environmental regulation based on voluntary pollution prevention programs. There are currently over a dozen voluntary environmental programs, and thousands of
participating firms. These programs cover pollutants subject to regulations with different degree of stringency, and differ widely in their specific goals and requirements.
The success of voluntary environmental programs depends crucially on the programs’ appeal to firms. While EPA traditionally emphasizes the publicity aspect of participation and the benefits of shared information about energy use or emissions reduction practices, earlier studies have proposed a number of other reasons for firms to join. These include: (i) to appeal to consumers who demand “green” products, and are willing to pay more for them (Arora and Gangopadhyay, 1995; Arora and Cason, 1995, 1996; Khanna and Damon, 1999); (ii) to preempt government regulation (Segerson and Miceli, 1998; Maxwell et al, 1998); (iii) to seek regulatory or compliance relief from the agency by showing the agency that the company has improved its environmental performance (or intends to); and (iv) to gain a competitive advantage over competitors.
In this paper, we examine the determinants of participation in voluntary environmental programs, focusing on testing hypotheses (i) and (iii). We also examine hypothesis (ii), the effect of the voluntary programs’ regulatory stringency and the visibility of firm participation to regulators (and consumers), but in a different sense than in previous literature. Rather than focusing on one program, and controlling for the regulatory background of the industry the firm belongs to (as in Arora and Cason (1996)), we focus on a specified universe of firms (manufacturing firms among the large, publicly traded companies in the Standard and Poor 500), and analyze participation of these firms in each of three EPA voluntary programs covering differently regulated pollutants.
We proceed in this manner in order to separate the effect of the firm’s environmental performance (hypothesis (iii)) from the impact of the program’s regulatory background (hypothesis (ii)). In addition, this approach allows us to capture the importance of certain
aspects of the program, such as its age and prestige, by “exposing” the same firm to three different programs, 33/50, Green Lights and WasteWi$e. This paper also differs from previous literature in that we control for corporate concern for environmental performance.
Using data at the firm level from the Investor Responsibilities Research Center (IRRC) and Compustat, we fit several variants of probit models of participation. We find that (i) publicity is an important component of participation; (ii) the worse the environmental track record of the firm, the more likely is a firm to participate, but only in programs directly related to highly regulated pollutants; and that (iii) firms which scrutinize their environmental performance more carefully are wary of newer programs with uncertain benefits. We also find some evidence broadly consistent with the notion that firms value the information and technology transfer aspect of joining a program.
The remainder of the paper is organized as follows. Section 2 reviews the theoretical and empirical literature on self-regulation and environmental programs. Section 3 describes 33/50, Green Lights and WasteWi$e. We describe our data in section 4. In section 5 we present the econometric models, and in section 6 the choice of independent variables. Section 7 presents the results, and section 8 concludes.
II. THEORETICAL AND EMPIRICAL MODELS OF ENVIRONMENTAL SELF-REGULATION
Possible reasons why firms join voluntary environmental programs include: (i) to appeal to consumers who demand “green” products; (ii) to preempt government regulation; (iii) to seek regulatory or compliance relief from the agency, by showing the agency that they have improved their environmental performance (or intend to); and (iv) to gain a competitive advantage over competitors.
The first reason is modeled in Arora and Gangopadhyay (1995), using a model of vertical differentiation in which consumers have different marginal rates of substitution between income and quality. This results in environmental quality differentiation, with one firm overcomplying to attract wealthier consumers. Arora and Cason (1995, 1996) and Khanna and Damon (1999) indeed find that proximity to final consumers is a significant predictor of participation.
Preemption as a factor for environmental overcompliance is theoretically explored in Maxwell et al. (1998) who explain voluntary pollution abatement as a response to the threat of environmental regulation. Their results show that, under certain conditions, a stronger threat of regulation is expected to induce firms to self-regulate. In Segerson and Miceli (1998) the level of abatement under a voluntary program is directly related to the probability of the threat. The main positive implication from the Maxwell et al., and Segerson and Miceli’s models is that implementation and success of a voluntary agreement depend on the strength of the legislative threat. As a result, one would expect a weaker response to programs with looser regulatory background.
The empirical evidence is mixed for hypothesis (iii), that firms join environmental programs to obtain compliance or regulatory relief from the agency. Arora and Cason (1996) find that fines charged to firms for past violations of the Clean Air Act do not affect the likelihood of participation in 33/50, but Khanna and Damon (1999) report that chemical firms with a history as responsible parties at Superfund sites are more likely to participate in 33/50. (Khanna and Damon present their result as supporting hypothesis (ii)).
Finally, other streams of literature have examined the importance of corporate social and environmental concerns in setting environmental performance goals. Winn (1995) concludes that the incentives for self-regulation originate within the organization. Henriques and Sardosky
(1996) empirically test the impact of internal and external pressures on a firm’s responsiveness to environmental issues.
To sum, these arguments suggest that empirical models of firm participation in EPA’s voluntary programs should control for proximity to consumers, stringency of the regulatory background affecting firm operation, firm compliance record and environmental culture. As suggested by DeCanio and Watkins (1998), company size, profitability, and ability to innovate may also influence firm participation.
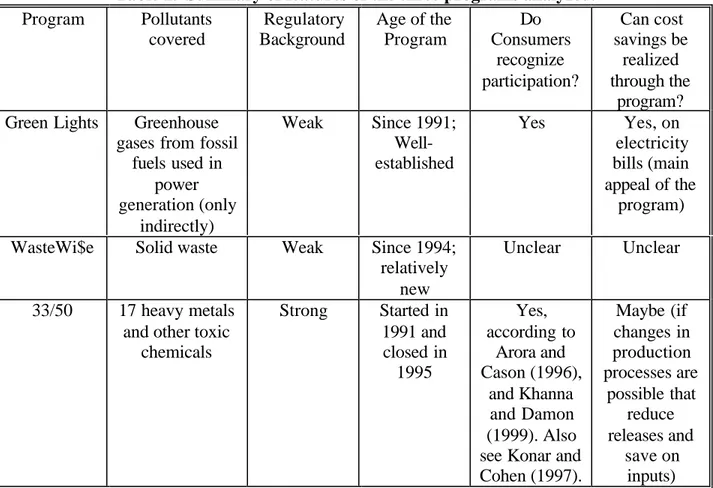
In this paper we report the results of empirical analyses of firm participation in voluntary programs that do control for these factors and specifically examine hypotheses (i) and (iii). We also examine the effect of the environmental regulatory background a firm is faced with (hypothesis (ii)), but in a different sense than in earlier literature: Specifically, we separately analyze participation in three environmental programs (33/50, Green Lights, and WasteWi$e) that differ by their more or less recent implementation and widespread recognition, and by their coverage of pollutants with very different regulatory background. While 33/50 deals with highly regulated substances/wastes, the latter two programs address forms of pollution that have traditionally relied on voluntary abatement, rather than mandatory measures. Green Lights and 33/50 are well-established programs, whereas WasteWi$e is relatively new and less known to consumers. Our separate analyses therefore attempt to find out if the attributes of these programs appeal to different types of firms. The main features of these programs are summarized in table 1, and the specifics are described in the next section.
III. THREE VOLUNTARY PROGRAMS
WasteWi$e was conceived in 1992 by the Office of Solid Waste and Emergency Response. The program was launched January 1, 1994, and seeks to reduce solid waste such as
office paper, corrugated containers, yard trimmings and packaging. Participants commit to identify cost-effective opportunities, establish waste prevention, reduction and recycling goals and update EPA on their accomplishments annually. Nearly 370 companies, located nationwide and representing a broad variety of industrial sectors, joined the program in 1994 (EPA, 1995).
Green Lights was launched in 1991. It aims to optimize energy efficiency in lighting systems in businesses and organizations in order to reduce greenhouse gas emissions. Participants agree to survey 100 percent of their facilities, and to upgrade 90 percent of the square footage that can be upgraded without compromising profitability and lighting quality. Participants must select the option that yields an internal rate of return of 20 percent or higher. In return the EPA provides technical expertise, information on the availability of sources of financing, information provided by other participants and allies, and publicity materials. As of 1998, over 2500 partners had reduced their energy use by 4.7 billion-kilowatt hours, saving annually more than $341 million.
The EPA launched 33/50 in February of 1991. The goal of this program was the aggregate reduction of releases and transfers of 17 chemicals by 33 percent in 1992 and by 50 percent in 1995, relative to baseline 1988 levels. The 33/50 chemicals were selected on the basis of toxicity, volume of industrial use and potential for reduction through pollution prevention. This program was implemented in different waves, with EPA inviting firms in the initial waves, and then opening up participation to other qualifying firms in later waves. Once 1995 data revealed 33/50 accomplished its goals, the program ended with 1300 recognized partners.
IV. THE DATA
The data we use in our empirical analyses was collected by the Investors Responsibility Research Center (IRRC) from assorted sources, including direct surveys and EPA databases. The
IRRC dataset documents the environmental performance of Standard & Poor 500, US-based firms over the years 1992-1998. Among other things, firms were queried about whether they (i) use environmental performance as a factor in senior or operating management compensation; (ii) consider environmental risks in its selection of contractors, business partners and clients; (iii) publish an environmental report; and (iv) conduct environmental audits. Details about participation in voluntary environmental programs, recycling and emissions were also obtained.
In practice, 255 of the S&P 500 companies regularly returned IRRC’s annual mail survey. IRRC supplemented the responses provided by these firms with quantitative information on compliance with environmental statutes and on measures of environmental performance obtained from EPA databases. We merged the IRRC dataset with company-level variables contained in Standard & Poor’s Compustat, such as number of employees, expenditure on research and development (R&D), and sales.
V. ECONOMETRIC MODELS
We assume the participation decision in a voluntary program depends on the perceived discounted net benefits from participation, yi*. The ith firm’s net benefit is expressed as:
(1) yi* =xiβ +εi
where x is a vector of independent variables, β is a vector of coefficients, and ε is an error term that follows the standard normal distribution.
Perceived net benefits are not directly observed. Instead, an indicator yi takes on a value of one if the firm participates in the program, and zero otherwise. Since the firm is assumed to participate in the program only if the net benefits of doing so are greater than zero, this leads to a probit model of participation.
In practice, we need to pay attention to three potential problems. The first is that fitting probit models to the IRRC data is appropriate only if a firm’s filling out and returning of the IRRC questionnaire is unrelated to its participation in a program. If the sample is affected by a selection bias, the standard probit coefficients will be biased. To address the selection bias problem, we assume that participation in the IRRC survey is driven by another unobservable variable, ri*, i.e., propensity to answer the survey questions:
(2) ri* =ziγ +νi .
The error term νi is normally distributed with mean zero and variance equal to 1, and is
allowed to be correlated with the error term ε of equation (1), as is appropriate if the same unobserved firm-specific factors influencing participation in the program also prompt the firm to agree to participate in the survey. The vector z includes variables thought to influence propensity to respond to the survey, such as firm size, R&D, and financial strength.
The IRRC data and the participation decision are observable only when ri* >0 (ri =1),
implying that the appropriate statistical framework is a bivariate probit model with a sample selection correction. The log-likelihood for year t is:
(3)
∑
∑
[
]
∑
[
]
= = = = = Φ − + Φ − Φ + Φ = 0 0 , 1 1 , 1 ) ( 1 ln ) , , ( ) ( ln ) , , ( ln log r i y r i i i y r i i t L zγ x β ρ z γ zγ x β ρ z γwhere Φ(•,•,ρ) denotes the bivariate standard normal cdf with coefficient of correlation equal to ρ. If consecutive years of observations are assumed to be independent, the log-likelihood for each of the programs under investigation is:
(4)
∑
= = T t t L L 1 log log .The second problem is that, whether or not sample selection bias exists, unobserved firm-specific factors influencing participation in one program may also influence the decision to participate in another program. This suggests that we should experiment with and test the appropriateness of trivariate probit models of participation in the three programs.
Finally, since our dataset has the structure of a panel, whenever possible we incorporate random effects to help account for a firm’s tendency to remain in a program, once it has decided to adhere to it, or to never join it.i We also experiment with a likelihood function in which a firm is deleted from the usable sample after it has joined the program.
VI. WHAT INFLUENCES PARTICIPATION IN A VOLUNTARY PROGRAM?
A. Firm and Industry Characteristics
The EPA emphasizes that voluntary programs offer public recognition for outstanding achievements, and allows partners to use the program logo in their own promotion and advertising. This is expected to benefit companies that are close to consumers. A dummy that takes on the value of one if the firm produces consumer goods controls for this effect.
Larger firms may be more likely to participate because they are more visible or are industry leaders. We use the number of employees to measure firm size. The better the financial position of the firm, the more likely it will be able to sustain the costs associated with participation. We experimented with various measures of firm financial performance. In this paper we report results based on previous year increase in sales, but similar results are obtained when other measures are used.
It is also reasonable to include recent R&D expenditures, normalized by employees, among the predictors of participation. The sign of the coefficient of this variable is uncertain a priori. On the one hand, one might expect innovative firms to be more likely participants,
because they may be more able to identify opportunities for reducing pollutants, and adopt newer production processes at a lower cost. On the other hand, firms with more limited innovative ability might use the program to absorb pollution abatement information and technologies divulged by other participating firms or by the agency.
Finally, we include among the predictors dummies for different industrial groups to proxy for industry-specific characteristics (such as pollution intensity and regulatory burden), and the industry’s increase in sales.
B. Corporate Environmental Culture
Winn (1995) and Henriques and Sardosky (1996) emphasize the importance of social corporate culture within a firm to explain firm sensitivity to environmental issues. In contrast to these authors, who capture corporate attitudes towards environmental issues, we include actual environmental practices conducted by the firms, since attitudes are not available in our dataset.
We include dummies for whether (i) the firm publishes environmental reports, (ii) conducts environmental auditing programs, (iii) regards environmental performance as a factor in senior and manager compensation, and (iv) considers environmental risks to select business partners, suppliers and customers.
C. Environmental Performance and Regulatory Background
It has been suggested (Arora and Cason, 1996) that firms with poor environmental compliance records may join voluntary environmental programs in hopes of obtaining relief from the EPA. If this hypothesis is correct, firms with poor environmental performance may be more likely to participate in a voluntary program. Furthermore, this effect is expected to be stronger the stricter the program’s regulatory background (Maxwell et al., 1998, and Segerson and Miceli,
1999). To test these hypotheses, we include among the independent variables in the program participation equations measures of environmental performance chosen among those most closely related to the program under investigation.
VII. RESULTS
Our regressions focus on 218 manufacturing firms among the S&P 500 companies, followed over 1993-98. Among these companies, the participation rate in 33/50 is 56 percent, 31 percent in Green Lights, and 34 percent for WasteWi$e. Clearly, not even among the large corporations that constitute the S&P 500 universe is participation in a voluntary pollution abatement program unanimous. The results of the bivariate probit model with selection (equation (4); results not reported) suggest that completion of the IRRC questionnaire is more likely among the larger firms of the Standard and Poor 500 group and among those firms that produce consumer goods. This is likely to be related to the firm’s desire to maintain a favorable public image, to the extent that consumers and investors may consult the IRRC data.
Surprisingly, the correlation coefficient ρ between the survey participation and program participation decisions was not statistically significant, which suggests that for each program the likelihood function (4) can be separated out into two independent probit models, and that attention can be restricted to the determinants of participation in the program, without having to correct for participation in the survey.
Tables 2-4 present the results for participation in WasteWi$e, Green Lights, and 33/50, respectively, based on independent probit models. The specification in column (A) includes firm characteristics such as size, R&D expenditures, proximity to consumers, a measure of financial strength, industry dummies, and sales in the industry the firm belongs to. Column (B) adds variables proxying for environmental performance and compliance with environmental
regulation. Column (C) replace the latter two sets of variables with other variables describing the firm’s environmental practices, and, finally, (D) is the broadest model, which includes the sets of variables examined in (A) through (C).
A. Participation in WasteWi$e
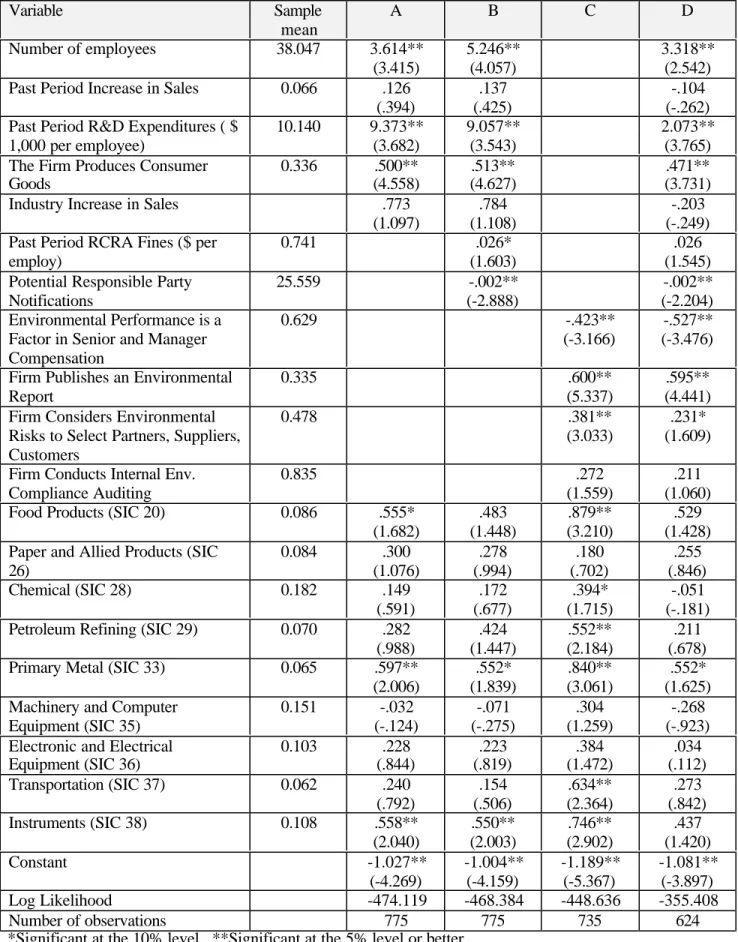
As shown in Table 2, column (A), larger firms are more likely to join WasteWi$e. However, participation in this program is not significantly affected by any of the financial health variables we experimented with. As expected, whether the firm produces consumer goods is a strong predictor of participation in WasteWi$e, increasing the likelihood of participation of the representative firm by 17 percent, all else equal. Finally, firms with greater R&D expenditures are also more likely to participate in WasteWi$e. The marginal effect of this variable is such that if we raise R&D per employee by one standard deviation above the sample average, the probability of participating would grow by 4.78 times, holding all else unchanged.
With WasteWi$e, it is difficult to identify measures of firm environmental performance that relate directly to reduction of office and yard waste, and re-packaging of products. Since our dataset lacks information about the quantity of solid waste and recyclables, we include in the regression of column (B) variables related to the firm’s generation of hazardous waste: the number of sites at which the firm has been nominated PRP under the Superfund legislation, and the fines charged to the firm for violations of the RCRA hazardous waste regulations. Here, we reason that firms that have been involved with disposal of hazardous waste in the past, and are currently generating hazardous wastes, might pay particular attention to recycling and reduction of non-hazardous waste as well. These variables also serve as general measure of firm “greenness,” and/or concern about future regulatory pressures.
The coefficient of the sites at which the firm is a PRP is negative and significant. We were somewhat surprised by this result. It is possible that firms with a negative environmental track record (heavy involvement at hazardous waste sites) shun WasteWi$e, which they may see as neither improving their image nor promoting any actual pollution reductions. On the other hand, fines for violations of the RCRA law increase the likelihood of participation, a finding that is consistent with the hypothesis that firms join voluntary programs to improve their environmental image. However, both Superfund sites and penalty effects are small, and meaningful only for the most serious “offenders.”ii
Perhaps the most thought-provoking results are those shown in column (C). The coefficient of the dummy for whether an environmental report is published by the company is positive, and statistically significant. Its magnitude implies that the average firm is 23 percent more likely to participate if it does publish an environmental report. Environmental reports are intended for the public and investors, rather than for the firm’s internal use, suggesting that willingness to look good in the eyes of the public and investors provides a strong motivation to join a voluntary program.
We were surprised to note the negative association between compensation of upper management based on environmental performance and the likelihood of participation. However, conversations with EPA officials revealed that EPA does not regard participation in voluntary programs per se as a sign of good environmental performance. If the firm managers are aware of that, they may find joining WasteWi$e less attractive or useful, and they may prefer to concentrate on other goals, such as genuine emissions reductions. This provides further support for our explanation for the negative sign of the coefficient of the PRP variable.
When the model is re-run to include a dummy for the previous year’s participation in WasteWi$e (a simple way to account for the firm’s tendency to remain in the program after
joining it), the coefficient of most variables retain their signs and significance. Qualitatively similar results are seen when the likelihood function is modified to include only those firms who have not already joined the program in previous years. We also fitted random effects probit models (which allow for unobserved heterogeneity) following the specifications reported in table 3, with similar results.
B. Participation in Green Lights
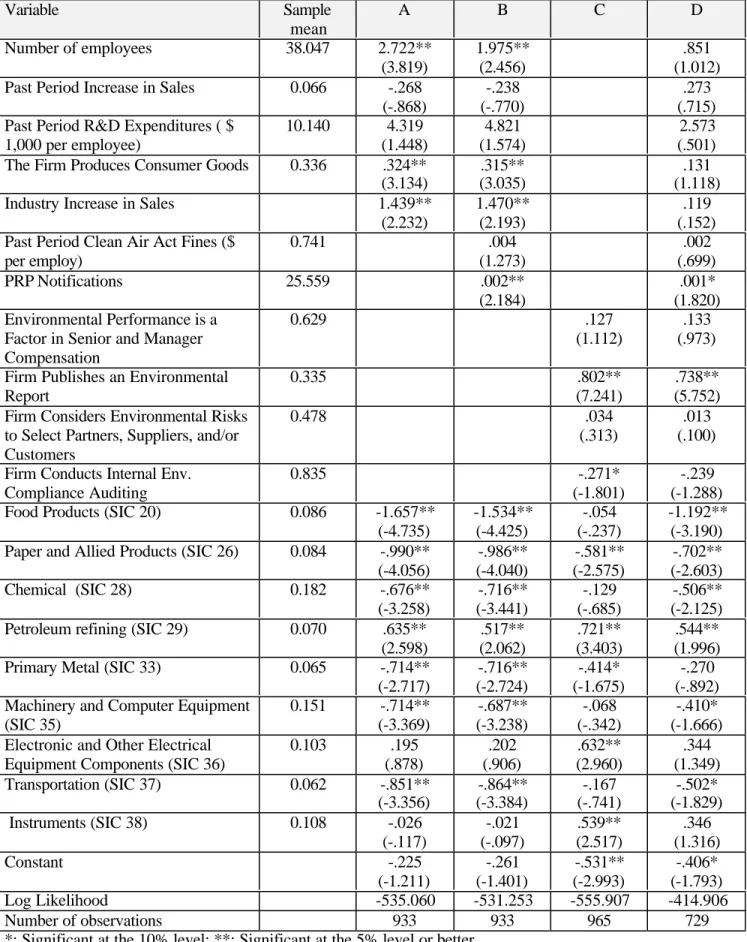
Table 4 presents the results for participation in Green Lights from 1993 to 1998. Column (A) shows that among the variables related to firm size and financial performance, only firm size, measured as the number of employees, is related to participation in this program. Specifically, the more numerous the employees, the more likely is the firm to join the program.
For lack of a better alternative, in specification (B) we include fines assessed to the firm for violations of the Clean Air Act requirements (since Green Lights seeks to reduce the use of electricity, and hence emissions of greenhouse gases by power plants), but we find no evidence of a correlation between these fines and the likelihood of joining Green Lights. We also experimented with other variables measuring environmental performance, reasoning that firms may join the program simply to improve their environmental image, even though the program in question does not specifically address the type of pollution they create, but to no avail.
When attention is restricted to the dummy variables capturing environmental practices (Column (C)), the coefficient for whether environmental performance is a factor in senior manager compensation is positive but insignificant. However, firms that publish an environmental report are more likely to join Green Lights, raising the likelihood of participation by a representative firm by 29 percent (holding all else equal). This further confirms that public
recognition is an important predictor of participation in a voluntary program and firm management might feel under pressure to join for the reputation effects.
C. Participation in 33/50
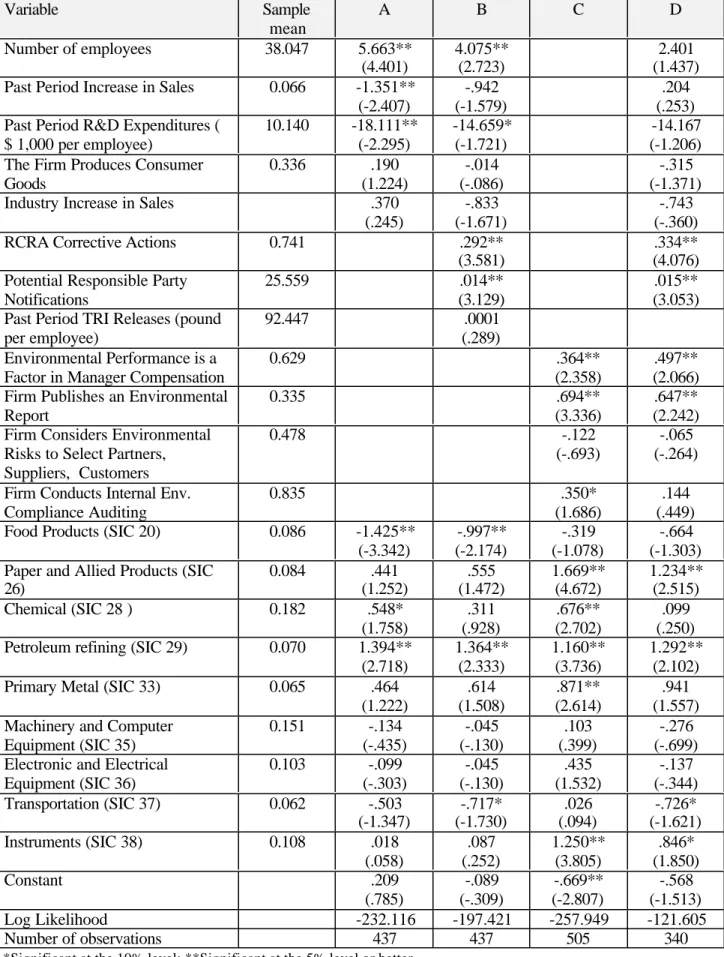
Table 5 reports the results of regressions explaining participation in 33/50. Column (A) shows that, once again, larger firms are more likely to join, and that firms who have recently incurred R&D expenditures are less attracted into the program. The latter result is broadly consistent with the possibility that firms that are less capable of innovating on their own might join in hopes of learning to reduce emissions from others. This interpretation also supports Khanna and Damon’s finding that firms with older equipment are more likely to join 33/50.
In (B) we include measures of environmental performance, such as number of PRP nominations, corrective actions under RCRA, and TRI releases per employee. The former two variables are positively and significantly related to the likelihood of participating in the program, while the latter is insignificant (and is thus omitted from specification (D)). On the whole, big polluters would thus seem more likely to join 33/50.
We do not find that firms that produce consumer goods are more likely 33/50 participants, not even when attention is restricted to firms in the chemical sector. This result is in contrast with the Khanna and Damon (1999) findings. Perhaps this is due to the fact that Khanna and Damon explain participation for 1991-93, while we cover the years 1993-95, once the success of the program seemed secure and factors as technology transfers might have weighted more than publicity on the decision to participate and stay in the program.
Finally, of the variables measuring actual environmental practices, the coefficient of the dummy for whether the company publishes an environmental report is positive and significant. Furthermore, the coefficient for whether environmental performance is a factor in compensation
is positive and significant at the 5 percent level. This is in sharp contrast with the result for WasteWi$e. The difference is probably due to the broad endorsement and established reputation of 33/50.
D. Additional econometric issues
The results from the trivariate probit model (in which each participation indicator is a treated as a dependent variable in a system, and is allowed to be potentially correlated with the other two indicators) suggest that it is acceptable to model the decisions to participate in 33/50, Green Lights, and WasteWi$e as independent. The correlation coefficients between the programs are low and not significant at the conventional levels. In particular, the correlation between 33/50 and Green Lights was estimated to be .241, that between 33/50 and WasteWi$e 0.078, and that between Green Lights and WasteWi$e –0.003.
Of more concern is the possibility that the dummies capturing aspects of corporate environmental culture or activities might be endogenous with the dependent variables. Addressing this concern requires developing instruments for the mentioned activities, and implementing a two-stage estimation procedure (with a correction for the heteroskedasticity thus introduced). We considered several firm characteristics and past environmental performance as candidate instruments, but were disappointed to see that only number of employees was significantly (and positively) correlated with the dummies for the environmental culture practices. The quality of the prediction for each dummy variable was too poor for us to continue with our planned procedure. To sum, since it is difficult to find good instruments for the adoption of corporate environmental practices, we leave these indicators in the right-hand side of the probit equations for participation in the EPA programs, and continue to interpret the coefficients
of these dummies in the usual way, although we recognize that the true coefficients might be of greater absolute magnitude if one were able to remedy the endogeneity problem.
VIII. CONCLUSIONS
To examine the importance of different factors leading to participation in voluntary environmental programs, we have estimated models of participation in 33/50, Green Lights and WasteWi$e, three EPA programs that differ widely with respect to the reputation of the program, and the stringency of the regulations for the pollutants they address. The firms we examine belong to the Standard and Poor 500, and we check for possible sample selection bias and dependence among participation decisions.
Our results suggest that the possible publicity from joining a voluntary program is an important determinant of participation. Larger, and presumably more visible to consumers and regulator, firms are systematically more likely to join, regardless of the pollutant addressed by the program and the stringency of the regulations for that pollutant. In addition, firms who wish to show consumers about their environmental performance progress, and do so by publishing environmental reports, are typically more likely to join.
Our analysis suggests that although the publicity aspect of participation is highly valued, firms privately might be skeptical about the true impact on participation on their environmental performance. Firms that use environmental performance as one of the criteria for establishing manager compensation are less likely to participate in WasteWi$e, a program that deals with solid waste and recyclables, but does little in terms of the more pressing generation of hazardous waste and emissions into air and water. The opposite effect (very strong) is seen for 33/50, a program that does seek reductions in the releases and transfers of toxics, and (in a weak form) for Green Lights, probably because of the energy conservation emphasis of the latter.
There is some evidence suggesting that some of the attractiveness of voluntary programs may lie in their “technology transfer” potential. Especially for 33/50, the older and better established program, firms with lower R&D expenditure per employee are more likely to join, perhaps because they hope to learn emissions-reducing practices from other firms or from the agency. This is consistent with Khanna and Damon’s finding that firms with older equipment make more likely candidates for 33/50. By contrast, the least established program among those we examine (WasteWi$e) elicits participation with more success among firms with greater R&D expenditures.
Finally, it appears that firms with worse performance are attracted to voluntary programs, but only as long as the program is directly related to their own pollution reductions. This is broadly consistent with the predictions of Maxwell et al., and with Segerson and Miceli’s hypothesis that a “stick-and-carrot” approach increases firm responsiveness to voluntary programs. Variables capturing firm environmental performance do influence the likelihood of participating in 33/50 and WasteWi$e, programs with an obvious environmental appeal, but were not important with Green Lights, where the link with environmental quality and performance is more remote and rewards from participation (savings on electricity bills) are more immediate. These results seem to confirm the hypothesis that firms are more likely to join a voluntary program the stricter the program’s regulatory background.
REFERENCES
Arora, Seema and Timothy N. Cason (1995), “An Experiment in Voluntary Environmental Regulation: Participation in EPA’s 33/50 Program,” Journal of Environmental Economics and Management, 28(3), 271-286.
______,(1996), “Why do Firms Volunteer to Exceed Environmental Regulations? Understanding Participation in EPA’s 33/50 Program,” Land Economics, 72(4), 413-432.
Arora, Seema and Shubhashis Gangopadhyay (1995), “Toward a theoretical model of voluntary overcompliance”, Journal of Economic Behavior and Organization, 28: 289 – 309.
DeCanio, Stephen J. and William E. Watkins (1998), “Investment in Energy Efficiency: Do the Characteristics of Firms Matter?” The Review of Economics andStatistics, 80(1): 95-107.
Henriques, Irene and Perry Sardosky (1996), “The Determinants of an Environmentally Responsive Firm: An Empirical Approach” Journal of Environmental Economics and Management, 30(3), 381-395.
Khanna, Madhu and Lisa A. Damon (1999), “EPA’s Voluntary 33/50 Program: Impact on Toxic Releases and Economic Performance of Firms,” Journal of Environmental Economics and Management, 37(1), 1-25.
Konar, Shameek, and Mark A. Cohen (1997), “Information as Regulation: The Effect of Community Right to Know Laws on Toxic Emissions,” Journal of Environmental Economics and Management, 32, 109-124.
Maxwell, John W., Lyon, Thomas P. and Steven C. Hackett (1998), “Self-Regulation and Social Welfare: The Political Economy of Corporate Environmentalism” Working Paper, Indiana University School of Business, Bloomington
Segerson, Kathleen and Thomas J. Miceli (1998), “Voluntary Environmental Agreements: Good or Bad News for Environmental Protection?”, Journal of Environmental Economics and Management, 36(2): 109 – 130.
U.S. Environmental Protection Agency (1995), WasteWi$e. First Year Progress Report. Office of Solid Waste and Emergency Response, EPA report EPA530-R-95-044, Washington, DC, September.
Winn, Monika I. (1995), “Corporate Leadership and Policies for the Natural Environment,” in Research in Corporate Social Performance and Policy. Sustaining the Natural Environment: Empirical Studies of the Interface Between Nature and Organizations, edited by D. Collins and Mark Starik, JAI Press, Greenwich, Conn.
* Julio Videras is a graduate student in the Department of Economics, University of Colorado at Boulder. Anna Alberini is an assistant professor in the Department of Agricultural and Resource Economics, University of Maryland. This is a revision of a paper presented at the 74th Annual Meeting of the Western Economic Association, July 8, 1999, in a session organized by Kenneth Richards, University of Indiana, and entitled “Canada and United States Environmental Policy: Voluntary Programs for Environmental Protection.” We wish to thank the Investors Responsibility Research Center (IRCC), from which we acquired our data. All opinions are ours and do not represent IRRC’s official views.
Videras: Graduate student, Economics Department, Campus Box 256, University of Colorado, Boulder. Phone: 303 492-6394, Fax 303 492-8960. E-mail: [email protected].
Alberini: Assistant professor, Department of Agricultural and Resource Economics, 2200 Symons Hall, University of Maryland, College Park, MD 20742. Phone 301 405-1267, Fax 301 314-9091. E-mail: [email protected].
i
In practice, amending the likelihood function (4) or the trivariate probit likelihood function to incorporate fixed or random effects is difficult. We attempt to control for the tendency of a firm to stay in a program or to never join it by fitting alternative specifications that include the lagged value of the program participation indicator among the right-hand side variables.
ii
The coefficient of correlation between fines for violations of the RCRA regulations (normalized by employees) and nominations as PRP at Superfund sites is only .075. The coefficients of these regressors are robust to dropping one of these variables and keeping the other.
Table 1. Summary of features of the three programs analyzed. Program Pollutants covered Regulatory Background Age of the Program Do Consumers recognize participation? Can cost savings be realized through the program? Green Lights Greenhouse
gases from fossil fuels used in power generation (only indirectly) Weak Since 1991; Well-established Yes Yes, on electricity bills (main appeal of the program)
WasteWi$e Solid waste Weak Since 1994;
relatively new
Unclear Unclear
33/50 17 heavy metals and other toxic
chemicals Strong Started in 1991 and closed in 1995 Yes, according to Arora and Cason (1996), and Khanna and Damon (1999). Also see Konar and Cohen (1997). Maybe (if changes in production processes are possible that reduce releases and save on inputs)
Table 2. Determinants of Participation in WasteWi$e (1994-1998) from independent probit model. (t-statistics in parentheses) Variable Sample mean A B C D Number of employees 38.047 3.614** (3.415) 5.246** (4.057) 3.318** (2.542) Past Period Increase in Sales 0.066 .126
(.394)
.137 (.425)
-.104 (-.262) Past Period R&D Expenditures ( $
1,000 per employee) 10.140 9.373** (3.682) 9.057** (3.543) 2.073** (3.765) The Firm Produces Consumer
Goods 0.336 .500** (4.558) .513** (4.627) .471** (3.731)
Industry Increase in Sales .773
(1.097)
.784 (1.108)
-.203 (-.249) Past Period RCRA Fines ($ per
employ)
0.741 .026*
(1.603)
.026 (1.545) Potential Responsible Party
Notifications 25.559 -.002** (-2.888) -.002** (-2.204) Environmental Performance is a
Factor in Senior and Manager Compensation
0.629 -.423**
(-3.166)
-.527** (-3.476) Firm Publishes an Environmental
Report
0.335 .600**
(5.337)
.595** (4.441) Firm Considers Environmental
Risks to Select Partners, Suppliers, Customers
0.478 .381**
(3.033)
.231* (1.609) Firm Conducts Internal Env.
Compliance Auditing
0.835 .272
(1.559)
.211 (1.060)
Food Products (SIC 20) 0.086 .555*
(1.682) .483 (1.448) .879** (3.210) .529 (1.428) Paper and Allied Products (SIC
26) 0.084 .300 (1.076) .278 (.994) .180 (.702) .255 (.846) Chemical (SIC 28) 0.182 .149 (.591) .172 (.677) .394* (1.715) -.051 (-.181) Petroleum Refining (SIC 29) 0.070 .282
(.988) .424 (1.447) .552** (2.184) .211 (.678)
Primary Metal (SIC 33) 0.065 .597**
(2.006) .552* (1.839) .840** (3.061) .552* (1.625) Machinery and Computer
Equipment (SIC 35) 0.151 -.032 (-.124) -.071 (-.275) .304 (1.259) -.268 (-.923) Electronic and Electrical
Equipment (SIC 36) 0.103 .228 (.844) .223 (.819) .384 (1.472) .034 (.112) Transportation (SIC 37) 0.062 .240 (.792) .154 (.506) .634** (2.364) .273 (.842) Instruments (SIC 38) 0.108 .558** (2.040) .550** (2.003) .746** (2.902) .437 (1.420) Constant -1.027** (-4.269) -1.004** (-4.159) -1.189** (-5.367) -1.081** (-3.897) Log Likelihood -474.119 -468.384 -448.636 -355.408 Number of observations 775 775 735 624
Table 3. Determinants of participation in Green Lights from independent probit model (1993-1998) (t-statistics in parentheses) Variable Sample mean A B C D Number of employees 38.047 2.722** (3.819) 1.975** (2.456) .851 (1.012) Past Period Increase in Sales 0.066 -.268
(-.868)
-.238 (-.770)
.273 (.715) Past Period R&D Expenditures ( $
1,000 per employee) 10.140 4.319 (1.448) 4.821 (1.574) 2.573 (.501) The Firm Produces Consumer Goods 0.336 .324**
(3.134)
.315** (3.035)
.131 (1.118)
Industry Increase in Sales 1.439**
(2.232)
1.470** (2.193)
.119 (.152) Past Period Clean Air Act Fines ($
per employ) 0.741 .004 (1.273) .002 (.699) PRP Notifications 25.559 .002** (2.184) .001* (1.820) Environmental Performance is a
Factor in Senior and Manager Compensation
0.629 .127
(1.112)
.133 (.973) Firm Publishes an Environmental
Report
0.335 .802**
(7.241)
.738** (5.752) Firm Considers Environmental Risks
to Select Partners, Suppliers, and/or Customers
0.478 .034
(.313)
.013 (.100) Firm Conducts Internal Env.
Compliance Auditing
0.835 -.271*
(-1.801)
-.239 (-1.288)
Food Products (SIC 20) 0.086 -1.657**
(-4.735) -1.534** (-4.425) -.054 (-.237) -1.192** (-3.190) Paper and Allied Products (SIC 26) 0.084 -.990**
(-4.056) -.986** (-4.040) -.581** (-2.575) -.702** (-2.603) Chemical (SIC 28) 0.182 -.676** (-3.258) -.716** (-3.441) -.129 (-.685) -.506** (-2.125) Petroleum refining (SIC 29) 0.070 .635**
(2.598) .517** (2.062) .721** (3.403) .544** (1.996)
Primary Metal (SIC 33) 0.065 -.714**
(-2.717) -.716** (-2.724) -.414* (-1.675) -.270 (-.892) Machinery and Computer Equipment
(SIC 35) 0.151 -.714** (-3.369) -.687** (-3.238) -.068 (-.342) -.410* (-1.666) Electronic and Other Electrical
Equipment Components (SIC 36)
0.103 .195 (.878) .202 (.906) .632** (2.960) .344 (1.349) Transportation (SIC 37) 0.062 -.851** (-3.356) -.864** (-3.384) -.167 (-.741) -.502* (-1.829) Instruments (SIC 38) 0.108 -.026 (-.117) -.021 (-.097) .539** (2.517) .346 (1.316) Constant -.225 (-1.211) -.261 (-1.401) -.531** (-2.993) -.406* (-1.793) Log Likelihood -535.060 -531.253 -555.907 -414.906 Number of observations 933 933 965 729
Table 4. Determinants of participation in 33/50 (1993-1995) from probit model (t-statistics in parentheses) Variable Sample mean A B C D Number of employees 38.047 5.663** (4.401) 4.075** (2.723) 2.401 (1.437) Past Period Increase in Sales 0.066 -1.351**
(-2.407)
-.942 (-1.579)
.204 (.253) Past Period R&D Expenditures (
$ 1,000 per employee) 10.140 -18.111** (-2.295) -14.659* (-1.721) -14.167 (-1.206) The Firm Produces Consumer
Goods 0.336 .190 (1.224) -.014 (-.086) -.315 (-1.371)
Industry Increase in Sales .370
(.245)
-.833 (-1.671)
-.743 (-.360)
RCRA Corrective Actions 0.741 .292**
(3.581)
.334** (4.076) Potential Responsible Party
Notifications
25.559 .014**
(3.129)
.015** (3.053) Past Period TRI Releases (pound
per employee)
92.447 .0001
(.289) Environmental Performance is a
Factor in Manager Compensation
0.629 .364**
(2.358)
.497** (2.066) Firm Publishes an Environmental
Report
0.335 .694**
(3.336)
.647** (2.242) Firm Considers Environmental
Risks to Select Partners, Suppliers, Customers
0.478 -.122
(-.693)
-.065 (-.264) Firm Conducts Internal Env.
Compliance Auditing
0.835 .350*
(1.686)
.144 (.449)
Food Products (SIC 20) 0.086 -1.425**
(-3.342) -.997** (-2.174) -.319 (-1.078) -.664 (-1.303) Paper and Allied Products (SIC
26) 0.084 .441 (1.252) .555 (1.472) 1.669** (4.672) 1.234** (2.515) Chemical (SIC 28 ) 0.182 .548* (1.758) .311 (.928) .676** (2.702) .099 (.250) Petroleum refining (SIC 29) 0.070 1.394**
(2.718) 1.364** (2.333) 1.160** (3.736) 1.292** (2.102)
Primary Metal (SIC 33) 0.065 .464
(1.222) .614 (1.508) .871** (2.614) .941 (1.557) Machinery and Computer
Equipment (SIC 35) 0.151 -.134 (-.435) -.045 (-.130) .103 (.399) -.276 (-.699) Electronic and Electrical
Equipment (SIC 36) 0.103 -.099 (-.303) -.045 (-.130) .435 (1.532) -.137 (-.344) Transportation (SIC 37) 0.062 -.503 (-1.347) -.717* (-1.730) .026 (.094) -.726* (-1.621) Instruments (SIC 38) 0.108 .018 (.058) .087 (.252) 1.250** (3.805) .846* (1.850) Constant .209 (.785) -.089 (-.309) -.669** (-2.807) -.568 (-1.513) Log Likelihood -232.116 -197.421 -257.949 -121.605 Number of observations 437 437 505 340