ISSN: 2089-3272, DOI: 10.11591/ijeei.v6i1.543 351
Big Data in Smart-Cities: Current Research and Challenges
Debajyoti Pal, Tuul Triyason, Praisan Padungweang
School of Information Technology, King Mongkut’s University of Technology Thonburi, Thailand
Article Info ABSTRACT
Article history: Received Jun 21, 2018 Revised Sep 06, 2018 Accepted Nov 15, 2018
Smart-cities are an emerging paradigm containing heterogeneous network infrastructure, ubiquitous sensing devices, big-data processing and intelligent control systems. Their primary aim is to improve the quality of life of the citizens by providing intelligent services in a wide variety of aspects like transportation, healthcare, environment, and energy. In order to provide such services, the role of big-data is important. In this article, we investigate the state-of-art research efforts directed towards big-data analytics in a smart-city context. First, we present a big-data centric taxonomy for the smart-cities to bring forth a generic overview of the big-data paradigm in a smart-city environment. Second, we present a top-level snapshot of the commonly used big-data analytical platforms. Due to the heterogeneity of data being collected by the smart-cities, often with conflicting processing requirements, suitable analytical techniques depending upon the data type are suggested. Additionally, a generic four-tier big-data framework comprising of the sensing hub, storage hub, processing hub and application hub is presented that can be applied in any smart-city context. This is complemented by providing the common big-data applications and presentation of ten selected case studies of smart-cities across the globe. Finally, open challenges are highlighted in order to give future research directions.
Keyword: Analytics Big-data Data visualization Sensors Smart-city
Copyright © 2018 Institute of Advanced Engineering and Science. All rights reserved.
Corresponding Author: Debajyoti Pal,
School of Information Technology,
King Mongkut’s University of Technology Thonburi, Bangkok, 10140, Thailand.
Email: [email protected]
1. INTRODUCTION
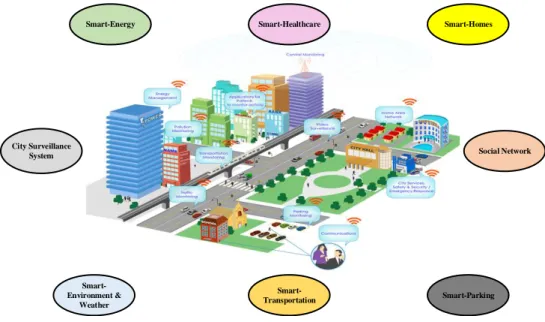
Smart-cities are an emerging paradigm made possible by the amalgamation of a number of new technologies, like the Internet of Things (IoT), real-time systems, and big-data. The proportion of global population living in the cities has been on the rise, and by 2030, 60% of the world population is expected to urbanize [1]. The basic motive behind urbanization is the availability of better opportunities and quality of life (QoL) in the cities [2]. Increase in the density of urban population creates severe stress on the existing city infrastructure. Hence, the current trend is to use the various forms of Information and Communication Technologies (ICT) available, to make the cities ‘smarter’ and ‘self-sustainable’ [3], [4]. Comprehensive efforts are being made to develop smart-homes [5], smart transport [6] and traffic-management systems [7], smart waste-disposal systems [8], smart-energy management [9], smart-healthcare [10], along with a host of other facilities all of which synergize towards the making of a city. A high-level concept of the smart-cities along with the varied functionalities they offer has been shown in Figure 1.
Emerging technologies like IoT, Bluetooth LE, ZigBee, IEEE 802.11ah (Wi-Fi HaLow), LoRaWAN, 5G, cloud and edge computing, big-data and analytics form the core enablers of smart-cities [11], [12]. A massive volume of data from various sensors and other sources are generated by smart-cities, which must be collected, managed, and analyzed to get useful insights and provide the required functionalities. In this respect, big-data analytics play an important role by providing powerful data mining
techniques to extract useful information for making predictions, identifying trends, or making decisions [13]. For example, Meghana et al. proposes a Radio Frequency Identification (RFID) based cost effective traffic management system, which operates the traffic signals dynamically based on vehicular density and suggests re-routes in case of congestions giving priority to vehicles like ambulances, police cars, etc [14]. They are also able to track and provide assistance to the breakdown vehicles. Rathore et al. proposes a four-tier architecture comprising of various sensors (home-sensors, weather, and water sensors, parking sensors, surveillance objects, etc) along with a Hadoop framework for data analysis in-order to obtain insights about the collected data in real-time [15]. Similarly, works from other authors have focused on waste- management systems, smart parking environments, to smart buildings in a smart-city context as shown in Figure 1 [16]-[20].
Figure 1. Some functionalities of a smart-city
Although, several studies exist on smart-cities, yet the role of big-data in this environment needs further academic efforts for their development. Unlike other studies, this article presents the research efforts into big-data solutions for smart cities by providing a big-data oriented smart-city taxonomy, comparison of the different analytical systems, along with presenting the most popular use-cases in this context. Specifically, the following are the contributions of this work:
a) First, we present the characteristics of big-data in a smart-city environment and devise a suitable taxonomy for the same.
b) Second, we present a concise overview of the major big-data analytical platforms for smart-cities. c) Third, a possible four-tier system framework for big-data in the context of smart-cities is presented. d) Fourth, we discuss the most popular applications of big-data in a smart-city environment and present ten
use-cases of actual smart-city initiatives across the globe.
e) Last, we unearth several big-data related open research challenges to give future directions.
2. BIG-DATA CHARECTERISTICS IN A SMART-CITY AND TAXONOMY
The smart-cities generate data in a continuous manner from different applications like healthcare, energy-management, traffic-management, environment monitoring, etc, which results in a massive volume. The rate of data generation is different for different sensors (depending upon the application requirement), and hence data processing is a serious challenge [21]. For example, the GPS sensors might generate data in an interval of a few seconds, while the temperature sensors might generate data in an hourly interval. The quality of data generated by the smart-cities is also very important since they come from heterogeneous sources. To ensure data quality, the source of data should be trustworthy, data gathering should be done from multiple sources, and the sampling frequency of the data should be increased.
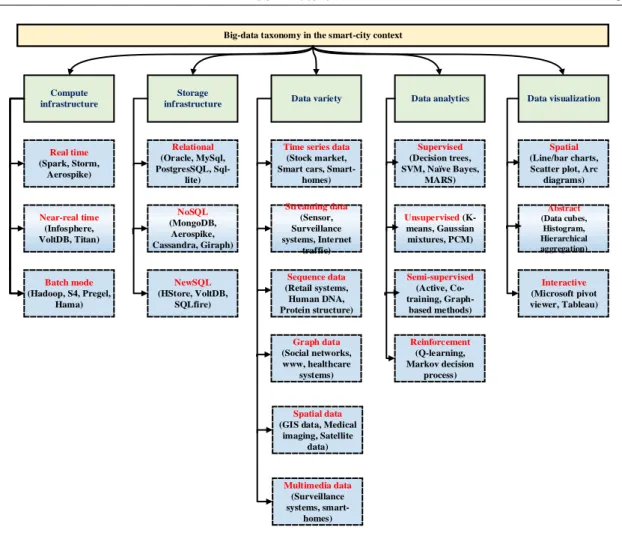
The big-data taxonomy for a smart-city has been shown in Figure 2. We present a five dimensional taxonomy structure by separating into five verticals: computing infrastructure, storage infrastructure, data variety, data-analytics, and data-visualization. Each of the verticals is briefly discussed next.
Smart-Homes Smart-Energy Smart-Healthcare Smart-Environment & Weather Smart-Transportation Smart-Parking City Surveillance
Figure 2. Big-data taxonomy in a smart-city context
2.1. Computing Infrastructure
This refers to the different processing platforms that are normally used for large datasets coming from the smart-cities. Depending upon the data requirements, computing infrastructures can process the data either in real/near-real time or in a batch mode. For example, Hadoop is popularly used for batch processing, while Spark is used for real-time processing.
2.2. Storage Infrastructure
There is a lot of variety in the data collected from the smart-cities, ranging from multimedia to text. Much of the sensor data are unstructured by nature, and hence in addition to the normal relation-based database structure, other types of databases are required. Therefore, storage infrastructure is chosen to be the second vertical that determines the type of storage needed depending upon the big-data type. In addition to the SQL based storage systems like Oracle, MySql, etc., the smart-cities also need NoSQL (MongoDB, Aerospike, HBase, Cassandra, etc.) and NewSQL (HStore, VoltDB, etc.) based systems.
2.3. Data Variety
The smart-cities generate a variety of unstructured data (depending upon the nature of the data source) that has been shown by the third vertical in Figure 2. Time series data are sequences of values or events obtained from repeated measurements over time. Streaming data refer to those, which are continuously arriving, for example sensor data, internet traffic, etc. Sequence data consists of ordered elements or events that are recorded with/without a concrete notion of time [22]. For example, data from smart-retail systems, human DNA, etc. The information which comes from the social networks, world wide web, human body area networks, etc. are naturally suited to be modelled in the form of graph data-structure, and hence are referred to as the graph data. Spatial data refers to the information obtained from sources like remote sensing, geographical information systems, or medical imaging data. Finally, multimedia data includes images, video, and audio. Each of the data types that are mentioned here have their own unique characteristics and are analyzed using different data mining techniques. Table 1 provides the mapping between the data types and the corresponding data mining techniques used.
Big-data taxonomy in the smart-city context
Compute infrastructure
Storage
infrastructure Data variety Data analytics
Real time (Spark, Storm, Aerospike) Near-real time (Infosphere, VoltDB, Titan) Batch mode (Hadoop, S4, Pregel, Hama) Relational (Oracle, MySql, PostgresSQL, Sql-lite) NoSQL (MongoDB, Aerospike, Cassandra, Giraph) NewSQL (HStore, VoltDB, SQLfire) Supervised (Decision trees, SVM, Naïve Bayes, MARS) Unsupervised (K-means, Gaussian mixtures, PCM) Semi-supervised (Active, Co-training, Graph-based methods) Reinforcement (Q-learning, Markov decision process) Time series data
(Stock market, Smart cars,
Smart-homes) Streaming data (Sensor, Surveillance systems, Internet traffic) Sequence data (Retail systems, Human DNA, Protein structure) Graph data (Social networks, www, healthcare systems) Spatial data (GIS data, Medical
imaging, Satellite data) Multimedia data (Surveillance systems, smart-homes) Data visualization Spatial (Line/bar charts, Scatter plot, Arc
diagrams) Abstract (Data cubes, Histogram, Hierarchical aggregation) Interactive (Microsoft pivot viewer, Tableau)
2.4. Data Analytics
A wide variety of machine-learning algorithms are used to extract knowledgeable information from the big-data generated by smart-cities for making predictions, identifying trends, discovering hidden information or making decisions [23]. Depending upon the requirements, a proper analytical approach has to be chosen. Supervised algorithms are used for classification and prediction/regression purpose, while unsupervised algorithms are generally used for clustering and source signal separation. Semi-supervised algorithms are used on large unlabeled datasets on which the traditional supervised algorithms cannot be applied. The semi-supervised learning techniques utilize the structural commonality between labeled and unlabeled data in an efficient manner to generalize the functional mapping over large datasets. Reinforcement learning methods try to create appropriate mapping functions between observations and actions with an aim to maximize a reward function.
2.5. Data Visualization
This is one of the key aspects of big-data in a smart-city infrastructure because it enables the different human stakeholders to understand the significance of data by placing it in a visual context. Spatial visualization layouts enable mapping of data objects to specific points on a co-ordinate system, thereby enabling a simplistic representation of a complex data set. Examples of such a technique are line charts, bar charts, scatter plots, etc. Abstract visualization techniques provide a summary of large-scale data before rendering them to visualization units [24]. Examples are data cubes, histogram binning, hierarchical aggregation, etc. The third, interactive visualization encompasses techniques that allow visualizations and user interactions in real time. Microsoft pivot table, tableau are examples of this scheme.
3. BIG DATA ANALYTICAL PLATFORM OVERVIEW
In this section, we provide a brief overview of the big data analytical platforms that serve as an interface to collect data, perform the required analytics using suitable data mining techniques along with the tasks of data visualization. In the smart-city context, choosing a big-data analytical platform is challenging, due to the variety of data that is obtained, coupled with their diverse requirements. A number of factors like the underlying data processing architecture, the type of data storage, the variety of data-analytical support provided together with powerful visualizations, should be taken into consideration while selecting a suitable big-data platform. Considering the huge volume of data that a smart-city can generate, it is always advisable to perform the data processing and analytics closer to the data source by using the services of cloudlets, edge, and fog computing.
Table 1. Mapping between data types and analytical technique
Data type Analytical technique
Time series Hidden Markov Models, Markov Random Fields, Dynamic Time Warping (DTW), etc Streaming K-means, Distributed SVD, Linear SVM, Kernel SVM, Parallel Tree Learning, etc.
Sequence Hidden Markov Models, Sequence Alignment Algorithms like BLAST (Basic Local Alignment Search Tool)
Graph Collaborative Filtering, Page Rank, Singular Value Decomposition (SVD)
Spatial Spatial Autoregressive Model (SAR), Markov Random Field (MRF) based Bayesian Classifier algorithms Multimedia Motion Vector Analysis, Various types of Statistical Models, Association Rule Mining based algorithms
In Table 2 we show the different big-data analytical platforms used in the smart-cities. Some systems like SAP-Hana, are capable to provide real time data analytics and hence are suitable for applications that require constant monitoring [25]. If the data size is huge, generally massive analytic systems are used. For example, Hadoop and Cloudera distributions are capable to provide massive analytics [26], [27]. Generally, these types of systems are off-line by nature i.e. a quick response is not required from them. In some applications, the size of the data can be smaller than the memory of a cluster. In such cases, memory-level analytics can be applied which is primarily suitable for conducting real time analytics. MongoDB is an example of such a system [28]. The different platforms mentioned in Table 2 though not exhaustive, are representative of all the different types of analytical systems just discussed.
Table 2. Big-data analytics platforms used in smart-cities
Name Key features Disadvantages
Hadoop [25]
* Handles wide variety of structured, unstructured and semi-structured data
* Uses cluster of commodity hardware * Economical
* Easily scalable
* Faster processing due to parallelism * Fault tolerant due to replication
* Not suitable for small datasets * Has high I/O overhead
* Lacks encryption at storage and network level
Cloudera Data Hub [26]
* All the advantages of Hadoop
* Enterprise grade platform ideally suited to smart-cities
* Does not have its own hardware and software systems
* Dependent on third parties for privacy and security issues
SAP-Hana [27]
* Handles text and unstructured data
* In-memory platform mainly catering to different types of transactional needs and hence fast
* Low latency
* Inbuilt support for R language providing power visualizations
* Extremely expensive
* Very limited flexibility due to strict hardware restrictions
* Less powerful when compared to Hadoop based systems
MongoDB [28]
* The query-response time is short
* Supports the concept of horizontal scalability * Particularly suitable for conducting real time analysis
* Provides very limited support for shared extension and complex queries
* Limited support for event types of EPCIS standard
CiDAP [29]
* Handles wide variety of structured, unstructured and semi-structured data
* Suited for IoT platforms by supporting the publish-subscribe paradigm
* Highly scalable in terms of storage and processing * Support for powerful real-time analytics
* Closed-system i.e. not interoperable with other vendors
* Very limited security
* There is no support for anomaly detection
Infobright [30]
* Support huge data volumes (up to 50 TB)
* Strong data compression scheme and hence suitable for smart-industries
* Very efficient due to the use of data skipping technology and columnar design
* High cost
* Table modifications consume a lot of time * All queries cannot be answered optimally using the Infobright optimizer
MapR [25], [31]
* All the advantages of Hadoop * Better system recovery features * Provides enhanced security
* High overall system complexity
IoTDSF [32]
* Capability of cross platform data access * Supports the concept of horizontal scalability * Supports multitenant management
* Requires support from numerous database adapters
* More evaluation is needed based upon performance metric
4. BIG-DATA FRAMEWORK FOR SMART-CITIES
Smart-cities generate large amount of data from different sources. Therefore, the underlying infrastructure should be capable of storing, processing, and analyzing the ever-increasing data volume. There are some important points that must be taken into consideration, while proposing a big-data framework for smart-cities. First, the smart-city big-data framework must guarantee an efficient storage of the varied data forms (structured, to un-structured and semi-structured). Second, they must have the capability to process both real-time as well as historical data (different requirements of real-time vs. batch processing). Third, they must provide flexibility in terms of data storage and processing (in the event of a sudden increase in load). Finally, they should also be able to share the processed results across a variety of applications/services in an incremental and scalable manner.
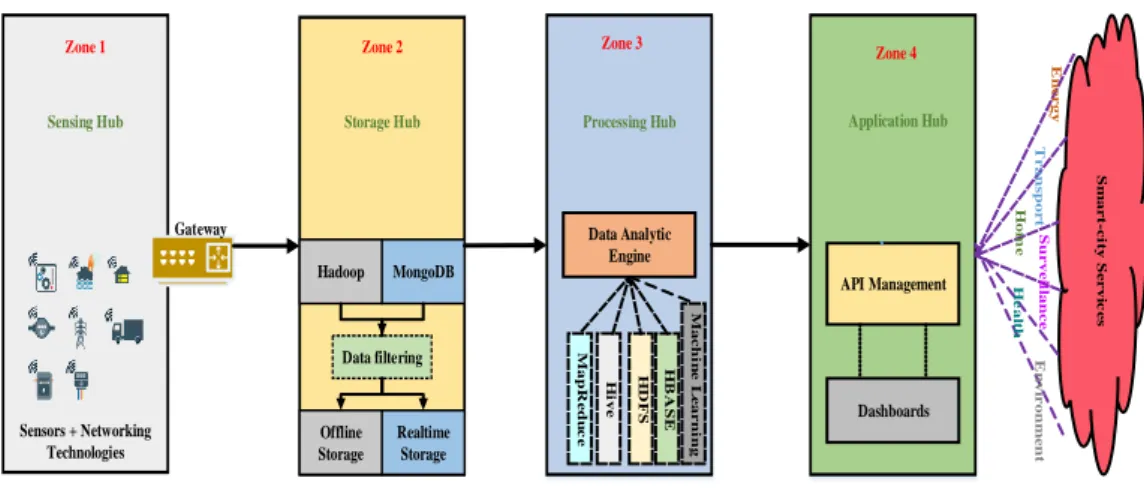
Keeping in mind the above requirements, we propose a conceptual big-data framework for smart-cities in Figure 3. The entire framework has been divided into four distinct zones: Zone 1 (Sensing Hub), Zone 2 (Storage Hub), Zone 3 (Processing Hub), and Zone 4 (Application Hub). All the zones are interlinked, in the sense that the output from one serves as an input to the next. Sensing hub is primarily the physical layer that comprises of different kinds of sensors and objects interconnected with each other by a variety of networking technologies. The sensors are responsible for generating the data of interest. The communication can take place either via a wired or wireless (RFID, WiFi, Zigbee, Bluetooth, etc.) network. A gateway is used for connecting Zones 1 and 2. Multiple gateways can be used to provide a more robust and reliable framework.
Zone 2 is responsible for storing the raw naïve data that is generated by Zone 1. Care should be taken at this stage that no data loss happens, because the true value of data can be judged only after it is processed. Hence, it is desirable to use some cheap massive data storage platform like the Hadoop based systems. At the same time, due to the varied requirements of a smart-city, some of the data may be
time-to provide real-time processing are also included in Zone 2. Since the raw data contain a lot of noise, therefore prior to their storage some filtering techniques should be used.
The entire function of processing and analyzing the data is done in Zone 3. When using a Hadoop based system, the storage requirements are fulfilled by the HDFS, whereas processing is done by the MapReduce algorithm. Using HDFS ensures data scalability. If real time processing is required, HBASE can be used which speeds up the data look-up rate. For querying, and managing the overall functionality, Hive can be used. When not using a Hadoop based system, analogous modules can be selected that perform similar tasks. Thus, irrespective of the platform chosen, the main function of this zone is to provide the required decisions, which are transferred on to the next level.
The application hub acts as an interface between the processing hub and the actual users of the various smart-city services. It is mainly concerned with the API management and providing suitable dashboards to the users depending upon the application context. The decisions that are generated by Zone 3 are extremely diverse in nature, and hence categorized into suitable themes in this phase, which are finally transferred to the appropriate channel.
5. BIG-DATA APPLICATIONS IN SMART-CITIES
In this section, we present some of the common use cases of big-data analytics in a smart-city context. This is complemented by presenting ten case studies of actual smart-cities across the globe. Numerous applications benefit from big-data analytics ranging from healthcare, transportation, agriculture, energy- management, environment monitoring, to smart- homes and smart-government. A brief description of the different use-cases, along with the benefits they provide, and the underlying technology used has been presented in Table 3. In Table 4, a concise summary of ten smart-cities across the globe have been presented. The list of the cities mentioned in Table 4 may not be comprehensive, yet they substantiate the role of big-data towards the successful development of smart-cities throughout the world.
Figure 3. Big-data framework for smart-cities
Table 3. Common big-data use-cases in smart-cities
Smart-city use-case Underlying technology Advantages
Healthcare [33], [34] Bio-sensors, smart-wearables, etc.
* Early prediction of contagious diseases and epidemics * Ubiquitous availability of citizen’s health data
* Enables insurance companies to make customized policies Transportation [35],
[36]
Autonomous cars, IR sensors, RFID tags, etc.
* Automatic traffic management
* Help to ease traffic congestions, especially in busy cities * Can help to improve road safety by taking precautionary measures
* Automatic fleet management and real-time tracking Energy management
[37], [38] Smart meters, energy sensors, etc.
* Increased efficiency of power supply due to better demand-supply prediction
* Creating a dynamic tariff structure benefitting the customers Environment
monitoring [39]
Temperature & humidity sensors, gas sensors, etc.
* Checking the pollution level of cities in real time * Helps in better weather forecasting
Smart governance
[40] Combination of various sensor types
* Helps creating awareness in terms of citizens needs * Enables better and efficient city management
* Helpful in reducing crime rates due to city-wide surveillance Zone 1 Sensors + Networking Technologies Gateway Sensing Hub Zone 2 Storage Hub Data filtering Hadoop MongoDB Offline Storage Realtime Storage Zone 3 Processing Hub Data Analytic Engine M ap R e d u c e H ive M ach in e L e arn in g H B A S E H D F S Zone 4 Application Hub S m art -c it y S e r vi c e s API Management Dashboards E n e r gy T r an s p or t E n vi r on m e n t H e al th H om e Su r ve il lan c e
Table 4. Selected case-study of 10 smart-cities
City Target Initiatives/Features
Seoul, South Korea [41]
Comprehensive smart-city services
* Using ICT for public health and safety
* Online government services to all citizens through mobile applications and websites
* Real time transportation control and tracking using GPS * Use of a single smart-card for all modes of transportation * Automatic street light control depending on the outside luminance
* Smart meters and special devices showing real time energy consumption in homes
Singapore [42] Smart transportation
* City wide expressway traffic advisory system based on real time traffic data
* Intelligent and automatic traffic signaling
* Parking guidance system based upon the availability of parking spaces
Masdar, UAE [43] Smart green-city initiatives
* Focus on smart-public transportation systems and electric vehicles
* Major planning and design principles to reduce energy consumption by natural lighting and ventilation Yokohama, Japan
[44]
Energy and transport management
* Smart transportation systems
* Smart energy management (both domestic and industrial) Nakhon Nayok,
Thailand
City wide IT based services
* The entire province has been connected wirelessly for residents and tourists
Barcelona, Spain [45] Comprehensive smart-city services
* Automated transit systems, with solar panel equipped bus-stops and real-time traffic displays
* Smart-card based bicycle sharing system with an aim to promote eco-transportation
* Fully automated waste management system * Use of LED based smart lighting system Hafencity, Germany
[46]
Comprehensive smart-city services
* Home automation systems focusing on intelligent energy pricing and billing system
* Smart street lighting systems * Smart traffic monitoring systems Copenhagen,
Denmark [46] Smart green-city initiatives
* Smart transportation systems
* Smart water and waste management systems
* Initiatives towards creating an effective cycling system with easy switching from bicycles to public transportation and provision of smart parking spaces for bicycles
Tel-Aviv, Israel [47] Smart citizen-centric services
* Mobile application for providing all types of municipal services to the citizens
* Pan city free WiFi services
* Smart resident cards to all citizens providing exclusive services based on data analytics
New York, USA [47] Comprehensive smart-city services
* 24/7 security alerts on giant smart screens
* Smart traffic and transportation management using real-time data
* Various ICT services like free WiFi, online police services, pollution monitoring, etc
6. OPEN CHALLENGES AND FUTURE DIRECTION
Besides the above-mentioned advantages of big-data analytics in a smart-city environment, there are number of open research issues also. The purpose of discussing these challenges is to give research directions to new researchers in this domain.
6.1. Data Integration
Smart-cities are possible due to the data integration from different organizations, diverse environments, and a wide variety of sensor devices. Data integration even within an organization is a serious challenge, especially in the IT domain. Therefore, adoption of open-standards across the IT and communications industry may help in reducing the technical barriers, however the political and organizational ones are the hardest to address. Therefore, proper focus should be given on the development of standards, which will guide the future smart-city development. Recently, several technologies have been integrated into a smart-city, which has reduced the technical barriers of addressing the data. However, the quality of the acquired data is still a matter of challenge, especially in the context of incorrect/missing data, data in wrong format, or incomplete data [32].
6.2. Security and Privacy
As smart-cities provide Internet connectivity to a variety of devices, security becomes a critical issue. The recent Mirai malware, which compromised connected devices and conscripted them into a botnet, disrupting the internet for millions of people, shows the risks that exist in this smart paradigm. The main concerns for the security experts include risks due to weak pairing and discovery protocols that can leak information about devices, insufficient authorization, weakly encrypted communication that can expose sensitive data, and vulnerability in the devices/sensors that can allow an attacker to spy remotely. Therefore, for successful protection of the voluminous data being generated by the smart-cities, the following issues must be addressed:
1) Steps should be taken for ensuring privacy of the data collected from the users i.e. citizens. 2) The data-centers where majority of the data is stored should use simple, and lightweight.
3) A continuous risk assessment must be done in order to scan for present threats and identify newly emerging attacks.
6.3. Data Analytics
Data analysis is an extremely important functionality on which the performance of a smart-city depends. New data-mining algorithms and visualization techniques are required in order to gain useful insights from the variety of voluminous data acquired by a smart-city. For their better functioning, real-time analytics play a much greater role than the traditional store and process later scenario. Thus, the challenges are brought forward not only by the size and heterogeneity of data, but also in terms of strict time-bound processing that can affect a smart-city performance. It should also be ensured, that with an increase in data volume, the robustness, efficiency, and effectiveness of the existing data-mining algorithms are preserved. 6.4. Guaranteeing QoS and QoE
The smart-cities offer a myriad of services made possible by the integration of a number of different technologies. Highly reliable, flexible, and fault-tolerant networks must be complemented by scalable data-storage and processing platforms together with faster and efficient data-processing algorithms. Thus, the Quality of Experience (QoE) of a smart-city depends largely on the Quality of Service (QoS) provided by the underlying technologies and big-data services. From a big-data perspective, extracting precise information from the huge pool of data that guarantees an optimal QoE of various smart-city applications and services is the key challenge.
6.5. Miscellaneous Issues
Apart from the big-data specific technical challenges just mentioned, there are a number of other factors too, which can affect a smart-city adoption. For example, cost that is incurred by the government in creating a holistic smart-city environment is an important issue. Wherever possible, adhering to open standard frameworks and technologies will enable to reduce costs. The smart-city planners should frame effective policies and guidelines that will meet the future requirements in an economical manner. The benefits of using big-data to improve the citizens’ quality of life cannot be underestimated.
7. CONCLUSIONS
This work has presented a big-data oriented smart-city paradigm. We have provided a big-data taxonomy of smart-cities based on the computing infrastructure, storage infrastructure, data variety, data-analytics and data visualization for the understanding of the readers. Further, we provide the major big-data analytics platforms for the ease of researchers. Concerning the heterogeneous data types, often with conflicting processing requirements, we present a concise mapping between them and the most appropriate analytical techniques that can be used. In addition, ten selected case studies of smart-cities across the world have been reported to reveal an increasing trend of smart-city deployments. In the end, several open research challenges have been discussed such as security/privacy, data integration, and data analytics, which demand attention from the research community and should pave the way for future work.
REFERENCES
[1] Neirotti P et al., "Trends in Smart City Initiatives: Some Stylised Facts,"Cities, vol. 38, pp. 25-36, 2014.
[2] Macke J, et al., "Smart city and Quality of Life: Citizens’ Perception in a Brazilian Case Study,"Journal of Cleaner Production, vol. 182, pp. 717-726, 2018.
[3] Su K, Li J, Fu H., "Smart city and the Applications,"Proceedings of the International Conference on Electronics, Communicatiobs, and Control (IEEE-ICECC), Ningbo, pp. 1028-1031, 2011.
[4] Lombardi P, et al., "Modelling the Smart city Performance," Innovation: The European Journal of Social Science Research, vol. 25(2), pp. 137-149, 2012.
[5] Chan M, et al., "Smart homes- Current features and Future Perspectives,"Maturitas, vol. 64(2), pp. 90-97, 2009. [6] Debnath A. K, et al., "A Methodological Framework for Benchmarking Smart Transport Cities,"Cities, vol. 37, pp.
47-56, 2014.
[7] Djahel S, et al., "A Communications-oriented Perspective on Traffic Management Systems for Smart Cities,"IEEE Communications Surveys & Tutorials, vol. 17(1), pp. 125-151, 2015.
[8] Hong I, et al., "IoT-Based Smart Garbage System for Efficient Food Waste Management," TheSciectific World Journal, pp. 1-13, 2014.
[9] Ejaz W, et al., "Efficient Energy Management for the Internet of Things in Smart Cities,"IEEE Communications Magazine, vol. 55(1), pp. 84-91, 2017.
[10] Pal D, et al., "Internet-of-Things and Smart homes for Elderly Healthcare: An End User Perspective,"IEEE Access, vol. 6, pp. 10483-10496, 2018.
[11] Yaqoob I, et al., "Enabling Communication Technologies for Smart Cities,"IEEE Communications Magazine, vol. 55(1), pp. 112-120, 2017.
[12] Dinh D. V, et al., "ICT Enabling Technologies for Smart Cities,"Proceedings of the 20th International Conference
on Advanced Communication Technology (IEEE-ICACT), South Korea, pp. 606-611, 2018.
[13] Ahmed E, et al., "The Role of Big data Analytics in Internet of Things,"Computer Networks, vol. 129(2), pp. 459-471, 2017.
[14] Meghana BS, et al., "Comprehensive Traffic Management System: Real-Time Traffic Data Analysis using RFID,"
Proceedings of the International Conference of Electronics, Communication, and Aerospace Technology (IEEE-ICECA), Coimbatore, pp. 168-171, 2017.
[15] Rathore MM, et al., "Urban Planning and Building Smart Cities based on the Internet of Things using Big Data Analytics,"Computer Networks, vol. 10, pp. 63-80, 2016.
[16] Talari S et al., "A Review of Smart Cities Based on the Internet of Things Concept,"Energies, vol. 10(4), pp. 1-23, 2017.
[17] Lin T, Rivano H, Mouël FL., "A Survey of Smart Parking Solutions," IEEE Transactions on Intelligent Transportation Systems, vol. 18(12), pp. 3229-3253, 2017.
[18] Anagnostopoulos T et al., "Challenges and Opportunities of Waste Management in IoT-Enabled Smart Cities: A Survey,"IEEE Transactions on Sustainable Computing, vol. 2(3), pp. 275-289, 2017.
[19] Munadi R, Rakhman A, Perdana D., "Smart Garage Implementation and Design using Whatsapp Communication Media,"TELKOMNIKA (Telecommunication, Computing, Electronics and Control), vol. 6(3), pp.1107-1113, 2018. [20] Corno F, Montanaro T, Migliore C, Castrogiovanni P., "SmartBike: an IoT Crowd Sensing Platform for Monitoring
City Air Pollution,"International Journal of Electrical and Computer Engineering, vol. 7(6), pp. 3602-3612, 2017. [21] Qin Y et al., "When Things Matter: A Survey on Data-centric Internet of Things,"Journal of Network and Computer
Applications, vol. 64, pp. 137-153, 2016.
[22] Mahdavinejad MS et al., "Machine Learning for Internet of Things Data Analysis: A Survey," Digital Communication and Networks, vol. 4(3), pp. 161-175, 2018.
[23] Mohammadi M, et al., "Enabling Cognitive Smart cities using Big Data and Machine Learning: Approaches and Challenges,"IEEE Communications Magazine, vol. 56(2), pp. 94-101, 2018.
[24] Shneiderman B., "Extreme Visualization: Squeezing a Billion Records into a Million Pixels,"Proceedings of the
International Conference on Management of Data (ACM-SIGMOD), Vancouver, pp. 3-12, 2008.
[25] Hopkins J, and Hawkin P., "Big Data Analytics and IoT in Logistics: A Case Study,"The International Journal of Logistics Management, vol. 29(2), pp. 575-591, 2018.
[26] Diaconita V, et al., "Hadoop Oriented Smart Cities Architecture,"Sensors, vol. 18(4), pp. 1-20, 2018.
[27] Vera-Baquero A, et al., "Big Data Analysis of Process Performance: A Case Study of Smart Cities,"Big Data in Engineering Applications, vol.44, pp. 41-63, 2018.
[28] Santos J, et al., "City of Things: Enabling Resource Provisioning in Smart Cities,"IEEE Communications Magazine,
vol. 56(7), pp. 177-183, 2018.
[29] Cheng B et al., "Building a Big Data Platform for Smart-cities: Experience and Lessons from Santander,"
Proceedings of the International Congress on Big Data, New York, pp. 592-599, 2015.
[30] Sleazak D et al., "Infobright Analytic Database Engine Using Rough Sets and Granular Computing,"In Proceedings of the International Conference on Granular Computing, SanJose, pp. 432-437, 2010.
[31] Gohar M, et al., "SMART TSS: Defining Transportation System Behavior using Big Data Analytics in Smart Cities," Sustainable Cities and Society, vol. 41, pp. 114-119, 2018.
[32] Gouveia JP, Seixa J, Giannakidis G., "Smart City Energy Planning: Integrating Data and Tools,"In Proceedings of
[33] Wang Y, et al., "Big data Analytics: Understanding its Capabilities and Potential Benefits for Healthcare Organizations,"Technological Forecasting and Social Change, vol. 126, pp. 3-13, 2018.
[34] Manogaran G, et al., "A New Architecture of Internet of Things and Big Data Ecosystem for Secured Smart Healthcare Monitoring and Alerting System,"Future Generation Computer Systems, vol. 82, pp. 375-387, 2018. [35] Ghofrani F, et al., "Recent Applications of Big Data Analytics in Railway Transportaion Systems: A Survey,"
Transportation Resesrch Part C: Emerging Technologies, vol. 90, pp. 226-246, 2018.
[36] Lv Y, et al., "Traffic Flow Prediction with Big Data: A Deep Learning Approach,"IEEE Transactions on Intelligent Transportaion Systems, vol. 16(2), pp. 865-873, 2015.
[37] Zhou K, et al., "Big Data driven Smart Energy Management: From Big Data to Big Insights," Renewable and Sustainable Energy Reviews, vol. 56, pp. 215-225, 2016.
[38] Diamantoulakis P, et al., "Big Data Analytics for Dynamic Energy Management in Smart Grids," Big Data Research, vol. 2(3), pp. 94-101, 2015.
[39] Song M. L, et al., "Environmental Performance Evaluation with Big Data: Theories and Methods," Annals of Operations Research, vol. 270(1-2), pp. 459-472, 2018.
[40] Kitchin R., "The Real-time City? Big Data and Smart Urbanism,"GeoJournal, voi. 79(1), pp. 1-14, 2014.
[41] Lee J. H, et al., "Towards an Effective Framework for Building Smart Cities: Lessons from Seoul and San Francisco,"Technological Forecasting and Social Change, vol. 89, pp. 80-99, 2014.
[42] Neirotti P, et al., "Current Trends in Smart City Initiatives: Some Stylised Facts,"Cities, vol. 38, pp. 25-36, 2014. [43] Angelidou M., "Smart City Policies: A Spatial Approach,"Cities, vol. 41(1), pp. 3-11, 2014.
[44] Fietkiewicz K. K, et al., "“How Smart” are Japanese Cities? An Empirical Investigation of Infrastructures and Governmental Programs in Tokyo, Yokohama, Osaka, and Kyoto,"Proceedings of the 48th Hawaii International
Conference on System Sciences, Kauai, pp. 2345-2354, 2015.
[45] Bakici T, et al., "A Smart City Initiative: The Cse of Barcelona,"Journal of the Knowledge Economy, vol. 4(2), pp. 135-148, 2013.
[46] Caragliu A, et al., "Smart Cities in Europe,"Journal of Urban Technology, vol. 18(2), pp. 65-82, 2011.
[47] Scuotto V, et al., "Internet of Things: Applications and Challenges in Smart Cities: ACase Study of IBM Smart City Projects,"Business Process Management Journal, vol. 22(2), pp. 357-367, 2016.