3D BUILDING MODEL RECONSTRUCTION FROM POINT CLOUDS AND GROUND PLANS George Vosselman and Sander Dijkman
Department of Geodesy Delft University of Technology
The Netherlands [email protected]
KEY WORDS: Building reconstruction, laser altimetry, Hough transform.
ABSTRACT
Airborne laser altimetry has become a very popular technique for the acquisition of digital elevation models. The high point density that can be achieved with this technique enables applications of laser data for many other purposes. This paper deals with the construction of 3D models of the urban environment. A three-dimensional version of the well-known Hough transform is used for the extraction of planar faces from the irregularly distributed point clouds. To support the 3D reconstruction usage is made of available ground plans of the buildings. Two different strategies are explored to reconstruct building models from the detected planar faces and segmented ground plans. Whereas the first strategy tries to detect intersection lines and height jump edges, the second one assumes that all detected planar faces should model some part of the building. Experiments show that the second strategy is able to reconstruct more buildings and more details of this buildings, but that it sometimes leads to additional parts of the model that do not exist. When restricted to buildings with rectangular segments of the ground plan, the second strategy was able to reconstruct 83 buildings out of a dataset with 94 buildings.
1 INTRODUCTION
3D city models become increasingly popular among urban planners and the telecommunication industry. Analysis of propagation of noise and air pollution through cities and estimation of real estate taxes are some other potential applications of 3D city models.
Currently 3D city models are produced by conventional aerial photogrammetry or by semi-automated procedures for measurements in aerial imagery. The high point densities of airborne laser scanners triggered research into the automated reconstruction of 3D building models. This paper reports on our progress in this area.
With the increasing point densities that can be achieved by modern laser scanners, the detection of planar roof faces in the generated point clouds has become easier. Many laser scanners mounted in aeroplanes can nowadays achieve point densities of up to one point per square meter. Surveys with systems mounted in helicopters have been conducted with point densities of five to ten points per square meter [Baltsavias, 1999]. These high point densities usually result in a large number of points on a single roof face. By analysis of the point clouds these roof faces can be detected automatically. Due to the overwhelming evidence provided by the large number of points, the detection of planar roof faces is quite reliable. For the detection of planar point clouds we extended the well-known Hough transform to a three dimensional transformation [Vosselman, 1999].
While the orientation and height of a roof face can be estimated accurately, the outline of a roof face is more difficult to determine. To improve this part of the 3D building model
reconstruction we make use of building ground plans that are available for many cities. The outlines of the buildings as given in such ground plans give the precise locations of the building walls. By intersecting the walls with the detected roof planes, some of the bounds of the roof faces can be reconstructed. Other bounds are to be found by the intersection of pairs of adjacent roof faces and by the detection of height jump edges in the point clouds. The ground plans not only support the accurate location of the outer roof face edges. Often a ground plan reveals information on the structure of a building [Haala and Anders, 1997, Haala and Brenner, 1997]. When modelling buildings by constructive solid geometry, buildings can be regarded as compositions of a few components with simple roof shapes (like flat roofs, gable roofs and hip roofs). The corners in the building outlines of the ground plans often give an indication on the position of these building components within the ground plan. Thus, the ground plan is also useful for the accurate location of some of the roof face edges in the interior of the building.
The paper presents results on the extraction of the roof faces and the generation of 3D building models by combining the extracted roof faces with the ground plans. Section two describes the extraction of the planar faces from the laser data and the usage of the ground plans for this purpose. In the next two sections two different strategies for the reconstruction of the building model are presented. The first strategy refines an initial ground plan segmentation until every segment corresponds to only one planar face. The second strategy starts with a course 3D model and refines this model based on the analyse of point clouds that do not fit well to the course model. Results and a comparison of the two strategies are presented and discussed in the last section.
2 EXTRACTION OF ROOF PLANES
Several algorithms have been proposed for the segmentation of range data [Hoover et al., 1996, Geibel and Stilla, 2000]. Many of those algorithms require the computation of surface normal vectors. Since these vectors tend to be very noisy in the case of laser datasets with high point densities, we prefer algorithms that do not require normal vectors. One such algorithm is the Hough transform extended to 3D [Vosselman, 1999]. Geibel and Stilla [2000] presented a split and merge algorithms that also shows to be suitable for laser data segmentation.
2.1 3D Hough transform
In the classical Hough transform [Hough, 1962] a given point (x,y) in an image defines a line y = ax + b in the parameter space with axes for the parameters a and b. If an image contains several points on a straight line, the lines of these points in the parameter space will intersect and the position of the intersection yields the parameters of the line in the image.
This principle can easily be extended to three dimensions. Each point (x,y,z) in a laser dataset defines a plane z = sx x + sy y + d in
the 3D parameter space spanned by the axes of the parameters sx,
sy, and d, where sx and sy are the slopes in x- and y-direction and d
denotes the vertical distance of the plane to the origin. If a laser dataset contains points in a planar face, the planes of these points in the parameter space will intersect at the position that corresponds to the slopes and distance of the planar face. For the detection of this intersection point the standard procedure of sampling the parameter space and searching for the bin with the highest number of planes can be used [Ballard and Brown, 1982]. The Hough transform does not check whether the points that are found to be in the same plane indeed make up a continuous face. It may as well find some scattered points that are in one plane by coincidence. To check this, the TIN of all laser points is used. Only those points of the detected plane are used that form a connected piece of the TIN of a minimum size. Points that are now assigned to a planar face are removed from the parameter space before looking for the next best plane.
2.2 Usage of partitioned ground plans
In the case of buildings with many roof faces the Hough transform may find spurious planes. Each bin of the parameter space corresponds to a more or less planar area in the object space. It may happen that some arbitrary planar area contains more points than the areas around one of the roof planes. This is shown in figure 1. In such cases wrong planes are detected.
Figure 1: Planar region with most points does not coincide with a roof face.
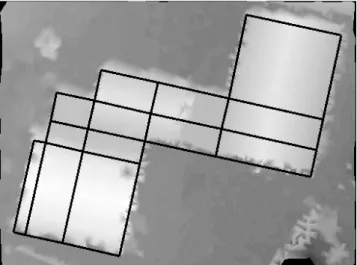
To prevent this, we split the dataset into smaller parts (figure 2) and apply the Hough transform to the points of each part separately (figure 3). By splitting the dataset the chance that a part will contain many faces is diminished. For a useful segmentation of the dataset we make use of a segmented ground plan of the building. By extending the edges of the building outline at the concave corners a segmentation is obtained (figure 2). This segmentation often has edges that correspond to the location of roof face bounds. Thus these edges are likely to separate the points of different roof faces. This further reduces the likelihood of finding many roof faces within a single segment.
Figure 2: Partitioned building outline as overlay on grey value coded heights.
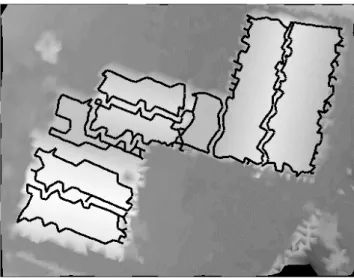
Figure 3: Bounds of planar faces detected by the 3D Hough transform within the partitions.
For many buildings the roof faces are parallel to one of the edges of the segmented ground plan [Haala and Brenner, 1997]. One can make use of this heuristic to reduce the parameter space. After projecting all points inside a segment onto a vertical plane through a segment edge, the Hough transform can again be done in 2D. Figure 4 shows a point cloud of a gable roof building with a dorm that is projected onto two perpendicular vertical planes. After performing the Hough transform on both 2D datasets it will become obvious that the lines found in the first projection correspond to the desired roof faces.
Figure 4: Points of a gable roof projected onto two wall planes. 2.3 Growing planar faces
As shown in figure 3, several planar faces will be found in multiple segments of the ground plan. In some segments no planar face can be found, because the segment only contains a few points. To find better descriptions the planar faces need to be merged over the bounds of the segments and, if possible, to be extended to a few points that are unclassified until now. The result of this procedure is shown in figure 5. For each roof plane one planar point cloud has been identified.
The final determination of the plane parameters follows from a least squares adjustment using all points that are assigned to a plane. As an alternative to growing the planar faces, one could also perform a least squares adjustment within each segment and merge the planar faces over the segments using statistical tests on the similarity of the estimated plane parameters. This strategy is faster, but has the disadvantage that unclassified points are not considered for membership of a planar face that was found in another segment.
Figure 5: Bounds of planar faces after merging and expanding the faces detected inside the segments.
2.4 Least squares estimation of planes
To estimate accurate plane parameters all points assigned to a planar face are used in a least squares adjustment. For the estimation in 2D using the projection as in figure 4a, the most simple model would be
n z y n n
I
Q
d
s
x
x
x
z
z
z
2 2 1 2 1 with1
1
1
E
=
σ
=
î
(1)with slope s and distance d as line parameters and σz as standard deviation of the height measurements. This model, however, ignores that the planimetric coordinates of the laser points are stochastic too. They usually even have a higher standard deviation. To take this into account the model is linearised to
∆
∆
∆
∆
∆
=
î
∆
∆
∆
∆
∆
∆
d
s
x
x
x
x
s
x
s
x
s
z
z
z
x
x
x
n n n n 2 1 0 0 0 2 0 0 1 0 2 1 2 11
0
1
1
0
0
0
1
0
0
0
1
0
0
0
1
E
with (2)
=
n z n x yI
I
Q
2 20
0
σ
σ
where the upper index 0 denotes an approximate value. The slope values estimated with (2) differed up to 1.30 from the values estimated with (1). Assuming σz = 5 cm and σx = 19 cm (based on [Vosselman and Maas, 2001]), the estimated parameter standard deviations are about 1/5 higher using the linearised equations (2) for slopes around 350.
3 REFINEMENT OF GROUND PLAN PARTITIONING Unless the number of points in a segment is very small, one or more planes will have been found by the above procedure. Segments with only one planar face can be fully assigned to that plane. By combining the planimetric bounds of the ground plan segment with the detected plane, a 3D model for that segment can be constructed.
For those segments that contain points of multiple planar faces further splitting of the segment is attempted until only one planar face is left per segment. A segment is split if evidence is found for the presence of an intersection line of two adjacent planar faces or a height jump edge between two such faces.
3.1 Detection of intersection lines
To detect the intersection lines, all (non-parallel) pairs of planar faces are intersected. An intersection line is considered to be found if the following requirements are met:
• The intersection line is inside the ground plan segment.
• The contours of both planar faces are near the intersection line over some range.
• These ranges overlap over some minimum distance. The example building in the figures has three gable roofs. The detected ridge lines are shown in figure 6. They are a little shorter than the actual ridges since the point clouds usually do not extend until the very end of a roof face. The accuracy of these reconstructed ridge lines is very high, since it results from the intersection of two planes that have been determined using many points (typically > 100) [Vosselman, 1999].
3.2 Detection of height jump lines
The detection of height jump edges is the most difficult part of the reconstruction. The accurate location of a height jump edge requires a high point density. To simplify the detection it is assumed that the height jump edge is parallel to one of the edges of the ground plan segment. For each planar face within a segment, hypotheses for locations of height jump edges are generated based on the orientations of the segment edges and the extent of the planar face. If other planar faces exist within the segment and their contours are near a hypothesised height jump edge, this hypothesis is accepted. The range over which the contour points are found near the height jump edge determines the range of this edge.
In the middle of the example building there is a clear height jump edge. In two segments of the ground plan this edge is detected (figure 6). A little to the right a short height jump edge is found. This edge is caused by a few points of the gable roof on the right hand side of this edge that were present inside the segment left of
the gable roof. Since the location of this edge is very near to an edge of the ground plan segment, the height jump edge is assumed to be slightly dislocated and is not taken into account in the further processing.
Figure 6: Detected intersection lines and height jump edges. 3.3 Splitting and merging of segments
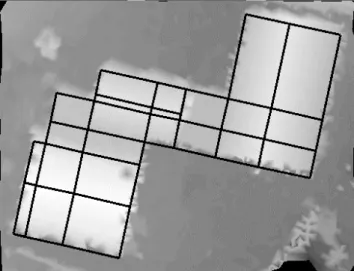
The final steps of constructing the 3D model of a building consist of splitting and merging the ground plan segments until there is a one-to-one relationship between the segments and the roof faces. Once a intersection line or height jump edge has been detected inside a segment, this segment is split into two parts. For both resulting segments it is again evaluated whether there are possibilities to further split the segment. For the example building the ground plan segmentation resulting after the splitting is shown in figure 7.
Figure 7: Refined segmentation after splitting segments at positions of intersection lines and height jump edges.
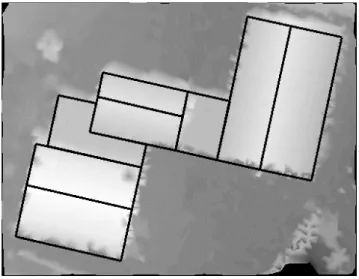
If no further splitting is possible, all segments are assigned to an detected planar face. In some segments there still may be points belonging to different planar faces. In that case the face with the largest number of points is selected. All adjacent segments of the ground plan that are assigned to the same planar face are merged. This results in the final partitioning of the ground plan where
each segment corresponds to a roof face (figure 8). By combining this partitioning with the parameters of the detected planes, the 3D building model can be constructed (figure 9).
Figure 8: Final partitioning after merging segments assigned to the same planar faces.
Figure 9: Reconstructed 3D building model.
4 REFINEMENT OF AN INITIAL MODEL The strategy described above relies on the detection of intersection lines and height jump edges. For this detection the presence of points of two different planar faces near the hypothesised line or edge is required. In particular for small faces these hypotheses can often not be confirmed. The resulting under-segmentation of the ground plan then leads to a generalisation of the building model.
In order to preserve more detail in the model, another reconstruction strategy has been explored. In this strategy we start with a relatively coarse 3D building model that is derived by fitting shape primitives to the original segments of the ground plan. By analysing the clouds of points that do not correspond to this model, refinements are estimated.
4.1 Creation of an initial model
Based on the Hough transform as described in section two, planar faces are detected within each segment. Assuming rectangular segments, hypotheses for five different roof models for the segment are generated: flat roof, slanted roof with two
perpendicular orientations, and two gable roofs with perpendicular orientations.
Figure 10 shows a building with four ground plan segments. The building has a cropped hip roof with a dormer and a perpendicular part with another hip roof. Choosing from the four models, gable roofs are found to be the best fit for each of the segments. By analysing the estimated parameters of the gable roofs, it is concluded that three gable roofs have collinear ridges and eaves. The corresponding segments are merged and the parameters of the gable roof are re-estimated using all points of the three segments. The initial model for this building consist of two adjacent gable roofs with perpendicular orientation.
Figure 10: Building with two hip roofs and a dormer. 4.2 Analysis of remaining point clouds
This building model is then refined by modelling the point clouds that do not fit to the initial model [Maas, 1999]. If one of the five models fits to a point cloud a local correction is made to the initial model. Most often this means a small object (like a box modelling a dormer) is put on top of the initial model. Sometimes, a small part needs to be subtracted from the initial model. This is the case, e.g., if a gable roof is corrected to a hip roof. The extent of the additional models is determined by the bounding box of the examined point clouds. The orientation of such a bounding box is taken to be parallel to the bounds of the segment of the ground plan.
For the merged top three segments in figure 10 a gable roof was assumed as the initial model. Figure 11 shows that four clusters of points that do not fit this model can be discerned. The left and right cluster fit best to the slanted roof model and are situated below the gable roof model. Consequently, the gable roof is adapted to a (cropped) hip roof. The top cluster is also modelled best by a slanted roof. The point cloud is higher than the initial gable roof and therefore leads to a model for the dormer with a rectangular ground plan. Finally the lower cluster is best modelled by a gable roof. It is found that the parameters of this roof correspond to the gable roof that was already found in
another segment of the ground plan. The parameters of this gable roof are therefore re-estimated using the points of from both segments. The resulting model is shown in figure 12.
Figure 11: Clusters of points that do not fit the initial model.
Figure 12: Reconstructed model and a photograph of the building from the same perspective.
5 RESULTS AND CONCLUSIONS
In the paper two strategies for the reconstruction of building models were described. The first strategy relied on the detection of intersection lines and height jump edges between planar faces. The second strategy adopted coarse initial models that were refined on the bases of fitting models to point clouds that did not correspond to the initial models. Overall, the latter strategy shows a larger number of reconstructed details. In datasets with a high point density (5-6 pts/m2) even chimneys were often reconstructed. In particular in datasets with a lower point density, the second strategy leads to better results, since a few points provide enough evidence for the correctness of a model. In such cases the first strategy would often not find sufficient evidence for the presence of intersection lines or height jump edges and
therefore fail to further refine the initial ground plan segmentation. In some cases the second strategy leads to small details that are incorrect. Figure 13 shows an incorrect extension of the gable roof into the rectangle with a flat roof. This extension was caused by a few points of the gable roof that were situated inside the ground plan segment of the flat roof due to a small misalignment between the ground plan and the laser data.
Figure 13: Building model with reconstructed dormer and chimneys and an incorrect extension of the gable roof.
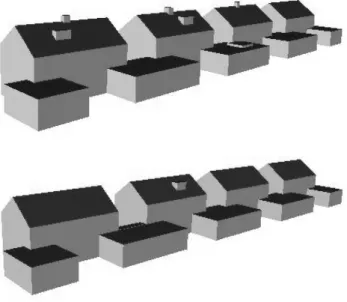
A dataset of 106 buildings has been processed with the second strategy. Twelve buildings did not meet the assumptions of the method. In most of those cases the ground plan segmentation did not yield rectangular segments which is a restriction in the current implementation. 83 out of the remaining 94 buildings were reconstructed successfully (figure 14). The errors were mostly caused by an insufficient number of points within a ground plan segment. This is due to the sometimes very small size of a segment or bad reflection properties of the roof surface [Vosselman and Suveg, 2001]. To improve these results a more global reasoning strategy that incorporate knowledge on the common shapes of buildings needs to be developed.
Figure 14: Part of the reconstructed buildings. The arrows indicate two apparent errors in this area.
The point density of the dataset was reduced from 5-6 points per m2 to 1.25-1.5 points per m2 to study the possibility to reconstruct the same buildings from datasets that can nowadays be acquired by laser scanners in aeroplanes. Obviously, the amount of detail that can be reconstructed is lower (figure 15). It was further found
that six more buildings could not be reconstructed. The other 77 buildings were reconstructed correctly, be it with less details.
Figure 15: Effects of reducing the point density from 5-6 points per m2 (top) to 1.25 - 1.5 points per m2 (bottom) on the amount of reconstructed details.
ACKNOWLEDGEMENT
The FLI-MAP laser data were provided by the Survey Department of the Ministry of Transport, Public Works and Water Management of the Netherlands. The large scale map data (GBKN) was provided by the Dutch Cadastre. The authors thank both organisations for making these data available.
REFERENCES
Ballard, D.H. and C.M. Brown, 1982: Computer Vision. Prentice-Hall, Englewood Cliffs, NJ.
Baltsavias, E., 1999: Airborne laser scanning: existing systems and firms and other resources. ISPRS Journal of Photogrammetry and Remote Sensing, 54 (2-3): 164-198.
Dijkman, S.T., 2001: Automatic building reconstruction from laserscanner data and GBKN data (in Dutch). M.Sc.-thesis Delft University of Technology, 66 p.
Geibel, R. and U. Stilla, 2000. Segmentation of Laser Altimeter Data for Building Reconstruction: Different Procedures and Comparison. International Archives of Photogrammetry and Remote Sensing, vol. 33, part B3, pp. 326-334.
Haala, N. and K.-H. Anders, 1997: Acquisition of 3D urban models by analysis of aerial images, digital surface models and existing 2D building information. SPIE Conference on Integrating Photogrammetric Techniques with Scene Analysis and Machine Vision III, SPIE Proceedings vol. 3072, pp. 212-222.
Haala, N. and C. Brenner, 1997: Generation of 3D city models from airborne laser scanning data. Proceedings EARSEL workshop on LIDAR remote sensing on land and sea, pp. 105-112, Tallin, Estonia.
Hoover, A., Jean-Baptiste, G., Jiang, X., Flynn, P.J., Bunke, H., Goldgof, D.B., Bowyer, K., Eggert, D.W., Fitzgibbon, A. and Fisher, R.B., 1996: An experimental comparison of range image segmentation algorithms. IEEE Transactions on Pattern Analysis and Machine Intelligence 18 (7) : 673-689.
Hough, P.V.C., 1962: Method and Means for Recognizing Complex Patterns. U.S. Patent 3.069.654.
Maas, H.-G., 1999: Closed Solutions for the Determination of Parametric Building Models from Invariant Moments of Airborne Laserscanner Data. International Archives of Photogrammetry and Remote Sensing, vol. 32, part 3-2W5, pp. 193-199.
Maas, H.-G. and G. Vosselman, 1999: Two algorithms for Extracting Building Models from Raw Laser Altimetry Data. ISPRS Journal of Photogrammetry and Remote Sensing 54 (2-3): 153-163.
Vosselman, G., 1999: Building Reconstruction using Planar Faces in Very High Density Height Data. International Archives of Photogrammetry and Remote Sensing, vol. 32, part 3-2W5, pp. 87-92.
Vosselman, G. and H.-G. Maas, 2001: Adjustment and filtering of raw laser altimetry data. OEEPE workshop on Airborne Laserscanning and Interferometric SAR for Detailed Digital Elevation Models, Stockholm, 1-3 March, 11 p.
Vosselman, G. and I. Suveg, 2001: Map based building reconstruction from laser data and images. In: Automatic Extraction of Man-Made Objects from Aerial and Space Images (III), Swets & Zeitlinger Publishers, to appear.