Wayne State University Theses
1-1-2015
Unsupervised Learning And Image Classification
In High Performance Computing Cluster
Itauma Itauma
Wayne State University,
Follow this and additional works at:http://digitalcommons.wayne.edu/oa_theses
Part of theComputer Sciences Commons
This Open Access Thesis is brought to you for free and open access by DigitalCommons@WayneState. It has been accepted for inclusion in Wayne State University Theses by an authorized administrator of DigitalCommons@WayneState.
Recommended Citation
Itauma, Itauma, "Unsupervised Learning And Image Classification In High Performance Computing Cluster" (2015).Wayne State University Theses.Paper 426.
by
ITAUMA ITAUMA THESIS
Submitted to the Graduate School of Wayne State University,
Detroit, Michigan in partial fulfillment of the requirements for the degree of
Master of Science
2015
MAJOR: COMPUTER SCIENCE Approved By:
ITAUMA ITAUMA 2015
To the memory of my MOTHER Idongesit Affiah, to my darling wife
Omosalewa Itauma and to my loving daughter Princess Lily Itauma
I would not have been able to complete this work without the encouragement and support of many people. My first appreciation goes to my advisor, Dr. Xuewen Chen, for his direction, and invaluable advice during this study.
I would like to thank the members of the Big Data lab for their helpful and constructive feedback over the course of this study. I would like to specially thank Dr. Melih Aslan for his constant check in providing me with guidance and assistance. I would like to acknowledge the support from National Science Foundation awards OIA-1028098.
Also, this thesis would not have been completed without the support from my wife Dr. Omosalewa Itauma and daughter Miss Lily Itauma.
And finally, I extend my special and profound thanks to other members of my family for their love and support.
Dedication . . . ii
Acknowledgements . . . iii
List of Figures . . . vi
List of Tables . . . vii
Chapter 1: Introduction . . . 1
1.1 Objective . . . 1
1.2 Background . . . 2
1.2.1 HPCC Systems Platform . . . 3
1.3 Contributions of this Thesis . . . 5
Chapter 2: Methods . . . 7
2.1 Image Reading In HPCC . . . 7
2.2 Feature Learning Representation . . . 9
2.2.1 K-Means on ECL . . . 10
2.3 Classification . . . 11
Chapter 3: Experiments and Results . . . 13
3.1 Evaluation on Caltech-101 . . . 13
3.2 Evaluation on AR Face Database . . . 15
3.3 Identity Recognition on the Wild and Multimedia Database . . . 18
Chapter 4: Discussion. . . 22
Chapter 5: Conclusions and Future Work . . . 23
APPENDIX A: K-means Implementation in ECL . . . 24
APPENDIX B: C4.5 Decision Tree Classification Method in ECL . . . 28
References. . . 35
Abstract . . . 36
Figure 1.1 HPCC THOR Cluster. . . 4 Figure 1.2 HPCC Systems Platform Middleton [2011]. . . 5 Figure 2.1 K-Means Clustering Algorithm . . . 11 Figure 2.2 Selected bases (or centroids) trained on AR images using
K-Means in HPCC. . . 12 Figure 3.1 Selected bases (or centroids) trained on Caltech101 images
using K-Means in HPCC . . . 14 Figure 3.2 Example images from one subject inARdatabase with various
facial expressions, illumination, and occlusion. . . 16 Figure 3.3 The framework that is followed for the classification of AR data. 17 Figure 3.4 Example images of 10 celebrities with various real-world changes
on facial expression, pose, illumination, occlusion, resolution, etc. . . 20
Table 3.1 Precision results for the Caltech-101 database . . . 15 Table 3.2 Comparison of face recognition rates onAR database. . . 17 Table 3.3 Identity recognition results using visual and/or speech
con-tents on multimedia database. Note that K-means in the HPCC environment is used for all cases. . . 21
Chapter 1: Introduction
1.1
Objective
The purpose of this study is the efficient implementation of unsupervised learning and classification algorithms in High Performance Computing Cluster (HPCC) Sys-tems. HPCC is a massively parallel processing computing platform used for solving Big Data problems. A multi-node system leverages the full power of massively par-allel processing (MPP). While the single-node system is fully functional, it does not take advantage of the true power of an HPCC which has the ability to perform op-erations using MPP. Algorithms are implemented in HPCC with a language called Enterprise Control Language (ECL). ECL compiler generates highly optimized C++ for execution.
This study proposes a new idea to use the HPCC platform that i) can lower the execution time of the unsupervised learning process if the required hardware system is equipped, ii) can handle identity recognition using image and speech data, and iii) lowers the budget cost by using existing computers instead of designing an expensive system with GPUs.
In addition to the advantages described above, this proposed method has sev-eral contributions:
• A novel facial representation using multimodal learning strategy. By dividing a face image into several subunits, intra-class and intra-region variance can be effectively dealt with.
• Several classification methods are investigated and compared. The C4.5 decision tree is found to be superior than other alternatives in the most of the cases. Also,
the C4.5 decision tree is less variant to the parameter and structure selection than some of the classification methods such as deep neural networks.
1.2
Background
Feature learning and object classification have been very active research areas in machine learning in the past few decades. There are two major stages in this study:
• feature representation from face images and sound data and
• classification over the representations.
The performance of classification depends on the extracted features, classifi-cation models, and their corresponding parameters.
In addition to these stages and factors, there is a big demand for new ideas to deal with the feature learning and classification stages on high dimensional data. The high dimensionality and the sheer size of unlabeled data available today demand new developments in learning methods. In spite of recent advances in representa-tion learning, most of the current methods are limited when dealing with large scale unlabeled data. Complex deep architecture and expensive training time are mostly responsible for lack of good feature representations for large scale data. In some of the cases, researchers reduce the sizes of data sets and models in order to train networks in a practical amount of time. However, these reductions undermine the learning of high-level features. As another solution to deal with high dimensional data, various researchers in the machine learning community have adopted the use of GPUs and parallel programming techniques to speed up computationally intensive algorithms. Furthermore, important studies have been carried out to propose more efficient op-timization methods to speed up the convergency (such as Bristow et al. [2013]). In
addition to these various ideas and platforms, the goal of this study is to investigate a new environment (High Performance Computing Cluster) to assess the proposed framework’s effectiveness in terms of computation time and classification accuracy.
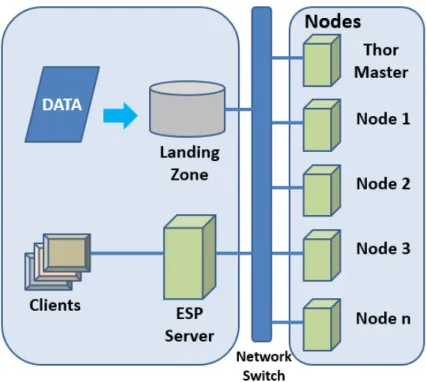
The use of HPCC Systems is proposed because it enables researchers to lever-age a multi-cluster environment to speed up the running time of any computationally intensive algorithm. It is open source and easy to setup. Figure 1.1 shows an HPCC System multi-cluster setup. The figure shows a THOR processing cluster which is similar to Google and Hadoop MapReduce platforms with respect to its function, filesystem, execution, and capabilities but offers higher performance Middleton [2011]. HPCC systems is also preferred because of its scalability in respect to code reuse irrespective of the size of dataset and number of clusters. It provides program-ming abstraction and parallel runtime to hide complexities of fault tolerance and data parallelism. In addition, machine learning algorithms can be implemented in HPCC which already consists of several unsupervised and supervised learning algorithms.
The scope of this study is to show that the HPCC system is able to run image classification problems even using a single core computer. A faster training time is expected if the algorithms are tested on a multinode HPCC cluster. The use of a system combining multiple computers is left for future studies.
1.2.1
HPCC Systems Platform
HPCC moves the algorithm to the data. The platform optimizes codes for efficient parallelizations and minimization of data exchange. ECL which is the core language used by HPCC systems is designed to expressively code complex data manipulation problems.
Figure 1.1: HPCC THOR Cluster.
• HPCC Data Refinery (THOR)
• HPCC Rapid Data Delivery Engine (Roxie) and
• Enterprise Control Language (ECL)
The THOR cluster as shown in Figure 1.1 performs the ETL (Extract, Trans-form, Load) of Big Data processing. Extract involves importing and cleaning raw data from multiple sources. Transform involves combining and collating information from multiple sources. Load involves producing the indexes for data delivery to be used on Roxie. The Roxie cluster runs search on massive datasets.
Figure 1.2: HPCC Systems Platform Middleton [2011].
1.3
Contributions of this Thesis
This thesis presents the use of HPCC Systems for unsupervised feature learning from large datasets and object classification. K-Means in HPCC is compared with the method in Coates et al. [2011]. These methods are unsupervised learning algorithms to learn features from unlabeled data as shown in Chapter 1.3. Various feature extrac-tion processes for each data and classificaextrac-tion methods are followed. The proposed outcome of this step is that once good features are learnt, a supervised learning classification algorithm should perform well as described in Chapter 2.3.
Other contributions are:
• A proposed new feature learning and recognition framework using a multimodal strategy. The new idea is to use the HPCC platform to handle identity recogni-tion using multimedia data (i.e., image and speech informarecogni-tion) in a multimodal framework with high recognition accuracy rates. For instance, by dividing a
face image into several subunits, we can extract intra-region information more precisely.
• The use of HPCC systems in the implementation of the feature learning and object classification tasks is proposed.
HPCC systems enables researchers to leverage a multi-cluster environment to speed up the running time of any computationally intensive algorithm. It lowers the budget cost by using existing computers instead of designing an expensive system with GPUs. Also, it is scalable in respect to code reuse irrespective of the size of dataset and number of clusters.
Chapter 2: Methods
The project framework consists of image reading in HPCC platform, feature learning from unlabeled data, feature extraction from labeled data using the learnt coefficients, and classification stages. The implementation is carried out based on the following stages:
• Generating random patches of image data.
• Reading the image dataset into HPCC systems cluster.
• Learning feature representation using K-Means clustering algorithm from unla-beled input dataset.
• Performing feature extraction by projecting the input dataset with respect to the feature representation resulting in a low dimension dataset.
• Training various classifiers on the low dimensional training dataset.
• Using a testing dataset to predict the labels based on the model generated above.
Details for each stage is given in the following sections.
2.1
Image Reading In HPCC
This is the first study on image classification using HPCC systems, to the best of my knowledge. First, the databases are integrated into the HPCC system. In HPCC, images are represented as Binary Large OBject (BLOB). BLOB support in ECL begins with the DATA value type which makes it perfect for housing BLOB data.
• How to get the data into the HPCC THOR Cluster (Spraying).
• How to work with the data, once it is in HPCC.
• How to get the data back out of HPCC THOR Cluster (Despraying).
The BLOB spray is described in ECL [2015] and HPC [2014]. The image dataset should be sprayed in BLOB format. There are different formats for spraying data such as delimited for CSV, fixed for texts and blob for images. The BLOB spray option is used which will result in a dataset on the cluster where each record is one of the image datasets. Typically, a prefix of both the name and length is used to define the record structure of the image dataset. The record would look like:
ImageRecord := RECORD STRING fileName; DATA image; END;
The data string ”image” is the file content. The first 4 bytes contain the length of the image data. All .jpg (or any image format) files in the directory are sprayed to a single logical file such as (BIGDATA::II::IMAGE). After the data is sprayed into the HPCC THOR cluster, the RECORD structure and DATASET are defined in order to read it in ECL. The following RECORD structure defines the result of the sprayed data.
imageRecord := RECORD STRING filename; DATA image; END;
imageData := DATASET(’~BIGDATA::II::IMAGE’, imageRecord,FLAT);
Since only grayscale images are used, all grayscale images are converted to Comma Separable Value (CSV). A CSV is used to store gray scale images since a gray scale image can be treated as a data set of pixel values. Each row in the CSV contains the pixel values of each image respectively.
The following steps are followed to use the image database:
• Extract patches from images.
• Normalize the patches.
• Convert these patches to CSV.
• Spray the CSV to HPCC.
2.2
Feature Learning Representation
Most applications in image processing involve the use of high dimensional data. The features that represent our data is a lower dimension in a high dimensional space. The goal of unsupervised learning is to find a lower dimensional projection of the unlabeled data that preserves all the information in the data while reducing redundant dimension. The problem in unsupervised learning is trying to find hidden structures in unlabeled data.
After reading the image information in ECL, the feature learning and classifi-cation algorithms are run respectively. In this work, K-Means implemented in ECL and MATLAB is applied for feature learning. Coates et al. [2011] proved that the K-means method can achieve superior results than other possible unsupervised learning
methods. The algorithm takes the dataset X and outputs a function f : Rn → Rk
that maps an input vectorx(i) to a new feature vector of k features. To extract high quality features in order to obtain a high classification accuracy, the methods are run with respect to the key points of this stage such as using:
• a good number of samples,
• choice of parameters, and
• number of weights.
Section 2.2.1 gives a brief description of K-Means algorithms.
2.2.1
K-Means on ECL
K-Means is a partitioning algorithm in which various bases or centroids are con-structed and evaluated based on specific criteria. It is an unsupervised clustering method and partitioning algorithm where data are assigned in clusters defined by their centroid, based on their features and distance from the centroids. The goal is to minimize the sum of the square errors (SSE) as can be seen in Eq. (2.1). The SSE is used to make partitions. It is the sum of squared differences between each observation in its cluster as a centroid over all the k clusters. If a data point is on a centroid then the SSE will be equal to zero. The SSE strictly decreases after recomputing new centers in the K-Means algorithm. The new center of a cluster comes from the average of all data points in this cluster, which minimizes the SSE kme; as follows:
SSE= k X i=1 X x∈Ci kx−mik2, (2.1)
where mi is the mean of points in Ci and x is the data point in cluster Ci. Given two partitions, the one with the smallest error is chosen. Each cluster is represented
Figure 2.1: K-Means Clustering Algorithm Selectk points as initial centroids
repeat
Form k clusters by assigning each point to its closest centroid Re-compute the centroids of each cluster
untilconvergence criterion is satisfied
by the center of the cluster which is the centroid. Points are assigned to the cluster with the nearest centroid. The distance between clusters is based on their centroids:
dis(Ki, Kj) = dis(Ci, Cj), (2.2) where Ki and Kj are two groups of points or information, and Ci and Cj are the corresponding centroids. Given k, the number of clusters, the K-Means clustering algorithm is outlined as in Figure 2.1.
In order to specify the best k, a range of values are run. The computational complexity isO(tkn) wherenis the number of data points,kis the number of clusters and t is the number of iterations. It is an efficient method since usually, k, t << n.
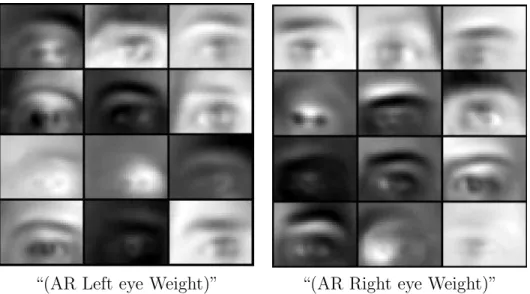
The work Coates [2012] summarizes recent results and technical points that are needed to make effective use of K-Means clustering for learning large-scale repre-sentations of images. Figure 2.2 shows the centroids learned by K-Means implemented in ECL from the AR dataset without whitening.
2.3
Classification
After learning the features from the unlabeled data, the dimension of the labeled data is reduced by a specially designed feature extraction procedure that is described for each data in Chapter 2.3.
“(AR Left eye Weight)” “(AR Right eye Weight)”
Figure 2.2: Selected bases (or centroids) trained on AR images using K-Means in HPCC.
Classification is a supervised learning process that aims at accurately predict-ing some value or attribute of an object based on known facts about the object. It involves deriving a rule or model from a training set which is then used to predict a test set. In machine learning, all classification algorithms follow three logical steps. Learning the model from a training set, testing with respect to obtaining measures of how well the classifier fits, and classifying which involves testing the model on new data in order to compute a classification accuracy. Several classification methods and configurations are used in these experiments that I will give more details in the next section.
Chapter 3: Experiments and Results
In this study, feature learning and classification algorithms are applied on a subset of Caltech-101 based on Fei-Fei et al. [2007], AR Martınez and Benavente [1998], and a subset of PubFig83 database Becker and Ortiz [2013] to which speech content has been added in addition to face images. The major contribution of this study is pioneering the exploration of image/identity classification in HPCC. Note that all images in these experiments are locally normalized to have the Gaussian distribution. For the classification, various classifiers such as Naive Bayes, Random Forest, and C4.5 Decision Tree are used.
The experiments are run on a node HPCC system platform. The single-node HPCC system virtual machine running Ubuntu 64-bit is setup as a guest machine on Windows. The host machine has a usable RAM size of 3.89GB of which 1.5GB is allocated for the guest machine.
3.1
Evaluation on Caltech-101
The Caltech-101 database consists of 102 categories. As a subset of Caltech-101, ten classes are used (which have more than 60 images per class) for both unsupervised and supervised learning steps. Up to 60 images per class are randomly selected and pre-processed as in Kavukcuoglu et al. [2009]: The images are converted to gray-scale, then down-sampled and zero padded to 143×143 pixels. Finally, the images are normalized to have the standard Gaussian distribution.
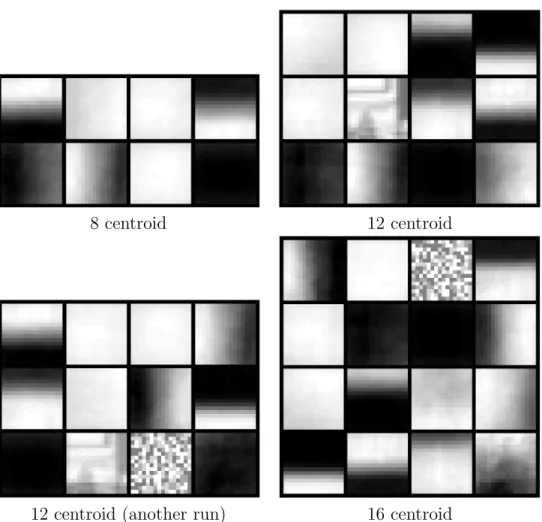
In this experiment, the performance of unsupervised and supervised learning methods are assessed in MATLAB and HPCC. Unsupervised learning methods are performed using 3,000 randomly selected patches of 16×16 dimensional pixels. In the unsupervised learning part, the entire unlabeled training set of images is trained
8 centroid 12 centroid
12 centroid (another run) 16 centroid
Figure 3.1: Selected bases (or centroids) trained on Caltech101 images using K-Means in HPCC
before the classification step. I learn 32 weights in the unsupervised learning of all methods in two platforms.
For the supervised learning, 30 training and 30 testing images are used for each category. To extract features from the labeled training samples, I follow the convolutional extraction process of Coates et al. [2011]. I use stride 1 with 16×16 patches to obtain a dense feature extraction. The non-linear mapping transforms the input patches into a new representation with 32 features using the learned weights. Then pooling is used for dimensionality reduction. 132 pooled features are used to train the classifiers.
Table 3.1: Precision results for the Caltech-101 database
Acc. (%)
Methods 32 Weight
Methods Acc. (%)
K-means (MATLAB) + Linear SVM (MATLAB)Coates et al. [2011] 80.7
K-means (HPCC) + Random Forest (HPCC) 81.33
K-means (HPCC) + Naive Bayes (HPCC) 82.0
K-means (HPCC) + C4.5 Decision Tree (HPCC) 83.5
The visualizations of the learned feature representations are shown. The bases (or centroids) learned by K-Means are shown in Figure 3.1. The result using this data configuration is reported in Table 3.1. The important point of this result is that methods in the HPCC platform are able to obtain comparative or better results than the methods in the MATLAB environment. Three classification methods in HPCC are compared with the same features obtained by the K-means learning. It is observed that the Decision tree method achieves the best results for this data.
3.2
Evaluation on AR Face Database
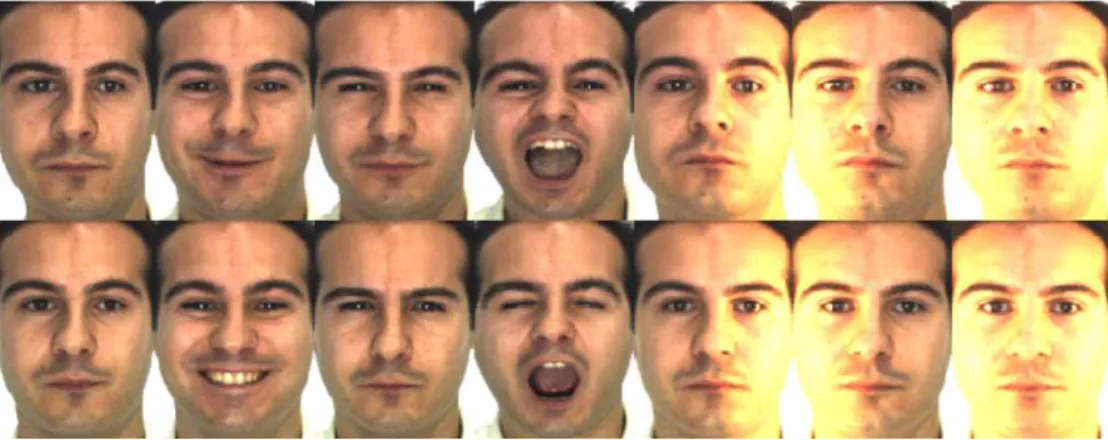
The classification quality is also measured on AR Martınez and Benavente [1998] face database. The aligned AR database contains 100 subjects (50 men and 50 women), with 26 different images per subject which totals 2,600 images taken in two sessions. In this database, there are facial expression (neutral, smile, anger, scream), illumina-tion and occlusion (sunglass, scarf) challenges. In this experiment, images without the occlusion challenges are used that totals to 1,400 images for both the unsuper-vised learning and classification steps. Figure 3.2 shows some example images from a subject.
Figure 3.2: Example images from one subject in AR database with various facial expressions, illumination, and occlusion.
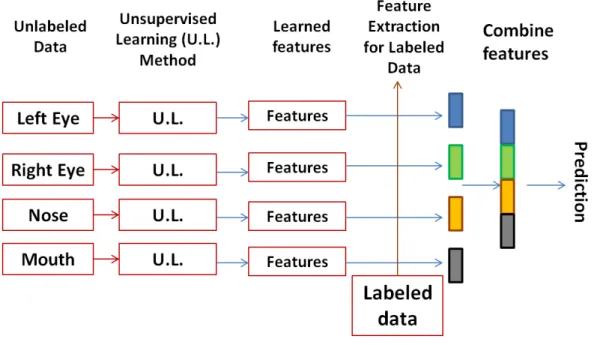
A framework is proposed that is shown in Fig. 3.3 for the face databases in the experiments. First, the weight for each facial region is learnt separately. Four essential facial regions are segmented with sizes of 39 x 51 (left eye and right eye), 30 x 60 (mouth), and 45 x 42 (nose). It is believed that better representations are obtained by running unsupervised learning for each region. I also obtain the features of the labeled facial regions using the corresponding learned weights separately. To do this, I calculate the correlation between each labeled sample and each center vector (weight) to get a vector of features. I then combine the features extracted from the four facial regions (and other possible modalities), and train the classifiers.
For the AR database, I follow a scenario described in Zang et al. [2012] which reported one of the state-of-the-art recognition rates. Each subject has 14 images with facial expression and illumination changes. Various train-test image partitions are tested. I conduct 10 runs for train-test procedure to get the average recognition rate for each partition.
Table 3.2 shows the face classification results obtained from MATLAB and HPCC. In this experiment, several configuration of unsupervised and supervised
Figure 3.3: The framework that is followed for the classification of AR data.
Table 3.2: Comparison of face recognition rates on AR database.
Acc. (%) with Train
Methods 5 Train
K-means (HPCC) + Linear SVM (MATLAB) 69.3
K-means (MATLAB) + Linear SVM (MATLAB)Coates et al. [2011] 74.3
K-means (HPCC) + C4.5 Decision tree (HPCC) 78.9
learning methods are compared in the HPCC and MATLAB enviromnents. From the table, one can observe that Coates et al. [2011] performs better in obtaining good features for classification but a higher classification accuracy is obtained by using decision tree C4.5 classifier in HPCC. I improve the classification results of Coates et al. [2011] between 4.6% and 10.9% using the Decision tree classification in ECL.
3.3
Identity Recognition on the Wild and Multimedia Database
In recent years, several unconstrained databases have emerged in the literature for face identification or verification. Unlike the traditional face databases which are composed of images taken in controlled environments, face images in unconstrained databases are generally collected from Internet sources. In particular, these images contain unrestricted varieties of expression, pose, lighting, occlusion, resolution, etc. Therefore, unconstrained face recognition is a very challenging task.
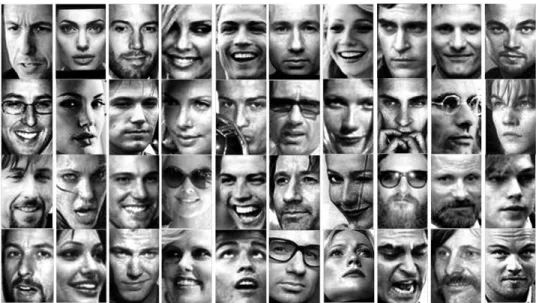
A data set is prepared from an aligned version of wild PubFig83 database Becker and Ortiz [2013]. I select 10 subjects which totals to 1,000 face images. Some ex-ample images are shown in Figure 3.4. For the images, I randomly select 50 images per subject as the training set, and the rest of the images are used as the testing set in the supervised learning step. Four essential facial regions are used for facial rep-resentation learning. I segment four essential facial regions with sizes of 32 x 52 (left eye and right eye), 48 x 76 (mouth), and 60 x 48 (nose), which are further reduced by half using bicubic interpolation.
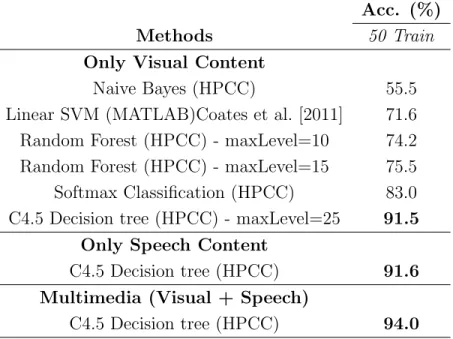
Table 3.3 shows the classification results across 10 runs using various classi-fication configurations. K-means method in HPCC environment is used to obtain features for all classification in this experiment. One observes that the linear SVM in MATLAB obtains 71.6% classification rate. Random forest and softmax
classifi-cation methods in HPCC achieves 75.5% and 83.0% rates, respectively. As observed from the two databases reported above, the Decision tree achieves the best and much superior classification rate, 91.5%.
To assess the feasibility of the proposed framework on the multimedia data, several videos are downloaded for 10 subjects from YouTube to extract around 5 minute speech information. There have been research efforts to show that it is benefi-cial to leverage the knowledge from multimedia data Yang et al. [2013]. For instance, multimedia entertainment companies have started to offer information on cast and characters for movies and shows during playback, presumably via a combination of vi-sual and sound contents Bauml et al. [2013]. Also, it is beneficial to borrow knowledge from some other related tasks for feature extraction.
The Mel frequency cepstral coefficients (MFCCs) Davis and Mermelstein [1980], and their first and second derivatives are employed to represent the acoustic features. Note that the content and quality of the speech data are heterogenous. These fea-tures are calculated every 10 milliseconds using 25 milliseconds Hamming-window1, and their first 12 elements are selected to form a 36-dimensional feature vector for each frame. In the experiment, features extracted from every 40 consecutive frames are concatenated to be a 1440-dimensional feature vector which is considered as one training/test example. The unsupervised generic features are learned over 5000 ex-amples (500 per subject). Half of the sex-amples are randomly selected to train the classifiers and the rest is used for the testing.
In addition to the experiments on the visual content, Table 3.3 shows the identity recognition across 10 runs using speech only and multimedia representation with visual and speech contents. For these two cases, the Decision tree classification
1Dan Ellis’ implementation for MFCC is used which is available at
http://www.ee.columbia. edu/~dpwe/resources/matlab/rastamat/
Figure 3.4: Example images of 10 celebrities with various real-world changes on facial expression, pose, illumination, occlusion, resolution, etc.
method is run. I achieved 91.6% recognition rate using only the speech information. When the visual and speech information together are combined in a multimodal way, a 94.0% recognition accuracy was achieved. By combining different information such as features of different facial regions and corresponding speech contents, the classification accuracy is increased by 2.5%.
Table 3.3: Identity recognition results using visual and/or speech contents on multi-media database. Note that K-means in the HPCC environment is used for all cases.
Acc. (%)
Methods 50 Train
Only Visual Content
Naive Bayes (HPCC) 55.5
Linear SVM (MATLAB)Coates et al. [2011] 71.6 Random Forest (HPCC) - maxLevel=10 74.2 Random Forest (HPCC) - maxLevel=15 75.5 Softmax Classification (HPCC) 83.0 C4.5 Decision tree (HPCC) - maxLevel=25 91.5
Only Speech Content
C4.5 Decision tree (HPCC) 91.6
Multimedia (Visual + Speech)
Chapter 4: Discussion
Image classification in HPCC has been successfully performed in this study. It is observed that as the depth of the C4.5 decision tree algorithm increases, one obtains a higher classification accuracy. Hence, the deeper the tree, the more complex the decision rules and the fitter the model.
Furthermore, clustering can be used to help with classification. K-Means can be used for engineering complex features. A potential application of this project would be in the area of medical imaging. It can be used in finding distinct features that could lead to improved diagnostic accuracy. Considering medical databases, patients may have a unique real-value measure for certain tests such as glucose or cholesterol. Clustering patients first would help us understand how binning should be done on real-value features to improve accuracy on classification.
Since a single core computer was used on the HPCC platform, I had a slightly slower training time of the unsupervised learning algorithms compared to MATLAB on Windows. Therefore considerably smaller dimensional features were used, such as 16 for AR and 32 for Caltech-101 databases. A faster training time is absolutely ex-pected when a multinode HPCC cluster is used. I leave the use of a system combining multiple computers for future studies. Further evaluations with higher dimensional features would be straightforward using an HPCC system with multiple CPUs.
In addition to visual information, the proposed multimodal learning frame-work is also capable of integrating other multimedia content, e.g., speech, by treating individual sources as a unique modality. Representations of multimedia data are learned in a similar way to face images and then fused together with face descriptors to feed to the identity recognition step.
Chapter 5: Conclusions and Future Work
In this study, I have presented an interesting and novel idea to run image classification problems in a relatively new platform (HPCC) that can lead to faster optimization/-calculation of algorithms and low cost of hardware designs. CALTECH-101, AR databases, and a subset of wild PubFig83 data with multimedia content, have been tested to extract features using K-Means, which is then used to improve the classi-fication accuracy based on different classifiers in HPCC. This framework developed in ECL programming language in HPCC system is compared with MATLAB imple-mentation on Windows system. It is observed that the results obtained using the HPCC platform are at least comparable with the outcome from MATLAB. A novel face recognition algorithm was proposed that can lead to further exploration of face recognition problems. The classification accuracy of AR database was increased to 85.2% when compared with the original method described in Coates et al. [2011]. The C4.5 decision tree classification results shows that K-Means selects good fea-tures. Also, this learning framework has been proven to leverage new representations that are learned over multimedia data automatically.
Future work will include integrating an improved method to select the feature or cluster number automatically to obtain a higher accuracy. I also plan to integrate multiple CPUs in the HPCC system to speed up the process, compete with GPU hardware and handle larger dimensional calculations
APPENDIX A: K-means Implementation in ECL
The code below shows K-means implementation in ECL for unsupervised feature learning. IMPORT ML; IMPORT $ ; // I n p u t Data o f 750 u n l a b e l e d a t t r i b u t e s v a l u e r e c o r d := RECORD REAL f 1 ; REAL f 2 ; REAL f 3 ; REAL f 4 ; REAL f 5 ; REAL f 6 ; REAL f 7 ; REAL f 8 ; REAL f 9 ; REAL f 1 0 ; REAL f 1 1 ; REAL f 1 2 ; // Other a t t r i b u t e s d e l e t e d f o r s p a c e REAL f 7 3 9 ; REAL f 7 4 0 ; REAL f 7 4 1 ;
REAL f 7 4 2 ; REAL f 7 4 3 ; REAL f 7 4 4 ; REAL f 7 4 5 ; REAL f 7 4 6 ; REAL f 7 4 7 ; REAL f 7 4 8 ; REAL f 7 4 9 ; REAL f 7 5 0 ; END; // Reading d a t a from HPCC C l u s t e r i n p u t d a t a t m p := DATASET( ’ ˜ t h e s i s : : i i : : b i g d a t a : : d a t a p u b f i g s p e e c h 1 0 0 0 x 7 5 0 s a m p l e s ’ , v a l u e r e c o r d , CSV ) ; ML. AppendID ( i n p u t d a t a t m p , i d , i n p u t d a t a ) ; OUTPUT( i n p u t d a t a ( i d < 9 9 ) , NAMED ( ’ i n p u t d a t a ’ ) ) ; ML. T o F i e l d ( i n p u t d a t a , indepDataC ) ;
OUTPUT( indepDataC , NAMED( ’ indepDataC ’ ) ) ;
// C e n t r o i d s Random G e n e r a t i o n
minimum := MIN( indepDataC , indepDataC . v a l u e ) + 2 ; maximum:= MAX( indepDataC , indepDataC . v a l u e ) / 2 ; K := 1 6 ;
OUTPUT( d C e n t r o i d s , NAMED( ’ d C e n t r o i d s ’ ) ) ; /∗ ## F i r s t Task Experiment − Experiment 1 Sample #: 1000 I t e r a t i o n #: 50 C e n t r o i d # : 12 T o t a l Thor Time : 2 9 : 3 8 . 5 8 4 Convergence : 18 i t e r a t i o n out o f 50 ∗/ //Kmeans T r a i n i n g
MyKMeans:=ML. C l u s t e r . KMeans ( indepDataC , d C e n t r o i d s , 5 0 , . 0 0 0 3 ) ;
// R e s u l t s MyKMeans . A l l R e s u l t s ; MyKMeans . Convergence ; MyKMeans . R e s u l t ( ) ; // Despray e x t r a c t e d w e i g h t f e a t u r e i n CSV f o r m a t OUTPUT(MyKMeans . R e s u l t ( ) , , ’ ˜ o n l i n e : : i i : : b i g d a t a : :
APPENDIX B: C4.5 Decision Tree Classification Method in ECL
//C4 . 5 D e c i s i o n Tree C l a s s i f i c a t i o n IMPORT ∗ FROM ML; IMPORT ∗ FROM $ ; IMPORT PBblas ; L a y o u t C e l l := PBblas . Types . L a y o u t C e l l ; // T r a i n and T est d a t a l a y o u t v a l u e r e c o r d := RECORD REAL f 1 ; REAL f 2 ; REAL f 3 ; REAL f 4 ; REAL f 5 ; REAL f 6 ; REAL f 7 ; REAL f 8 ; REAL f 9 ; REAL f 1 0 ; REAL f 1 1 ; REAL f 1 2 ; REAL f 1 3 ; REAL f 1 4 ;REAL f 1 5 ; REAL f 1 6 ; REAL f 1 7 ; INTEGER L a b e l ; END; // r e a d i n g t r a i n and t e s t d a t a t r a i n d a t a t m p := DATASET( ’ ˜ t h e s i s : : i i : : b i g d a t a : : s u p e r v i s e d s p e e c h d a t a t r a i n ’ , v a l u e r e c o r d , CSV ) ; t e s t d a t a t m p := DATASET( ’ ˜ t h e s i s : : i i : : b i g d a t a : : s u p e r v i s e d s p e e c h d a t a t e s t ’ , v a l u e r e c o r d , CSV ) ; // T r a i n ML. AppendID ( t r a i n d a t a t m p , i d , t r a i n d a t a ) ; OUTPUT ( t r a i n d a t a , NAMED ( ’ t r a i n d a t a ’ ) ) ; // Test ML. AppendID ( t e s t d a t a t m p , i d , t e s t d a t a ) ; OUTPUT ( t r a i n d a t a , NAMED ( ’ t e s t d a t a ’ ) ) ; // c o n v e r t t r a i n d a t a t o two d a t s e t : // s a m p l e s d a t a s e t and l a b e l s d a t a s e t T r a i n d a t a F o r m a t := RECORD t r a i n d a t a . i d ; t r a i n d a t a . f 1 ; t r a i n d a t a . f 2 ;
t r a i n d a t a . f 3 ; t r a i n d a t a . f 4 ; t r a i n d a t a . f 5 ; t r a i n d a t a . f 6 ; t r a i n d a t a . f 7 ; t r a i n d a t a . f 8 ; t r a i n d a t a . f 9 ; t r a i n d a t a . f 1 0 ; t r a i n d a t a . f 1 1 ; t r a i n d a t a . f 1 2 ; END; t r a i n t a b l e := TABLE( t r a i n d a t a , T r a i n d a t a F o r m a t ) ; OUTPUT ( t r a i n t a b l e , NAMED ( ’ t r a i n t a b l e ’ ) ) ; l a b e l T r a i n d a t a F o r m a t := RECORD t r a i n d a t a . i d ; t r a i n d a t a . l a b e l ; END; t r a i n l a b e l t a b l e := TABLE( t r a i n d a t a , l a b e l T r a i n d a t a F o r m a t ) ; OUTPUT ( t r a i n l a b e l t a b l e , NAMED ( ’ t r a i n l a b e l t a b l e ’ ) ) ; ML. T o F i e l d ( t r a i n t a b l e , indepTrainDataC ) ;
ML. T o F i e l d ( t r a i n l a b e l t a b l e , depTrainDataC ) ;
OUTPUT ( depTrainDataC , NAMED ( ’ depTrainDataC ’ ) ) ;
t r a i n l a b e l := PROJECT( depTrainDataC , Types . D i s c r e t e F i e l d ) ; OUTPUT ( t r a i n l a b e l , NAMED ( ’ T r a i n l a b e l ’ ) ) ; // c o n v e r t t e s t d a t a t o two d a t s e t : // s a m p l e s d a t a s e t and l a b e l s d a t a s e t T e s t d a t a F o r m a t := RECORD t e s t d a t a . i d ; t e s t d a t a . f 1 ; t e s t d a t a . f 2 ; t e s t d a t a . f 3 ; t e s t d a t a . f 4 ; t e s t d a t a . f 5 ; t e s t d a t a . f 6 ; t e s t d a t a . f 7 ; t e s t d a t a . f 8 ; t e s t d a t a . f 9 ; t e s t d a t a . f 1 0 ; t e s t d a t a . f 1 1 ; t e s t d a t a . f 1 2 ; END; t e s t t a b l e := TABLE( t e s t d a t a , T e s t d a t a F o r m a t ) ; OUTPUT ( t e s t t a b l e , NAMED ( ’ t e s t t a b l e ’ ) ) ;
l a b e l T e s t d a t a F o r m a t := RECORD t e s t d a t a . i d ; t e s t d a t a . l a b e l ; END; t e s t l a b e l t a b l e := TABLE( t e s t d a t a , l a b e l T e s t d a t a F o r m a t ) ; OUTPUT ( t e s t l a b e l t a b l e , NAMED ( ’ t e s t l a b e l t a b l e ’ ) ) ; ML. T o F i e l d ( t e s t t a b l e , indepTestDataC ) ;
OUTPUT ( indepTestDataC , NAMED ( ’ indepTestDataC ’ ) ) ; ML. T o F i e l d ( t e s t l a b e l t a b l e , depTestDataC ) ;
OUTPUT ( depTestDataC , NAMED ( ’ depTestDataC ’ ) ) ;
t e s t l a b e l := PROJECT( depTestDataC , Types . D i s c r e t e F i e l d ) ; OUTPUT ( t e s t l a b e l , NAMED ( ’ T e s t l a b e l ’ ) ) ;
// D e c i s i o n Tree C l a s s i f i c a t i o n // L e a r n i n g Phase
MinNumObj := 2 ;
MaxLevel := 2 0 ; // D e c i s i o n Tree p a r a m e t e r s
l e a r n e r 1 := ML. C l a s s i f y . D e c i s i o n T r e e . C45binary ( MinNumObj , MaxLevel ) ;
dtModel := l e a r n e r 1 . LearnC ( indepTrainDataC , t r a i n l a b e l ) ; // D e c i s i o n Tree Model // C l a s s i f i c a t i o n Phase
r e s u l t s 1 := l e a r n e r 1 . C l a s s i f y C ( indepTestDataC , dtModel ) ; // Comparing t o O r i g i n a l
compare1 := ML. C l a s s i f y . Compare ( t e s t l a b e l , r e s u l t s 1 ) ;
OUTPUT( compare1 . C r o s s A s s i g n m e n t s , ALL ) ; // C r o s s A s s i g n m e n t r e s u l t s
// Computing t h e a c c u r a c y o f a l l t h e c l a s s e s // Append u n i q u e ID t o c r o s s A s s i g n m e n t s ML. AppendID ( compare1 . C r o s s A s s i g n m e n t s , i d , c r o s s A s s i g n m e n t s ) ; //A d a t a s e t o f c r o s s A s s i g n m e n t s OUTPUT( c r o s s A s s i g n m e n t s , NAMED ( ’ c r o s s A s s i g n m e n t s ’ ) ) ; d i a g V e c := c r o s s A s s i g n m e n t s ( c a c t u a l = c m o d e l e d ) ; // d i a g V e c ; t o t a l A c c u r a t e P r e d i c t i o n := SUM( diagVec , c n t ) ; t o t a l S a m p l e s := SUM( c r o s s A s s i g n m e n t s , c n t ) ; a c c u r a c y := ( t o t a l A c c u r a t e P r e d i c t i o n / t o t a l S a m p l e s )∗1 0 0 ; OUTPUT( a c c u r a c y , NAMED( ’ Accuracy ’ ) ) ;
REFERENCES
A. Middleton, “HPCC Systems: Introduction to HPCC (high performance computing cluster),” 2011.
H. Bristow, A. Eriksson, and S. Lucey, “Fast convolutional sparse coding,”Computer
Vision and Pattern Recognition (CVPR), 2013 IEEE Conference on, pp. 391–398,
2013.
A. Coates, A. Y. Ng, and H. Lee, “An analysis of single-layer networks in unsupervised feature learning,”International Conference on Artificial Intelligence and Statistics, pp. 215–223, 2011.
“HPCC Systems: ECL Programmers Guide. Boca Raton Documentation Team,” 2015.
“HPCC Systems: HPCC Client Tools. Boca Raton Documentation Team,” 2014. “K-Means Clustering Algorithm,”http:// en.wikipedia.org/ wiki/ K-means clustering
Last accessed: 06.15.2015.
A. Y. Coates, Adam; Ng, “Learning feature representations with k-means,” In G. Montavon, G. B. Orr, K.-R. Mller. Neural Networks: Tricks of the Trade. Springer, 2012.
L. Fei-Fei, R. Fergus, and P. Perona, “Learning generative visual models from few training examples: An incremental bayesian approach tested on 101 object cate-gories,”Computer Vision and Image Understanding, vol. 106, pp. 59–70, 2007. A. Martınez and R. Benavente, “The AR Face Database,” Computer Vision Center,
B. C. Becker and E. G. Ortiz, “Evaluating Open-Universe Face Identification on the Web,” Proc. IEEE Conf. Computer Vision and Pattern Recognition Workshops, pp. 904–911, 2013.
K. Kavukcuoglu, M. A. Ranzato, R. Fergus, and Y. Le-Cun, “Learning invariant fea-tures through topographic filter maps, Computer Vision and Pattern Recognition, 2009,”CVPR 2009. IEEE Conference on, vol. 1, pp. 1605–1612, 2009.
F. Zang, J. Zhang, and J. Pan, “Face recognition using Elasticfaces,”Pattern Recog-nition, vol. 45, pp. 3866–3876, 2012.
Y. Yang, Z. Ma, A. G. Hauptmann, and N. Sebe, “Feature selection for multime-dia analysis by sharing information among multiple tasks,”IEEE Transactions on Multimedia, vol. 15, pp. 661–669, 2013.
M. Bauml, M. Tapaswi, and R. Stiefelhagen, “Semi-supervised learning with con-straints for person identification in multimedia data,” IEEE Conference on Com-puter Vision and Pattern Recognition, vol. 1, pp. 3602–3609, 2013.
S. Davis and P. Mermelstein, “Comparison of parametric representations for monosyl-labic word recognition in continuously spoken sentences,” IEEE Trans. Acoustics, Speech and Signal Processing, pp. 357–366, 1980.
ABSTRACT
Unsupervised Learning and Image Classification in High Performance Computing Cluster
by
ITAUMA ITAUMA August 2015 Advisor: Dr. Xuewen Chen
Major: Computer Science Degree: Master of Science
Feature learning and object classification in machine learning have become very active research areas in recent decades. Identifying good features has various benefits for object classification in respect to reducing the computational cost and increasing the classification accuracy. In addition, many research studies have fo-cused on the use of Graphics Processing Units (GPUs) to improve the training time for machine learning algorithms. In this study, the use of an alternative platform, called High Performance Computing Cluster (HPCC), to handle unsupervised fea-ture learning, image and speech classification and improve the computational cost is proposed.
HPCC is a Big Data processing and massively parallel processing (MPP) com-puting platform used for solving Big Data problems. Algorithms are implemented in HPCC with a language called Enterprise Control Language (ECL) which is a declar-ative, data-centric programming language. It is a powerful, high-level, parallel pro-gramming language ideal for Big Data intensive applications.
In this study, various databases are explored, such as the CALTECH-101 and AR databases, and a subset of wild PubFig83 data to which multimedia content
is added. Unsupervised learning algorithms are applied to extract low-level image features from unlabeled data using HPCC. A new object identification framework that works in a multimodal learning and classification process is proposed.
Coates et al. [2011] discovered that K-Means clustering method out-performed various deep learning methods such as sparse autoencoder for image classification. K-Means implemented in HPCC with various classifiers is compared with Coates et al. [2011] classification results.
Detailed results on image classification in HPCC using Naive Bayes, Random Forest, and C4.5 Decision Tree are performed and presented. The highest recognition rates are achieved using C4.5 Decision Tree classifier in HPCC systems. For example, the classification accuracy result of Coates et al. [2011] is improved from 74.3% to 85.2% using C4.5 Decision Tree classifier in HPCC. It is observed that the deeper the decision tree, the fitter the model, resulting in a higher accuracy. The most important contribution of this study is the exploration of image classification problems in HPCC platform.
AUTOBIOGRAPHICAL STATEMENT
Itauma was born in Calabar, Nigeria. He has an undergraduate degree in Electrical Engineering from University of Ilorin. He also received an MSc. in Computer En-gineering from Istanbul Technical University. He is currently completing an MSc in Computer Science at Wayne State University with a concentration in leveraging High Performance Computing Clusters (HPCC) for Large-Scale Image Analysis to solve Big Data problems. During his curriculum at Wayne State University, Itauma worked as a Graduate Teaching Assistant (Winter 2013 - Winter 2014) and Graduate Research Assistant (Winter 2015) in Computer Science at Wayne State University. He also worked as a Supplemental Instruction Leader / Tutor at the Wayne State Academic Success Center (Fall 2014) where he was awarded the Leader’s Choice Award first place among the Tutors in the Academic Success Center. Itauma was also awarded the Supplemental Instruction (SI) Leaders second place for Fall 2014 semester. His interests lie in Robotics and Big Data. He wishes to become a professional educator.
![Figure 1.1 HPCC THOR Cluster. . . . . . . . . . . . . . . . . . . . . . 4 Figure 1.2 HPCC Systems Platform Middleton [2011]](https://thumb-us.123doks.com/thumbv2/123dok_us/356317.2539207/8.918.155.790.160.668/figure-hpcc-thor-cluster-figure-systems-platform-middleton.webp)
![Figure 1.2: HPCC Systems Platform Middleton [2011].](https://thumb-us.123doks.com/thumbv2/123dok_us/356317.2539207/14.918.145.783.142.460/figure-hpcc-systems-platform-middleton.webp)