Beyond Usability: Ordering
e-Service Quality Factors
Sandrine Prom Tep
1,Aude Dufresne
2 1RBC Financial Group e-commerce Chair of HEC Montréal
3000 Chemin Côte-Ste-Catherine
Montréal, QC H3T 2A7, Canada
[email protected]
2Département de Communication
Université de Montréal
Case Postale 6128, Station Centre-ville
Montréal, QC H3C 3J7, Canada
[email protected]
ABSTRACT
As consumers increasingly use the Internet to shop or search for product-related information, website effectiveness has become critical for companies offering online transactions or information that could lead to a purchase. The HCI literature on usability has mainly focused on either the intrinsic qualities of a website interface or the level of task performance it enables. More recently, several studies have used a combination of both approaches, and some have incorporated the marketing-specific notion of usability as part of service quality. This study extends this research, examining various other aspects of website quality in addition to usability (quality and quantity of information, visual design, information security and personalization of interactive features). This study confirms the validity of the Netqu@l scale for evaluation of online service quality by a factorial analysis conducted on a sample of over 4,000 subjects evaluating 21 websites in four industry sectors. In addition, this study examines the relative contributions of five components of service quality to website effectiveness (task completion) and user satisfaction. Discriminant and regression analyses were used to rank the factors promoting online service quality, clearly establishing the key importance of usability, both in terms of task performance and consumer perceptions.
The media never cease to remind us that e-commerce has become indispensable. According to eMarketer projections for 2008, 63% of Canadian Internet users seek information online before buying a product (eMarketer, 2009) and 51% complete the purchase online in the US (eMarketer, 2010). But although this new medium is more essential every day, the quality of the services it provides remains highly variable. As pointed out by Agarwal and Venkatesh (2002), companies need to “understand the barriers and facilitators of online purchasing and to construct websites that can turn visitors into paying customers.” This is especially true as consumers increasingly search for product information online, even if the final purchase is not completed by Internet.
Websites should therefore strive for quality in terms of both the transactions offered and the information provided. Although the importance of website quality and the multi-dimensionality of the “quality” construct are well-recognized, there is less agreement on proposed conceptual definitions of online service quality and corresponding assessment instruments (Bressoles, 2004; Parasuraman et al., 2005). However, one factor that has consistently been included in these definitions of quality is “usability” (or “ease of use” or “navigability”). The objective of this article is not to debate the emerging definition of online service quality, but rather to focus specifically on the various factors that contribute to online service quality and attempt to rank them in order of importance.
THE QUALITY OF ONLINE SERVICES
T
HE CONSUMER PERSPECTIVETo define what constitutes the quality of an online service, it is important to clarify whether we are considering the question from an organizational (expert) perspective or individual (consumer) perspective. As noted by Basch (1992), “Quality has a lot to do with perceived value, with what the consumer considers ‘quality goods’… Given this emphasis on user satisfaction, it’s only natural for the online industry’s customers to help define performance measures for the products they buy and use.” In this study, online service quality was measured directly by consumers and corresponds to the website users’ perception of its quality. As Internet services are delivered by a system, not a person (Hoffman and Novak, 1996), we must examine the users’ interaction with that system to measure the quality of service provided.
U
SABILITYThe ISO 9241-11 quality standard provides the most classic and widely recognized definition of usability: “The extent to which a product can be used by specified
[Type text]
users to achieve specified goals with effectiveness, efficiency and satisfaction in a specified context of use” (International Standard Organization, 1998). The HCI literature approaches usability issues in various ways, but has mainly focused on the intrinsic qualities of the interface (Ravden and Johnson, 1989; Bastien and Scapin, 1993; Shahizan and Li, 2007) or the level of task performance it enables (Nielsen, 1993; Bevan, 1995). More recently, pushed by increasing interest in usability from new fields of research, several studies have used a combination of both approaches (Palmer, 2002; Seffah et al., 2006; Venkatesh and Agarwal, 2006), and some incorporate the marketing-specific notion of usability as part of service quality (Bressoles, 2004; Parasuraman et al., 2005; Nantel et al., 2005). This trend toward increasing interest for the user-consumer within usability research has broadened to include research in the social sciences such as communications, anthropology and marketing (particularly consumer research). These fields now include the user-consumer in a wider conceptual framework incorporating symbolic dimensions related to culture, identity and emotions (Zhang and Li, 2005).
T
HE ONLINE EXPERIENCE AND WEBSITE EFFECTIVENESSIt has been recognized for some time that “creating a compelling online experience for cyber customers is critical to creating competitive advantage on the Internet” (Novak et al., 2000). It was to examine the user perception of the experiential quality of the interaction between consumers and websites that this study was undertaken. Indeed, although quality is in itself a clearly desirable objective for any online service, we sought to determine to what extent perceived quality is the combined product of usability, effectiveness and other more experiential factors.
Whereas analytical studies of website effectiveness rely on expert analysis, this study is empirical in nature, based on the observation of test users interacting with the website to complete a specific task. The effectiveness of each website was evaluated on the objective measurement of success or failure in task completion, namely finding a particular piece of information about a representative product. For example, study participants randomly assigned websites in the renovation sector were asked to find the price of the least expensive jigsaw offered on that site.
This study draws on data collected as part of a larger study on website effectiveness designed to identify the most effective sites in major industry sectors (Nantel et al., 2005). Here, we focus on the components of service quality and how they combine to foster website effectiveness and user satisfaction, to derive general conclusions as a contribution to our understanding of online service quality.
T
HEN
ETQU@
L CONCEPTUAL MODELThe Netqu@l scale was used to evaluate user perception of the quality of online services offered on each website (Bressoles, 2004). Five factors were measured: ease of use, quality and quantity of information, visual design, trust in the security of information entrusted to the site and personalization of the site’s interactive
S
TUDY VARIABLESThree types of variables were examined:
1. online service quality, as measured by the five factors in the Netqu@l
scale, including ease of use (usability);
2. overall satisfaction with the website, based on a reliable and validated
five-item scale to measure attitudes toward a website (Novak et al., 2000). 3. website effectiveness based on task completion. Classification as
“success” or “failure” was based on user answers after being asked to search for specific information on the website. “Failure” applied for responses such as, “I don’t know” and all unmistakable errors, such as indicating “$0” as the price of the least expensive jigsaw.
A
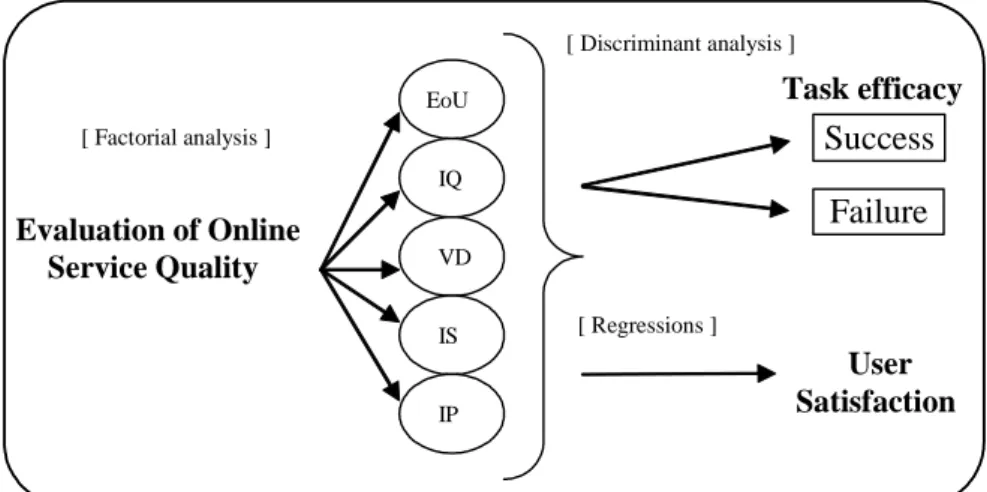
NALYTICAL FRAMEWORKFIGURE 1 Research model. EoU, ease of use; IQ, information quality; VD, visual design; IS, information security; IP, interaction personalization.
Figure 1 illustrates our research model in conceptual and methodological terms. Factorial analysis was first used to examine the relative contributions of the five factors of online service quality with our study sample. Next, used descriminant analysis o determine the extent to which each factor in the online service quality scale correlated with task outcome. Finally, multiple regression analysis was used to examine to what extent perceived website quality can explain overall user satisfaction, and which quality factors were most highly correlated with user
EoU IQ VD IS IP
Success
Failure
Task efficacy
[ Discriminant analysis ]User
Satisfaction
[ Regressions ] [ Factorial analysis ]Evaluation of Online
Service Quality
[Type text]
satisfaction. Our hypothesis was that online service quality, particularly usability, is a good indicator of user satisfaction.
METHODS
S
TUDY SAMPLE AND DATA COLLECTIONThe data for this study were collected as part of a larger study conducted jointly by the RBC Groupe Financier E-commerce Chair at the École des Hautes Études Commerciales of Montréal and the Léger Marketing firm (Bressoles and Nantel, 2005).
A total of 4144 test website users were recruited at random from the Léger Marketing consumer panel, representing a wide range of experience with Internet navigation in general and with the websites used in the study. Each month from September 2004 through January 2005, approximately 1000 test users participated in a survey, split almost equally among four industry sectors. The B2C (business to consumer) websites of 21 major Canadian companies representing the electronics, travel, renovation and financial industries were examined (Table 1).
Table 1 Company Websites by Industry Sector Financial Institutions Electronics Renovation Travel
Desjardins
National Bank of Canada ING Direct Toronto Dominion Scotia Bank CIBC BMO RBC Royal Bank Future Shop Best Buy La Source Brick Dumoulin Home Depot Rona Canadian Tire Home Hardware Destina.ca Exitravel.com Expedia.ca Travelocity.ca
For each website representing a particular industry, the study participants were asked to perform a plausible and similar search task. Specifically, for the electronics industry, they were to find the lowest priced 4-megapixel digital camera; for the travel sites, the best possible price for a trip to Cancun from May 1st to the 8th, 2005; for the renovation sites, the least expensive jigsaw; and for the financial institutions, the interest rate for a one-year fixed-rate mortgage.
After having succeeded (or failed) in accomplishing their task, each test user was asked to complete an online questionnaire to assess the quality of the website’s online service (Table 2), indicate their overall satisfaction with the site, and answer a few socio-demographic questions. The test users participated from their homes and were remunerated for their participation.
Ease of Use (EoU)
1. This website is easy to use.
2. It is easy to find information on this website.
3. It is easy to browse and find what you’re looking for on this website.
4. This website’s structure and layout make finding information easy.
5. This website’s layout is clear and simple. Information quality and quantity (IQ)
6. This website offers detailed information on products or services.
7. The information on this website is pertinent.
8. The information on this website is accurate. Visual design (VD)
9. This website is attractive.
10. This website shows creativity.
11. This website is visually appealing. Trust in information security (IS)
12. Overall, I trust this website’s security measures.
13. This website guarantees that I can surf safely.
14. I think that my private life is protected on this website.
15. I trust this website not to use my personal information indiscriminately. Interaction personalization (IP)
16. I can interact with this website and receive personalized information.
17. This website helps me fulfill my specific needs.
18. This website has interactive features that help me with navigating.
19. This site saves my preferences and offers me additional services or information based on these preferences.
Chen and Wells Scale (1999):
5-point scale from "definitely disagree" to "definitely agree"
1. This website makes it is easy for me to build a relationship with this company. 2. I would like to visit this site again in the future.
3. I am satisfied with the service provided by this website. 4. I am comfortable surfing on this website.
5. I feel surfing the website is a good way for me to spend my time. 6. Compared with other websites, I would rate this site as:
[Type text]
ANALYSIS AND RESULTS
F
ACTORIAL ANALYSIS OF ONLINE SERVICE QUALITY FACTORSThe survey results were first analyzed to determine whether the five factors of the scale indeed helped determine online service quality. Principal component factorial analysis, with varimax orthogonal rotation, of the 19 items of the Netsqu@l scale clearly indicated that the five quality factors together accounted for 86.5% of the total variance in the following order: ease of use accounted for 25% of total variance; information security, 23%; visual design, 15%; information quality, 12%; and interaction personalization, 11.5%. Although ease of use was of only slightly greater importance to the test users than trust in information security, this finding confirms published reports of its dominant role in determining the quality of online services.
F
ACTORS CONTRIBUTING TO TASK COMPLETIONDiscriminant analysis was then conducted to determine whether the five quality factors contributed to discrimination between success or failure in task completion. This analysis revealed a very significant (p = 0.000) discriminant function and allowed the online service quality factors to be ranked in order of their contribution to website effectiveness. As can be seen in the structure matrix (Table 3), ease of use had the highest correlation with the discriminant function (0.898). In comparison, trust in information security and visual design contributed the least to discrimination between success and failure in task completion.
Table 3 Discriminant Analysis Results Service quality factor Function Correlation
Ease of use 0.898
Information quality and quantity 0.838 Interaction personalization 0.655 Trust in information security 0.362
Visual design 0.308
The classification of results showed 74.6% successful classification by cross-validation (the most conservative computational method). This result is much greater than the chance ratio (50%) or the proportional chance criterion (70%), confirming the dominant role of usability in the online service quality construct. This result also indicates that, beyond ease of use, it is very important to provide good information in sufficient quantities, because the information factor often impacts the usefulness or pertinence of the site and contributes greatly to user perception of service quality.
Finally, we examined how closely the various factors of the online service quality construct were related to overall user satisfaction. First, using multiple regression analysis, we were able to confirm that the five factors of perceived quality (overall model) were closely correlated with satisfaction (R2 = 76.4%), with highly
significant coefficients (p = 0.000). Simple regression analysis for each factor demonstrated that personalization of interaction (R2 = 0.634) was most closely correlated with user satisfaction, just ahead of ease of use (R2 = 0.618).
Table 4 Linear Regression Results
Service quality factors Adjusted R2
Ease of Use 0.618
Information quality and quantity 0.497
Visual design 0.458
Trust in information security 0.322 Personalization of interaction 0.634 Overall model of online service quality 0.764
CONCLUSIONS AND IMPLICATIONS
Although the quality of online services may be defined in various ways, certain factors such as usability stand out as central to the quality construct. These factors definitely influence consumer perception of quality, which in turn positively influences their overall satisfaction with a website and correlates with website effectiveness — the ability to inform users and allow them to complete tasks related to the site’s intended purpose. This study also shows that among the five components of service quality we measured, ease of use showed the highest correlation with website effectiveness and was also one of the factors most closely associated with user satisfaction, slightly ahead of personalization of interaction.
These findings are of particular interest because they are based on a large (n = 4144) representative sample of Internet users drawn from the population at large, rather than relying on university student participation for the sake of convenience. In addition, this study used a large sample of websites (n = 21), each highly representative of their industry sector, being among the largest and most popular sites, which strengthens the external validity of the results.
Designing a quality website is crucial to the success of companies that offer an online storefront. As creating large commercial websites necessarily involves trade-offs among the available resources (time, personnel, budget, existing technology, etc.), managers need to know which factors are most important in designing a high quality site that is effective in building customer loyalty, both online and off. This study delivers a clear recommendation: all Internet storefronts should prioritize ease of use, information quality and personalization.
[Type text]
LIMITATIONS AND FUTURE RESEARCH
This study is not an exception to the rule and some limitations of its methodological and conceptual approach bear mentioning. In terms of methods, it is important to emphasize that the test users evaluated the website after having visited it and searched for certain information; the user satisfaction scores could thus be influenced by the users’ success or failure in completing the requested task. Although the results could consequently be considered an interpretation of their success or failure, they nonetheless represent the aspects of service quality to which the user attributed their success or failure and which they would probably like to see improved.
In conceptual terms, this study confirms the positive correlation between perceived usability, as a major factor in website quality, and the website’s capacity to satisfy users and enable them to accomplish the intended purpose of their visit. This study also highlights the great importance of the quality and quantity of information as a contributing factor to website effectiveness and of personalization of the interactive features as the primary contributor to overall user satisfaction. However, as previously noted, the task used here was an information search, that is, a specific goal-oriented task. Future research should examine whether the results are the same for more experiential browsing, less oriented toward a specific goal. Such research could determine the extent to which the nature of the task might influence the relative importance of visual design, which in other circumstances may well constitute a quality factor which contributes more to user satisfaction, if not to website effectiveness.
ACKNOWLEGEMENTS
The authors would like to thank the RBC Groupe Financier E-commerce Chair at the École des Hautes Études Commerciales of Montréal for permission to use the data from their study.
REFERENCES
Agarwal, R. and Venkatesh, V. (2002), “Assessing a Firm’s Web Presence: A Heuristic Evaluation Procedure for the Measurement of Usability.” Information Systems Research, 13(2), 168–186.
Basch, R. (1992), “The Seven Deadly Sins of Online Services.” Online, July, p. 22– 25.
Bastien, J.M.C. and Scapin, D.L. (1993), Ergonomic criteria for the evaluation of human-computer interfaces, Rapport technique No. 156, Institute Nationale de Recherche en Informatique et en Automatique, Le Chesnay, France.
conséquences et variables modératrices (Doctoral dissertation), Université de Toulouse, France.
Bressoles, G. and Nantel, J. (2005), Vers une typologie des sites Webs destinés aux consommateurs. Cahier de recherche No. 05-03, Chaire de commerce électronique RBC Groupe Financier, HEC Montréal.
Chen Q. and Wells W.D. (1999), “Attitude Toward the Site.” Journal of Advertising Research, 39 (5), 27–37.
eMarketer (2009) US Online Activities of US Internet Users, Q3 2009 (% of respondents), retrieved from emarketer.com.
eMarketer (2010) Online Buyers 2008 & 2009, retrieved from emarketer.com. Hoffman D.L. and Novak T.P. (1996), “Marketing in Hypermedia
Computer-Mediated Environments: Conceptual Foundations.” Journal of Marketing, 60 (3), 50–68.
International Standard Organization (1998), ISO 9241-11. The ISO Website:
http://www.iso.org/
Nantel, J., Mekki Berrada, A. and Bressolles, G. (2005), “L'efficacité des sites Web : quand les consommateurs s'en mêlent.” Revue Gestion, 30 (1), 16–23. Nielsen, J. (1993), Usability engineering. AP Professional, Boston.
Novak, T.P., Hoffman, D.L., Yung, Y., Measuring the Customer Experience in Online Environments: A Structural Modeling Approach, Marketing Science, Vol 19, no 1, 2000, pp.22.
Palmer, J.W. (2002), “Web site usability, design, and performance metrics.” Information Systems Research, 13 (2), 151–167.
Parasuraman, A., Zeithaml, V.A., Malhotra, A. (2005), “E-S-QUAL: A Multiple-Item Scale for Assessing Electronic Service Quality.” Journal of Service Research, 49(4), 406–13.
Ravden, S.J. and Johnson, G.E. (1989), Evaluating Usability of Human Computer Interfaces: A Paractical Method. Ellis Horwood, Chichester, UK.
Seffah, A., Donyaee, M., Kline, R.B., and Padda, H.K. (2006), “Usability measurement and metrics: A consolidated model.” Software Quality Journal, 14 (2), 159–178.
Shahizan, H. and Li, F. (2007), “Benchmarking the Usability and Content Usefulness of Web Sites: Developing a Structured Evaluation Framework”, in: Social Implications and Challenges of e-Business, Li, Feng (Ed.). IGI Global Publishing, Hershey, Pennsylvania.
Venkatesh, V., and Agarwal, R. (2006), “Turning Visitors into Customers: A Usability-Centric Perspective on Purchase Behavior in Electronic Channels.” Management Science, 52 (3), 367–382.
Zhang, P. and Li, N. (2005) “The Intellectual Development of Human-Computer Interaction Research: A Critical Assessment of the MIS Literature (1990-2002).” Journal of the Association for Information Systems, 6 (11), 227–292.