• No results found

Supervised Learning Models to Predict Stock Direction Within Different Sectors in a Bull and Bear Market

N/A
N/A
Protected

Academic year: 2021

Share "Supervised Learning Models to Predict Stock Direction Within Different Sectors in a Bull and Bear Market"

Copied!
115
0
0

Loading.... (view fulltext now)

Full text

(1)

Technological University Dublin

Technological University Dublin

ARROW@TU Dublin

ARROW@TU Dublin

Dissertations

School of Computing

2018

Supervised Learning Models to Predict Stock Direction Within

Supervised Learning Models to Predict Stock Direction Within

Different Sectors in a Bull and Bear Market

Different Sectors in a Bull and Bear Market

Tiffany Razy

[email protected]

Follow this and additional works at:

https://arrow.tudublin.ie/scschcomdis

Part of the

Computer Engineering Commons

Recommended Citation

Recommended Citation

Razy, Tiffany (2018). Stock direction within different sectors in a bull and bear market. Masters

dissertation, DIT, 2018.

This Dissertation is brought to you for free and open access by the School of Computing at ARROW@TU Dublin. It has been accepted for inclusion in Dissertations by an authorized administrator of ARROW@TU Dublin. For more information, please contact

[email protected], [email protected], [email protected].

(2)

Supervised

Learning Models to Predict

Stock Direction Within Different Sectors

in a Bull and Bear Market

Tiffany Razy

A dissertation submitted in partial fulfilment of the requirements of

Dublin Institute of Technology for the degree of

M.Sc. in Computing (Data Analytics)

January 2018

(3)

I certify that this dissertation which I now submit for examination for the award of MSc

in Computing (Knowledge Management), is entirely my own work and has not been

taken from the work of others save and to the extent that such work has been cited and

acknowledged within the test of my work.

This dissertation was prepared according to the regulations for postgraduate study of the

Dublin Institute of Technology and has not been submitted in whole or part for an award

in any other Institute or University.

The work reported on in this dissertation conforms to the principles and requirements of

the Institute’s guidelines for ethics in research.

Signed: Tiffany Sara Razy

(4)

ABST

RACT

Forecasting stock market price movement is a well researched and an alluring topic

within the machine learning and financial realm. Supervised machine learning

algorithms such as Random Forest (RF) and Support Vector Machines (SVM) have been

used independently to gain insight on the market. With such volatility in the market the

scope of this study will utilized the RF and SVM in a very volatility market to determine

if these models will perform at a high level or outperform each other in both markets.

This relative study is performed on 16 stocks in 4 different sectors over the bear market

”housing crash” of 2008

. The model utilized technical indicators as the respective

parameters to assist in predicting the stock price movement when determining the

performance of each model. Despite the No Free Lunch Theorem stating one model can

not out perform another model, the study displayed higher accuracy for the RF model.

Each model was evaluated using the confusion metrics to calculate the precision, recall,

and F1 score.

Key words: Support Vector Machines, Random Forest, Bull and Bear Market, Stock

Price Forecasting, Technical Indicators

(5)

ACKNOWLEDGEMENTS

I would like to express my sincere thanks to my supervisor Andre Rios for his assistance,

patience, guidance, and constant support through the course of this dissertation.

I’d

like to thank

Sarah Jane Delany, Luca Longo, and Matthew Morey for their

unconditional support, advice, and patience.

I also appreciate all my DIT lectures for assisting me in gaining the knowledge to be

able to complete this dissertation.

I would like to thank my parents, siblings, and boyfriend for encouraging me to continue

working hard, providing unconditional love, and for supporting me.

I would like to immensely thank Angie Hayes, and Roxanne Chenette for proofreading

my proposal, dissertation, and for their enormous amount of kindness.

(6)

TABLE OF CONTENTS

ABSTRACT  ...  II  

TABLE  OF  FIGURES  

...  

VII  

1  

INTRODUCTION  

...  1  

1.1  

BACKGROUND  

...  1  

1.2  

RESEARCH  PROJECT/PROBLEM  

...  1  

1.3  

RESEARCH  OBJECTIVES  

...  3  

1.4  

R

ESEARCH  

M

ETHODOLOGIES


...  4  

1.5  

SCOPE  AND  LIMITATIONS  

...  5  

1.6  

D

OCUMENT  

O

UTLINE

 ...  6  

2  

LITERATURE  REVIEW

 ...  

8


2.1  

TRADING  STRATEGIES  ...  9  

2.1.1  

TECHNICAL  ANALYSIS  ...  9  

2.1.2  

F

UNDAMENTAL  

A

NALYSIS

 ...  12  

2.2  

MARKET  TRENDS  AND  BEHAVIOURAL  INVESTMENT  ...  12  

2.2.1  

BULL  AND  BEAR  MARKET  

...  13  

2.3  

MACHINE  LEARNING  ...  13  

2.3.1  

S

UPPORT  

V

ECTOR  

M

ACHINES


...  14  

2.3.2  

RANDOM  FOREST  

...  15  

2.4  

EVALUATION  

...  15  

2.4.1  

CONFUSION  MATRIX  

...  16  

2.5  

OVERVIEW  ...  18  

3  

DESIGN  AND  METHODOLOGY  

...  19  

3.1  

I

NTRODUCTION

 ...  19  

3.2  

BUSINESS  UNDERSTANDING  

...  20  

3.2.1  

BUSINESS  GOAL  ...  21  

3.3  

DATA  UNDERSTANDING  ...  21  

3.3.1  

C

OMPANY  

S

ELECTION

 ...  22


3.3.2  

COMPANY  STOCK  CRITERIA  

...  22  

3.3.3  

COMPANY  STOCK  DATA  

...  23  

(7)

3.4.1  

E

XPONENTIAL  

S

MOOTHING  

A

VERAGE

 ...  25  

3.4.2


AVERAGE  DIRECTIONAL  INDEX  ...  26  

3.4.3  

BOLLINGER  BAND  

...  27  

3.4.4  

CHAIKIN  MONEY  FLOW  ...  28  

3.4.5  

C

OMMODITY  

C

HANNEL  

I

NDEX

 ...  28  

3.4.6  

RELATIVE  STRENGTH  INDEX  

...  29  

3.5  

MODELLING  ...  30  

3.6  

EVALUATION


...  31  

3.6.1  

C

ONFUSION  

M

ATRIX


...  31  

3.7  

DEPLOYMENT  ...  32  

3.8  

STRENGTHS  AND  LIMITATIONS  

...  32  

3.9  

OVERVIEW  ...  33  

4


IMPLEMENTATION  AND  R

ESULTS

 ...  

34  

4.1  

INTRODUCTION  

...

...  34


4.2


D

ATA  

P

REPARATION  AND  

E

XPLORATION


...  34  

4.2.1


DATA  

PREPARATION

 ...  34  

4.2.2  

FEATURE  EXPLORATION


...  37  

4.3  

MODELLING  ...  38  

4.4  

M

ODEL  

E

VALUATION


...  40  

4.4.1


FINANCIAL  S

ECTOR

 ...  42  

4.4.2  

TECHNOLOGY  SECTOR  ...  43  

4.4.3  

HEALTHCARE  

S

ECTOR  

...  44  

4.4.4  

I

NDUSTRIAL  

S

ECTOR


...  45  

4.5


OVERVIEW


...  45  

5  

EVALUATION


...

...

 47  

5.1  

RESULT  EVALUATION  

...  47  

5.1.1  

FINANCIAL  SECTOR  ...


47  

5.1.2  

TECHNOLOGY  SECTOR  ...  49  

5.1.3  

H

EALTHCARE  

S

ECTOR


...


51  

5.1.4  

INDUSTRIAL  SECTOR  

...  53  

5.2  

ANALYSIS  OF  R

ESULTS


...


54  

(8)

6


CHAPTER  6:  CONCLUSION  

...  57  

6.1  

RESEARCH  OVERVIEW  AND  GAP  

...  57


6.2


DESIGN

,

 IMPLEMENTATION,  AND  EVALUATION  

...  58  

6.3  

CONTRIBUTIONS  

...  59  

6.4  

F

UTURE  

W

ORK  AND  

R

ECOMMENDATIONS


...

...  59  

7  

BIBLIOGRAPHY  ...  61  

(9)

TABLE OF FIGURES

FIGURE  2.1  LITERATURE  REVIEW  LAYOUT  ...  8  

FIGURE  3.  1  DESIGN  AND  METHODOLOGY  LAYOUT.  ...  19  

FIGURE  3.  2  EBAY  BOLLINGER  BAND  VISUAL.  ...  28  

FIGURE  4.  1  BEAR  MARKET  OVERALL  CLOSE  PRICE  ...  35  

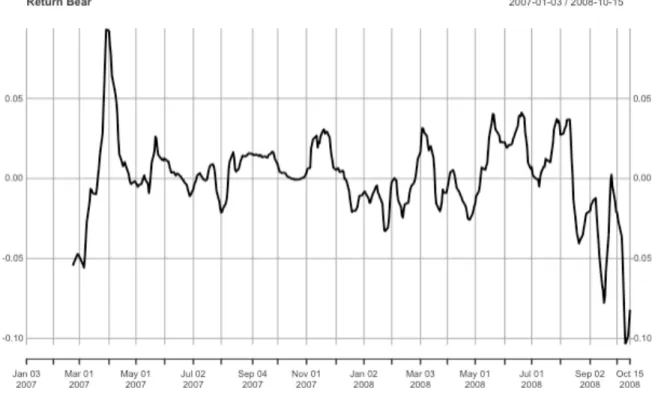
FIGURE  4.  2  INTEL  RETURN  VALUE  CLOSE  PRICE  USING  EMA.  ...  36  

FIGURE  4.  3  THREE  M  BULL  MARKET  CORRELATION  MATRIX    ...  37  

FIGURE  4.  4  THREE  M  BEAR  MARKET  CORRELATION  MATRIX  .  ...  38  

FIGURE  4.  6  MTRY  RANDOM  FOREST  ...  40  

FIGURE  5.  1  SVM  AND  RF  F1  SCORE  BULL  -­‐  FINANCIAL  SECTOR  .  ...  48  

FIGURE  5.  2  SVM  AND  RF  F1  SCORE  BEAR  -­‐  FINANCIAL  SECTOR  ...  49  

FIGURE  5.  3  SVM  AND  RF  F1  SCORE  BULL  -­‐  TECHNOLOGY  SECTOR  ...  50  

FIGURE  5.  4  SVM  AND  RF  F1  SCORE  BEAR  -­‐  TECHNOLOGY  SECTOR.  ...  50  

FIGURE  5.  5  SVM  AND  RF  F1  SCORE  BULL  -­‐  HEALTHCARE  SECTOR.  ...  52  

FIGURE  5.  6  SVM  AND  RF  F1  SCORE  BEAR  -­‐  HEALTHCARE  SECTOR  .  ...  52  

FIGURE  5.  7  SVM  AND  RF  F1  SCORE  BULL  -­‐  INDUSTRIAL  SECTOR.  ...  53


(10)

TABLE OF TABLES

TABLE  2.  1  TECHNICAL  INDICATORS    ...  11  

TABLE  2.  2  CONFUSION  MATRIX  .  ...  16  

TABLE  2.  3  CONFUSION  MATRIX  DEFINITIONS  ...  17  

TABLE  2.  4  PRECISION,  RECALL,  AND  F1  ...  17  

TABLE  3.1  STOCK  LIST.  ...  24  

TABLE  4.  1  FINANCIAL  SECTOR  -­‐  SVM  AND  RF  RESULTS  ...  42  

TABLE  4.  2  TECHNOLOGY  SECTOR  -­‐  SVM  AND  RF  RESULTS  ...  43  

TABLE  4.  3    HEALTHCARE  SECTOR  -­‐  SVM  AND  RF  RESULTS  ...  44  

TABLE  4.  4  INDUSTRIAL  SECTOR  -­‐  SVM  AND  RF  RESULTS    ...  45  

TABLE  5.  1  RECALL  SCORE  FOR  SVM  AND  RF    ...  55  

List of Acronyms

ADX – Average Directional Index

BB-

Bollinger Band

CCI – Commodity Channel Index

CMF – Chaikin Money Flow

EMA – Exponential Smoothing Average

MA – Moving Average

MF – Money Flow

RF – Random Forest

RSI – Relative Strenght Index

SMA – Smoothing Moving Average

S&P – Standard & Poor

(11)

1


INTRODUCTION

1.1


Bac

kground

Forecasting the stock market has proven to be a highly researched topic and incredibly

challenging problem. Predicting the stock market price, direction or next strategy has

proven to be increasingly profitable therefore, numerous traders, economists, financial

industries and academics form and create their own breakthrough strategy for this

forecast. However, they do not gain the profit range that keeps their approach ahead of

the market. Given its complexity, the attraction of minimizing risk and increasing odds

has brought much attention towards finding the best strategy. The reason for this is that

financial markets are highly influenced by noisy, non-linear, and non-stationary data

(Kim and Han, 2000; Handa, Hota, Tandan, 2015; Khaidem, Saha, Dey, 2016).

The world has witnessed major economic crashes in the market during the following two

periods; the great depression and the housing market crash. These major occurrences in

history caused the stock market to fall at its lowest triggering the trend of all stock prices

to fall, thus causing bear markets to erupt in the stock market.

1

The bear and bull market

names emerged when the markets followed the way in which the animals attack their

target. The bull market follows that of the attacking bull striking upward with its horns,

while the bear market follows the

downward swipe of the attacking bear. Though the

market collapsing caused stock prices to crumble, certain sectors were in desperate need

of assistance. This resulted in a desire for sector trends to be analysed and predicted to

gain insight for traders to buy or sell prior to another market crash.

1.2


Research Project/problem

The stock market has been an ideal place to build and maximize financial security for

the common businessman and investment companies. Strategies have been incorporated

into different analytical techniques in order to further the ability to forecast and be ahead

of the stock market. Though some strategists such as Stan Weinstein have profited off

the market following tactics that focus on a more technical strategy by using technical

(12)

trading strategies to understand when to buy and sell in a bull and bear market, many

other traders and strategists focus on fundamental market strategies (Weinstein, 1988).

In order to profit from the stock market, individuals analyse relationships regarding

economic occurrences and company information. As mergers evolve, financial crises

occur and currency rates change researchers have tried to find relationships within the

data available to build analytical models to strategically predict the stock price index

(Kim and Han, 2000).

As the market keeps evolving, research continues to expand on executing machine

learning models such as support vector machines and neural networks to maximize the

forecasting of the stock direction and price (Ou and Wang, 2009). However, due to the

diverse trading techniques and ever evolving economy, the focus has shifted towards

determining minimal error as well (Ou and Wang, 2009; Kim, 2003; ).

The overall research regarding the use of machine learning algorithms to predict the

stock price and direction with a higher accuracy and lower error based rate continues to

be ongoing as changes continue to take place within the stock market. Though many

strategists have focused on incorporating fundamental

factors such as price per earnings,

and technical features such as Bollinger Band into their models, few have taken the

initiative of integrating the “Bull and Bear” market period when incorporating a variety

of machine learning models (Cheng, Chen, and Wei, 2010; Khedkar and Argiddi, 2013).

By studying these trends one would be able to gain a better understanding and gain an

upper hand when investing. As expressed in greater depth in the next chapter, the general

research focus in this area has been into feature exploration such as technical indicators

and fundamental analysis

and the

efficient-market hypothesis (Fama,1970).

An

underexploited area of research can be seen where selecting specific technical indicators

used for predicating stock trends in a bear and bull market is concerned (Kannan, Seka,

Sathik,

Arumugam, 2010). A vast amount of research can be presented on the stock

market using machine learning algorithms. However, minimal research can be found on

specific ensemble models, or more specifically which model performs better; an

ensemble of decision trees or support vector machines?

(13)

This study will predict the stock price direction on a set of stock in various sectors to

determine the best performing sector

when utilizing a set of

technical indicators. To

obtain this goal, the following research question is presented:

Can a Support Vector Machine predict more accurately than a Random Forest in a bear

and bull market when forecasting stock price direction in specific sectors utilizing a set

of five technical indicators?

1.3


Research Objectives

Primarily, the aim of this research is to determine the forecasting capabilities of a support

vector machine and whether it will perform better than a random forest learning model

in forecasting the stock price direction in an upward market (bull) and a downward

market (bear). Though to keep in mind with the relevant No Free Lunch Theorem stating

no one model can be “better” than another due to the various parameters each model

provides (Wolpert and Macready, 1997), this goal will analyse the performance of these

models against that of the stock data as research has shown independently that both have

performed well in relation to other machine learning models. This study consists of a

variety of goals; utilizing five technical indicators to assist in forecasting the stock price

direction and also determining the performance of each sector in the bull and bear market

by only using historic price data.

The use of the technical

indicators will be to assist in

forecasting

the stock direction

movement and for presenting chart based visualizations.

Prior to implementing the

feature variables, a calculation of the return value will be formulated using a common

technical indicator;

the exponential moving average. As explored by Khaidem, Saha,

and Dey (2016) the process of using this the exponential moving average is to smooth

out the noise in the stock data which will be further discussed in the next chapter. Once

modelled, the support vector machine and random forest models will be evaluated using

the confusion matrix to identify accuracy, precision, recall and F1. This will provide the

results of the null hypothesis. The null hypothesis in this study is:

the random forest

model will perform with a higher accuracy when utilizing specific technical indicators

in both a bull market against a support vector machine.

(14)

To gain insight into the “better” performing model when used against the stock data the

following tasks will be implemented:


Study existing literature on stock market trends, stock market trading behavior,

market trends such as those of bull and bear, technical indicators, and machine

learning models to gain an in depth analysis of the research and tools used by

academics and traders alike.


Analyzing the data to split into train and test samples.

•  

Smoothing the data using the EMA technical indicator.


Calculate the return price in order to determine the difference in direction from

the initial close price.


Perform the feature selection and analysis of the overall data to clean and prepare

it for modeling.

•  

Build the models to implement the data into the support vector machine and

random forest models.


Evaluate the model performance by utilizing the confusion matrix and compare

the models using accuracy, precision, recall and F1.

1.4


Research Methodologies

This research is a collective set of data that is measurable by mathematical expressions

and quantitative methods. The mathematical models will consist of multiple machine

learning algorithms which will test the best accuracy and evaluation when forecasting

the stock price and direction. The data comprises of stocks acquired from Yahoo Finance

which is a commonly used source of financial knowledge. This analysis comprises of

empirical research as the different models will be testing the feasibility towards gaining

a direct resolution to the testable prediction. Due to the nature of this study, a substantial

portion of the research will be focused on observation and literature review. This study

will form an inductive approach of reasoning building on both analytical observation

and literature review.

(15)

1.5


Scope and Limitations

The scope of this study will cover two different periods in history to incorporate a “bear”

market and a “b

ull” market. The time periods will cover that of the housing crisis that

happened from 2007 to 2009. To gain an understanding of the performance of technical

indicators, stocks, and machine learning models, this time period was selected as it

provides a major dip in the stock market as the market crashed resulting in that of the

bear market and was in recession stage when coming into the bull market. This will

provide insight into the best performing sector to assist in learning if the models could

detect any trends when only utilizing technical indicators. This will also provide insight

into whether traders can accurately use only historic data in order to see if all sectors

perform badly when the stock market crashes or if one sector stays levelled throughout

the market crash. Thus, comparing the bear and bull market predictions will provide

insight into the effects of the market trend on specific sectors as well as the effects on

the machine learning algorithms. These insights could be useful in future where a trend

is starting to show the market falling into a bear market as

the investor or traders sell

and purchase based on the performance of sectors with little effect.

The bear market will be covered from January 01, 2007 to March 31, 2009. Although

initially the historic crash considered the bear or housing crisis collapsed the stock

market from October 9,2007 to March 9, 2009

2

(Lim, 2014), due to the short window

of time, an additional few months were added to avoid a lack of non-

applicable results

when incorporating certain feature selections. The second period of time will be from

April 1, 2009 until June 30, 2011 as the stock market changes into a bull trend. Within

these time periods, the bear market will be split between test data and training data and

the bull market will be split into test data and training data.

In addition to the time period, the experiment will cover four different sectors from the

S&P 500. These sectors will have four different stocks within each sector. These stocks

will be traded on the New York Stock Exchange and Nasdaq. The sectors are broken

down into Technology, Financial, Healthcare, and Industrial. A more in depth break

(16)

down of the stocks and sectors will be incorporated in chapter three; “Design and

Methodologies”.

1.6


Document Outline

Within this study a discussion of the following will occur:


Chapter two

– “Literature Review” will go deeper into the discussion of past

research compiled of different algorithms and approaches towards the

predication of stock market

price and direction. This chapter will outline the

various approaches commonly used by traders and researchers in order to ensure

a high level of accuracy when forecasting. This chapter will also include an

analysis of the reasoning behind the historic factors in today’s methodology

regarding stock market prediction while also integrating the contradictive

approach towards forecasting prediction price.


Chapter three – “Design and Methodology” will outline the method breakdown

of the experiment. Within this section of the study, the design portion will be

broken down into sections similar to the CRISP-DM to provide an in depth

understanding of the structure of the business ideology behind the study and will

also include the collection and preparation of the data. Within this section, a

special focus will be held on the feature selection that will assist in transporting

the data into qualified inputs and clarifying its strengths and limitations. The

remaining sections within this chapter will refine each mach

ine learning model

used.


Chapter four

“Implementation and Results” provides a breakdown of each

models implementation and the results of the four stages of the experiment

provided. The four stages will be running four different models evaluating the

acc

uracy and limitations of each.

•  

Chapter five

– “Analysis, and Evaluation” will be comprised of the four stages

of the experiment’s results along with the relevant research and analysis that has

been provided in the Literature Review. This chapter will encompass the

(17)

analytical aspect of the results while justifying the outcome of the hypothesis

based on the undertaken experiment.


Chapter six

“Conclusion” will be an overview of the completed study

incorporating the workflow process of the entire experime

nt focusing on the

limitations and scope of the stock market and forecasting research. This summary

will reiterate the initial research question discussed in chapter one and provide

areas for future work and recommendations.

(18)

2


LITERATURE REVIEW

With s

uch a vast amount of literature provided this chapter specifically addresses two

main parts of the overall study. These parts are focused on the financial background of

the stock market and the machine learning algorithms that will be implemented. This

cha

pter will be split into multiple sections and sub-sections in order to guide through the

assortment of approaches towards fo

recasting stock market prices. As seen in Figure 2.1

the sections will consist of; Trading Strategies, Market Types, Machine Learnin

g

Algorithms, and Evaluation.

While reviewing these sections the goal is to analyse

relevant work that has been researched within various financial markets utilizing

magnitudes of machine learning algorithms to gain a solid understanding of the

complexity

that follows predicting stock market prices. Due to the high complexity and

influential factors that incorporate the stock market a considerable amount of research

has concluded an array of hypotheses and theories. The research has shown a multitude

of factors which encompass the basis of the financial market and the workings of various

concepts behind the market. While many researchers have formulated intricate models

utilizing technical indicators to determine a pattern to forecast the stock price, others

have focused on researching and testing the Efficient Market Hypothesis (Arratia 2014;

Fama 1970). The Efficient Market Hypothesis is built on the basis that stock prices are

built on the relevant information present at the time of making an investment (Fama

1970; Nikfarjam, Muthaiyah, Emadzadeh 2010; Khaidem, Saha, Dey 2016).

(19)

2.1


Trading Strategies

Trading strategies are set by individual traders, financial institutions, and academics.

These strategies are complex and personalized based on the person or institution that is

trading (Ou and Wang, 2009). With a broad variety of trading approaches used in the

investment industry, the two best desired methods of invest

ing are Technical and

Fundamental analysis (Arratia, 2014; Atsalakis and Valavanis, 2009).

Although

technical indicators have proven profitable in research, a notable debate continues

among researchers as to w

he

ther technical indicators are enough to forecast trends in the

market

. T

echnical strategists

believe there is a pattern available in past prices (Austin,

Bates, Dempster, Leemans, Williams, 2004).

2.1.1


Technical Analysis

Though technical analysis is one of the major investing strategies it is also a com

mon

approach used toward forecasting stock prices and direction. The technical strategy is

primarily based on mathematical factors that follow a stock (Cheng, Che, Wei, 2010).

The mathematical analysis is initially based on the historical price of the stock. The

historical price stock would consist of open, close, high, low, volume, and adjust.

Although technical analysis is based on historical price, researchers such as Cheng et al.

(2010) express that investor psychology formulates the historical price

based on

investor’s response and actions toward price movements in the market, and so determine

that the high fluctuation of the market follows human expectations rather than following

a linear formation Cheng et al. (2010). To determine the human behavio

u

r which

influences trading stock and the trend of the stock, a commonly found charting type used

by technical strategists was created by Japanese Munehisa Homma in the 1700s. This is

called the candlestick chart and is used to analyse trends in the market

(Prado, Ferneda,

Morais, Luiz, Mastura, 2013). This charting process evolved into a charting technique

that is used to combine trading rules to that of the market trend. The use of this charting

technique in this study is to provide a visual understanding of the stock components of

both markets to distinguish a better understanding of the initial data

.

Historically, the use of technical analysis was said to be the most inefficient and highly

(20)

factors behind the investors emotions and rationality towards

various stocks (Neely,

Weller, Dittmar, 1997). This method goes against the Efficient Market Hypothesis as

this approach is said to follow economic factors and company rel

ated factors that are

represented in the current price (Fama 1970; Atsalakis and Valavanis, 2009) as opposed

to the use of historical values to build logically articulated formulas to determine

conditions in the price trends. With the vast variety of techn

ical trading techniques

provided in the field, researchers and traders use a combination of them for the purposes

of forecasting price movement and trend. Kanna et al. (2010) studied the use of five

technical analysis trading techniques to find patterns in

past trends. This study c

onsisted

of the typical price, Chaikin Money Flow indicator, Stochastic Momentum index,

R

elative Strength index and Bollinger B

and. While their research displ

ayed profitable

insight on the Bollinger Band and Stochastic Mo

mentum, o

ther academics found

striking results using the Relative Strength index, Stochastic Oscillator, Williams %,

Moving A

v

erage, Convergence, Divergence, Price Rate of Change, and on Balance

V

olume.

Taking into account the hundreds of technical indicators that academics and traders

have used, this study will cover a range of different technical indicators that have

provided profitability in various

studies. These indicators are; Commodity Channel

Index, Relative Strength Index, Bollinger Band, Chaikin Money Flow, Average

Directional I

ndex (Handa, Hota, Tandan, 2015; Khaidem, Saha, Dey, 2016; Kanna,

Sekar, Sathik, Arumugan, 2010, Kim, 2003). These technical indicators have been seen

to positively aid in

analysing

and forecasting the

stock price movement. Using a

combination of these indicators has been unexplored when looking into the period of a

major economic downfall such as that of the housing crisis. The below table will provide

(21)

Technical Indicators

Name

Definition

Formula

Chaikin

Money

Flow

Illustrates the money flow

within the stock

to

see the

volume of purchases and sales;

It assists in indicating a bullish/

bearish market; Utilizing a basis

of 20 days f

or calculations

𝐶𝑀𝐹  

𝑡

=

(

𝑡

𝐶𝑙𝑜𝑠𝑒

𝐿𝑜𝑤

𝐻𝑖𝑔ℎ

𝐶𝑙𝑜𝑠𝑒

𝐻𝑖𝑔ℎ

𝑉𝑜𝑙𝑢𝑚𝑒)/𝑉𝑜𝑙𝑢𝑚𝑒

)

)

𝑡


=


𝑛𝑢𝑚𝑏𝑒𝑟  𝑜𝑓


𝑑𝑎𝑦𝑠

Average

Directional

Index

Measurement of the trend

strength; Utilizing a basis of 14

days for calculation

Strong strength = higher value

Weak Strength = lower value

𝐴

𝐷𝑋

=

𝑆𝑀𝐴

[

+𝐷𝐼

𝐷𝐼

+𝐷𝐼

+

−𝐷𝐼

]

𝐷𝐼+=

𝐻𝑖𝑔ℎ

𝐻𝑖𝑔ℎ(−𝑡)

𝐷𝐼−=

𝐿𝑜𝑤

−𝑡

𝐿𝑜𝑤

−𝑡


=

 𝑑𝑎𝑦  𝑏𝑒𝑓𝑜𝑟𝑒

Bollinger

Band

Measures the unpredictable

trend for price movement

P(t) = Typical Price (Another

Technical indicator)

;Utilizing a basis of 20 days for

calculation

𝑀𝑖𝑑𝑑𝑙𝑒  𝐵𝑎𝑛𝑑


=

 20


𝑑𝑎𝑦


𝑜𝑓  

𝑡ℎ𝑒  𝑆𝑖𝑚𝑝𝑙𝑒  𝑀𝑜𝑣𝑖𝑛𝑔  𝐴𝑣𝑒𝑟𝑎𝑔𝑒  

𝐿𝑜𝑤𝑒𝑟  𝐵𝑎𝑛𝑑

=

𝑆𝑀𝐴

+

(

𝜕×2)

𝑈𝑝𝑝𝑒𝑟


𝐵𝑎𝑛𝑑  

=


𝑆𝑀𝐴

 –

 (𝜕𝑥2)

(𝜕)


=


𝑡ℎ𝑒  20  𝑑𝑎𝑦  𝑜𝑓  𝑡ℎ𝑒  𝑐𝑙𝑜𝑠𝑒  𝑝𝑟𝑖𝑐𝑒

Commodity

Channel

Index

Adaptable indicator for trends in

the market or major crashes

P(t) = Typical Price (Another

Technical indicator)

𝑃

(

𝑡)


=

 𝐻𝑖𝑔ℎ  

+


𝐿𝑜𝑤  

+

 𝐶𝑙𝑜𝑠𝑒

/

3    

𝐶𝐶𝐼  

=


(1/0.015)𝑥(

(

𝑃(𝑡

)

𝑆𝑀𝐴

𝑃

𝑡

(𝜕(𝑃(

𝑡

))

)

Relative

Strength

Index

Momentum

indicator

to

determine if a stock is oversold

or

overbought;

strength

indicator of trend; Utilizing a

basis of 14 days for calculation

𝑅𝑆


=


𝑆𝑚𝑜𝑜𝑡ℎ𝑖𝑛𝑔  𝑀𝑜𝑣𝑖𝑛𝑔  𝐴𝑣𝑒𝑟𝑎𝑔𝑒

𝑈,

𝑛

𝑆𝑚𝑜𝑜𝑡

ℎ𝑖𝑛𝑔  𝑀𝑜𝑣𝑖𝑛𝑔  𝐴𝑣𝑒𝑟𝑎𝑔𝑒  (𝐷,

𝑛)

𝑅𝑆𝐼

=

 100

(  

100

1

+

𝑅𝑆

 )  

Table 2.

1

3

displays the technical indicators implemented in the study. The table provides

the mathematical formulas behind each of the technical indicators.

(22)

2.1.2  

Fundamental Analysis

Although this study uses only the technical approach to understanding the stock

movement in a bull and bear market, it is important to review fundamental as it has been

argued that it can provide insight into market trends which will be a major aspect of this

experiment.

As technical analysis formulates on historical stock prices and mathematical formation,

fundamental analysis follows a vastly different concept. Macroeconomic data is the

basis for fundamental analysis (Atsalakis and Valavanis, 2009). Referenced in the

previous sections of this chapter, the concept of the EMH was said to follow a

fundamental analysis methodology toward the relevant

change in price.

This approach states that any economical change will be fully reflected in the price of a

stock. The ideology behind fundamental analysis is said to reflect macro-

economical

changes within a sector in the price. The past prices of any s

tock would refrain from

holding any pattern as the historical price would not display current changes in the

market or sector. The current price would be the only imitative of the change in the

market (Enke and Thawornwong, 2005).

2.2


Market Trends and

Behavi

oural

Investment

With the complexity of the market and non

-

linearity, research was expanded into the

area of psychology and looked into examining the combination of market trends and

investor behavio

ur. The psychological behaviour of following the market trend is seen

as “herding” or “crowd effects” (Cont and Bouchaud, 2000; Bikhchandani and Sharma,

2001; Prechter. Jr , 2001). Herding

behaviour, a psychological behaviour that consists

of following another person or a group of peoples actions (Clement and Ts

e 2005, Cont

and Bouchaud, 2000; Bikhchandani and Sharma, 2001; Prechter. Jr , 2001). Herding has

been seen to have a volatile effect on the market trend when investors routinely follow

each other’s decisions in the hopes of increasing revenue or to

avoid

any

loss of revenue.

Herding is considered to follow hand in hand with fundamental analysis as an investor

(23)

can make a quick decision based on an economical change causing a sudden change in

the purchase or selling of a stock (Bikhchandani and Sharma, 2001).

Although herding has been found in the changes of the stock price, a reflection of

herding in the peaks of market stage such as that of a bull or bear market are still being

researched (Christie and Huang,1995). Shiller (1987) studied the correlation between

investors’ behavio

u

r and the stock market crash which found supporting evidence that

the influx and fear of an investor is present when analysing market trends such as the

1987 stock market crash.

Analysing the market trends with

an investigation i

nto

behavioural investing

could be a further area of research

.

As investors continue to buy

and sell in a “herd” like behavio

u

r, the

market sees a reflection of sudden movement.

These movements are seen a bear and bull market. The following sections will e

laborate

on the meaning of a bull and bear market trend.

2.2.1  

Bull and Bear Market

A bull market is when a set of stock prices are increased and continue to increase on the

market. This trend is when investors believe that the market will continue to rise so they

keep purchasing which increases the price of stock thus providing a trend in the upward

direction of the stock market. The market displays a “bullish” type market when returns

of the stock are at a high and little volatility is displayed (Maheu and McCurdy, 2000).

A bear market is the opposite to that of a bull market. A bear market is the decreased

and continual downfall of the stock price. This is when an investor starts increasing the

selling of stock and volume of stock to avoid the loss of value.

A bear market can be

seen when there is a sense of irrationality around stock selling due to fears from investors

resulting in a drastic decrease in stock price (Day and Huang,1990).

2.3


Machine Learning

Machine learning is a type of strategy used to distinguish patterns in data. There are

multiple forms of machine learning such as supervised, unsupervised and

semi-supervised algorithms. Researchers have approached the stock market price direction

utilizing an assortment of supervised machine learning algori

thms. Supervised

algorithms are learning models built based on a relationship between dependent and

(24)

1983). Recently machine learning has become a widely used

component in

many sectors

in industry across the world. A considerable amount of studies have been completed to

forecast stocks using a variety of machine learning and data mining techniques to gain

insight into

the complexity of the non-linear trends (Francis and Tay,

2003; Hsieh, Yang,

Wu, 2006; Huagn, Nakamori, Wang, 2005; Khaidem, Saha, Dey, 2016; Ou and Wang,

2009; Kim, 2003; Enke, Thawornwong, 2005).

The use of machine learning has

provided the ability to build models using separate areas of focus such as those of

technical analysis which will be further discussed in this subsection to other forms of

models such as textual analysis following a fundamental approach. Researchers found a

variety of different supervised machine learning algorithms such as Artificial Neural

Networks, Support Vector Machines, Decision Trees, Logistic Regression, Naïve

Bayesian, and Random Forest (Francis and Tay, 2003; Hsieh, Yang, Wu, 2006; Huagn,

Nakamori, Wang, 2005; Khaidem, Saha, Dey, 2016; Ou and Wang, 2009; Kim, 2003;

Enke, Thawornwong, 2005) which could aid in forecasting stock price and price

direction.

Though many academics have performed the desired task of predicating stock price

return, stock price movement and stock trends using a variety of models, the No Free

Lunch theorem states that though one researcher found one model to work the “best,”

this specified model may not perform better than another particular model when

analys

ing a similar but different question (Wolpert, Macready, 1997

). This theory asserts

that each model has their own strengths and limitations with a variety of data. Thus, it is

important to ensure that the models are built using parameters that are appropriate

to

their predicting abilities when applied to dependent and independent variables.

2.3.1


Support Vect

or Machine

s

The support vector machine is an error-based learning model used in a wide collection

of literature when forecasting stock price and price movement (Ou, Wang, 2009; Huan,

Nakamori, Wang, 2005; Kim, 2003; Hsu, Hsieh, Chih, Hsu, 2009; Cao, Tay, 2003; Pai,

Lin, 2005). Huang et al. (2005) explored the support vector machines capabilities of

predicting the price movement against other machine learning algorithms and found that

the SVM forecasted a higher accuracy due to the minimal “structural risk” rather than

(25)

in comparison to the Elman Backpropagation Neural Network or Linear Discriminant

Analysis. With a vast set of parameters available for SVM model training,

a process

used by Kim (2003) displays the use of polynomial and radial basis kernels.

I

f

improperly used, the SVM parameters such as the kernel and C can cause the predictive

model to over-fit or under-fit. A focus across literature for classification SVM models

has been the consistent use of the radial kernel based learning strategy. This is a

parameter for the kernel function for the training stage of the algorithm (Huang,

Yoshiteru, Nakamori, Wang, 2005; Ou, Wang, 2009; Pai, Lin, 2005). Another focus in

the literature was set on the C and gamma parameters of the SVM model. These

parameters ranged in value size based on the dataset acquired for the overall goal of

forecasting the stock price or the stock price direction.

2.3.2  

Random Forest

The random forest model is an ensemble model made up of multiple decision trees. The

random forest model is an information based learning model built based on regression

data or classification. A combination of academics have used either decision trees, or a

random forest ensemble model for the purposes of classification. Ou and Wang (2009)

utilized a type of decision tree called tree based classification as this form of decision

tree is optimized by using various objects in the dependent variable from measuring on

multiple in

dependent variables. Though this type of model optimized well in Ou and

Wang’s research, other academics have found that utilizing the ensemble random forest

provided a higher set of performance results when forecasting stock movement

(Khaidem, Saha, Dey,

2016). The random forest model optimizes when building the

decision trees and splitting at the mode of each output for each single tree. Khaidem et

al. (2016) build their random forest using the splitting option of the Gini impurity.

2.4


Evaluation

The evaluation stage of the model will provide an understanding of the overall accuracy

levels of the model. The evaluation stage will provide a level of efficiency and specify

a range of results that are beneficial for future works on the model against the tested

data. Similar to that of the machine learning models, the range of evaluation methods

used to gauge the performance of each model execution has been seen as diverse in the

(26)

process and proceed to provide results, the following popular classification evaluation

metric; the confusion matrix, will be utilized.

2.4.1  

Confusion Matrix

A commonly used evaluation method in supervised machine learning for classification

models is the confusion matrix. This matrix is used on a predictive model against a set

of data taken from the dataset specifically for testing purposes. This evaluation process

provides a large range of performance methods to emphasize the performance of the

model.

The following table

displays the range of measures used to calculate the

performance.

Confusion Matrix Table

Target

Prediction

Positive

Negative

Positive

True Positive

False Negative

Negative

False Positive

True Negative

Table 2.

2

illustrates the confusion matrix table providing a visualization on how the

measures work.

Each measure; true positive, false negative, false positive, and true negative are

measurements that calculate the frequency of each of the outcomes available for the

prediction of the target feature. This matrix measurement provides two different ways

the predictive model can analy

se the correct and incorrect predictions from the test set.

The below table explains the measure meanings for each of the outcomes possible.

Measure Meanings

Measure Name

Meaning

True Positive (TP)

Reflects the target feature in the test set that was positive

and forecasted as positive

True Negative (TN)

Reflects the target feature in the test set that was

negative and forecasted as negative

False Positive (FP)

Reflects the target feature that was negative and

forecasted as positive (Type One Error )

(27)

False Negative (FN)

Reflects the target feature that was positive and

forecasted as negative (Type Two Error)

Table 2.

3

elaborates on the measure meanings for each of the correlation prediction

measurements.

From the confusion matrix a set of three performance measurements are commonly used

in literature (Khaidem et al. 2016). These measures are; Precision, Recall and F1 score.

The following table will provide a brief description and display of their formulas:

Performance Measures

Measure Name

Meaning

Formula

Precision

Measures the forecasted

positive target levels over all

of the actually predicted

positive level

𝑃𝑟𝑒𝑐𝑖𝑠𝑖𝑜𝑛  

=


𝑇𝑟𝑢𝑒  𝑃𝑜𝑠𝑖𝑡𝑖𝑣𝑒

𝑇𝑟𝑢𝑒


𝑃

𝑜𝑠𝑖𝑡𝑖𝑣𝑒

+

𝐹

𝑎𝑙𝑠𝑒


𝑃

𝑜𝑠𝑖𝑡𝑖𝑣𝑒  


Recall

Is a measurement of the

sensitivity of the predictive

model; measures the calculated

positive features forecasted and

the number of positive features

forecasted over all

𝑅𝑒𝑐𝑎𝑙𝑙

=

𝑇𝑟𝑢𝑒

 𝑃𝑜𝑠𝑖𝑡𝑖𝑣𝑒

𝑇𝑟𝑢𝑒  𝑃𝑜𝑠𝑖𝑡𝑖𝑣𝑒

+

𝐹𝑎𝑙𝑠𝑒


𝑁𝑒𝑔𝑎𝑡𝑖𝑣𝑒

F1

Measures the misclassification

of the predicating model and

combines the performance

measures of Precision and

Recall

𝐹1

=

 2  

𝑥


𝑃𝑟𝑒𝑐𝑖𝑠𝑖𝑜𝑛


𝑥

 𝑅𝑒𝑐𝑎

𝑙𝑙

 (𝑃𝑟𝑒𝑐𝑖𝑠𝑖𝑜𝑛  

+

 𝑅𝑒𝑐𝑎𝑙𝑙)


Tabl

e 2.

4

demonstrates the formulas and definitions of the performance measures utilized

by the confusion matrix.

This process was taken from the

performance matrix by Khaidem et al. (2016) to

evaluate their ensemble model’s performance when forecasting the stock market price

direction for a time series.

(28)

2.5


Overview

With a variety of variables behind stock prices, investors and academics continue to find

what is considered the “best” strategy toward

s

getting ahead of the market and

f

orecasting patterns utilizing past stock data. This desire has provided a scope of research

overlooking the varied areas in finance and in machine learning. Researchers have

implemented machine learning models such as support vector machines

to analyse the

non

-

linearity of the stock price and forecast the future price movement. This scope

covers a range of complexity behind what influences the stock trend, what are trading

strategies and what models perform well with time series type data. Academics have

found a range of algorithms that produce high level of accuracies but with a varied set

of parameters and featured variables. Thus following the No Free Lunch theorem that

not one model can be considered as the best model for this dataset,

a study will be

conducted against two models found in the literature review that proved to be notable

when forecasting stock price direction, but have not been tested against a combination

of technical indicators in two types of market trends. The drive behind this experiment

provides another insight

into

two high

performing predictive models in a bull and bear

market using a set of technical indicators to determine if one of these models predicts

more accurately than the other in forecasting the stock price direction in specific sectors.

The

following research question will be assessed in the following chapters of this study.

Can a Support Vector Machine predict more accurately than a Random Forest in a bear

and bull market when forecasting stock price direction in specif

ic sectors utilizing a set

of five technical indicators?

The following chapter “Design and Methodology” will provide a step by step walk

through of the processes of the experiment.

The chapter will provide

the

scope of the

business objective, the data understanding, data preparation,

modelling

, evaluation,

deployment, strengths and limitations.

(29)

3


DESIGN AND METHODOLO

GY

3.1


Introduction

This stage of the study will cover the design and methodology approach of the

experiment. This chapter will explore the Cross Industry Standard Process for Data

Mining (CRISP-DM) strategy towards handling the data associated with the research

and experiment (Kelleher, Mac Namee, D’Arcy, 2015). Many researchers have

incorporated this formation into their studies in order to keep a clean process in the steps

and overall workflow of the experiment. It provides the ability to understand the step to

step sequence as well as providing better capabilities in terms of the future reproduction

of the study.

The following chapter

will b

e broken down as seen below:

Figure 3. 1 provides an overview of the Design and Methodology chapter reviewing main

aspects of the data, feature extraction, modelling, and evaluation stages. The processes are

key toward forecas

ting the direction of the stock price in a bull and bear market.

Business Understanding: The business understanding will provide the business goal.

(30)

experiment,

it is crucial to have a theoretical understanding of the business problem in

order to build an analytical strategy towards solving the research problem.

Data Understanding:

The data understanding stage will transform the business

objective into an analytical objective. This will involve gaining a thorough

understanding of the stock market data that the study will focus on. Along with

understanding the data in a conceptual manner, this section will cover the company

selection process of the data, where the data is acquired from and the different variations

of the sectors that the stock data can come from.

Data Preparation: The data preparation stage will transform the acquired data into the

correct parameters for the machine learning algorithms that will be utili

zed in this study.

This preparation stage is important as it will include the technical indicators that were

previously mentioned in the literature review.

Modelling: The

modelling

stage integrates

the data and the machine learning models.

This section

will discuss the chosen models and their development stage.

Evaluation: The evaluation stage is the most important stage of the CRISP

-

DM process

and the experiment process as it will provide the accuracy of the models and the overall

findings of the study.

Deployment: The deployment stage is the final stage of the CRISP

-

DM as it will

analyse

the scope and limitations of the study and also assess the necessary adjustments for the

experiment that need to be implemented into real time stock trading.

Stren

gth and Limitations:

The strength and limitations section will discuss the

strengths and the weaknesses of the design solution.

3.2


Business Understanding

Stock market investing, as seen in the Literature Review, has been and continues to be

a highly desired way to increase gains and receive financial security. Given the vast set

of investment strategies and parameters

presented,

the primary aim of this study

is to

(31)

determine stock price movement using technical indicators with specific parameters to

determine if stocks in a specific sector perform better or worse in the bear or bull market.

As previously mentioned, a crash in the market such as that expressed in a bear market

can cause major financial indiscretions to a company and its investors. In the hope of

gaining insight on stock price movement and predicting the transition of a downward

trend, this study transforms into an analytical perspective that targets the price trend

using machine learning models.

3.2.1


Business Goal

The business goal of this study is

to assist in detecting the trends of the stock market

movement in specified sectors using a set of stocks based on a return algorithm which

utilizes a technical indicator for calculating the return. The additional parameters will

operate a variety of appropriate technical indicators that were briefly covered in the

Literature Review and will be further studied in the Data Preparation stage of this

chapter. This study will determine the stock market price behaviour in each sector in the

specified market type bull or bear. With this goal the study will implement the analytical

aspect to operate supervised machine learning models to determine accuracy in

forecasting the direction of the stock price. Providing the aim of the study the hypothesis

is constructed: The support vector machine model, trained using the stock dataset, will

perform at a higher accuracy than that of the random forest in each sector in both a bull

and bear market.

To limit the volatility of the outcome of the various sectors in each mark

et time, the

parameters will be limited to any adjustments per sector. The models will fit each stock

in their respective sector and will be based on one set of parameter type when running

the technical indicators and the models.

3.3


Data Understanding

This

section of the

chapter will analyse the company selection process and company

stock data. The section will analyse the processes for picking the stocks and what the

(32)

3.3.1


Company Selection

With an immeasurable amount of company sto

cks and trading markets to choose from,

this study focuses on an index in order to pick equally equipped companies. The index

chosen is known as the Standard & Poor U.S indices which contains a subdivision

commonly known as S&P 500 index.

4

This index consists of the largest 500 companies

capitalizing within an equal range for the market cap unlike those of the Dow Jones

Industrial Average. The S&P 500 focuses on the largest companies based within their

respective sector. Within these sectors the S&P 500 contains a range of the top 50 largest

capitalized traded companies that are included within their 500 “constituent” companies,

meaning companies that are merged or consolidated and can be a

subsidiary of a larger

company. Companies held within the S&P 500 index are publicly traded stocks and are

focused on price index versus total return index.

3.3.2  

Company Stock Criteria

For this study, the companies that were chosen from the S&P 500 index sectors must

have maintained their standing on the S&P 500 list for the

duration of the experiment.

This ensures that they were within the criteria of market capitalization size, liquidity,

domicile, eligible securities, and sector classification.

The

market capitalization size is valued and maintained at a United States ma

rket price

of 6.1 billion dollars or more as per referenced from the S&P U.S Indices Methodology

provided from the S&P Dow Jones Indices: Index Methodology (2017). The liquidity

criteria follows that the company stock shall be traded at

a

reflected reasonable price

reflecting that of the adjusted close with the historical volume quantity. In relation to

this key criteria requirement, it is essential to note that liquidity follows a specific set of

technical strategy tools as it specifically reflects price with historical volume size

following that of technical indicators. Domicile requires that the U.S companies follow

a set of three specific rules such as filing 10-k annual reports, fixed assets, revenue

plurality and their listing must be on a U.S exchange. Domicile is crucial to the study as

it maintains that the companies chosen are U.S based companies and are traded within

U.S based exchanges such

as

the New York Stock Exchange and NASDAQ. In addition,

(33)

the

third rule follows that of the criteria requirement

-

eligible securities. The eligible

securities criteria

ensures

that the company stock is traded within a U.S exchange

market. This stipulates that the company stocks are traded at the same currency value.

For this study each company chosen within the

ir respective sector are traded on U.S

exchanges and are traded at the U.S dollar value. This constraint is significant in the fact

that any effects to the economy are equally reflected in the value of the stock. As

previously mentioned in chapter two, economical effects are triggers for trends such as

the bear or the bull market. Sector classification is a contribution toward

s the balance of

the sector weight. This contribution maintains a balance of the market capitalization

range for the companies within their respected sectors. As this studies data is separated

by sector to gain knowledge on the best performing sector when forecasting stock price

trends, this criteria emphasizes the equality in company value within their sector. This

removes smaller market capitalized companies within specified sectors which avoids an

unequal lack of trade and trade value.

3.3.3  

Company Stock Data

From the S& P 500 list a set of sectors were

analysed to make a selection of the specified

sectors

that

this study will explore

. The analysis will be conducted over a set of 4

different sectors containing stocks for 4 different companies per sector. The sectors that

were chosen for this study are the following: Finance, Technology, Healthcare and

Industrial. These sectors provide a

wide range of focus to conduct the hypothesis. A

conclusive break down is displayed below in table 3.1.

Figure

Figure 2.1 illustrates the layout of the following literature review
Table 2. 1  3 displays the technical indicators implemented in the study. The table provides  the mathematical formulas behind each of the technical indicators
Table  2.  3  elaborates  on  the  measure  meanings  for  each  of  the  correlation  prediction  measurements
Figure 3. 1 provides an overview of the Design and Methodology chapter reviewing main  aspects of the data, feature extraction, modelling, and evaluation stages
+7

References

Related documents

Authorizers emphasized those schools most successful “hire the right leaders, and hire the right teachers.” Furthermore, they put into place long-term, intentional

In this scenario, three related statistical questions are important to making progress towards an objec- tive assessment of the worthiness of microarray analysis results:

Considering that there is no specific research conducted to analyse the relationship between these economic variables in the context of ASEAN countries thus far,

From 2010 to 2014, Martin focused on his PhD research at TU Delft concerning the assessment of the potential of the partnering approach in maintenance and refurbishment projects

“Strategy & Tactics for Boosting Direct Mail Response” is the first in a new "Response Rules" series from Direct Marketing IQ and it will be your guide to getting the

From the results, we can articulate that in the Indian organized grocery setup today’s consumer knows what she has come for in a store and don’t bother much about the entrance,

Thus, the results also confirm previous findings from Castillo and Gayme (2014: 892) that market and regulatory challenges now arise as significant barriers for

Seventy percent of the state’s higher education students are enrolled in a community college, making the California Community Colleges system the nation’s largest workforce