ACIS 2009 Proceedings
Australasian (ACIS)
12-1-2009
IT Support for Core Competencies: Development
and Validation of a Research Instrument
Joerg-Rene Paschke
School of Business Information Technology RMIT University, [email protected]
Follow this and additional works at:
http://aisel.aisnet.org/acis2009
This material is brought to you by the Australasian (ACIS) at AIS Electronic Library (AISeL). It has been accepted for inclusion in ACIS 2009 Proceedings by an authorized administrator of AIS Electronic Library (AISeL). For more information, please [email protected].
Recommended Citation
Paschke, Joerg-Rene, "IT Support for Core Competencies: Development and Validation of a Research Instrument" (2009).ACIS 2009 Proceedings.Paper 64.
IT Support for Core Competencies: Development and Validation of a
Research Instrument
Joerg-Rene Paschke
School of Business Information Technology RMIT University
Melbourne, Australia Email: [email protected]
Abstract
This paper presents a validated construct that measures IT’s ability to support organisations’ core competencies. In doing so, it aims to address a call in IT literature to modify and validate a previously presented concept of IT support for core competencies. This research paper presents a rigorous instrument development process to modify the previously presented IT support for core competencies construct. Afterwards, this study utilises structural equation modelling (SEM) techniques and confirmatory factor analysis to validate the revised construct of IT support for core competencies. The result of this paper is a validated measurement model for IT support for core competencies that can be utilised in further research.
INTRODUCTION
Contemporary research on the impact of information technology (IT) on competitive advantage has been profoundly influenced by the resource based view (RBV) of the firm (Barney 1991; Wade & Hulland 2004). In this view, firms’ main source of value creation stems from rare, valuable, heterogeneous, and hard to imitate resources (Barney 1991). The RBV further distinguishes between input oriented resources, capabilities that combine resources (Amit & Schoemaker 1993) and (core) competencies (Prahalad & Hamel 1990). Even though several researchers have drawn from the RBV to examine the potential of IT to provide firms with competitive advantage (Wade & Hulland 2004), only few have investigated how IT can enable organisational core competencies (Ravichandran & Lertwongsatien 2005). This perspective allows researchers to investigate IT’s ability to provide competitive advantage by forming value-adding, heterogeneous and hard to imitate complementary relationships with organisational competencies. Despite its ability to offer valuable insights into the IT – competitive advantage relationship and previous attempts to establish a measurement construct for IT’s ability to support organisational competencies (Ravichandran & Lertwongsatien 2005), no validated construct exists to measure IT’s support for various functional competencies. In their study, Ravichandran and Lertwongsatien (2005) proposed a construct labelled IT support for core competencies. This construct consists of three variables: IT support for market-access competency, IT support for integrity-related competency and IT support for functionally-related competence. Using PLS to assess this measurement model, IT support for integrity-related competency failed the nomological network and calls have been made to provide further empirical evidence and theoretical support for such a construct (Ravichandran & Lertwongsatien 2005). This study aims to address this research gap and intends to add to the body of knowledge in several ways. Firstly, this paper seeks to answer Ravichandran and Lertwongsatien’s (2005) call to further determine if the IT support for integrity-related competency variable fits into the IT support for core competencies construct by presenting a validated measurement model that includes such a variable. Secondly, this paper extends previous research on IT and competitive advantage from the RBV by introducing a revised, extended and validated measurement model that measures how IT can support firms’ functional competencies (market-access, functionally-related, integrity-related and network-integrity-related). Finally, this paper presents the results of an exploratory study that measures the extent of this IT support for core competency construct among Australian companies.
The paper is organised as follows. Firstly, the theoretical background based on a review of previous research is presented. Secondly, a research model is presented and the methodology explained. Thirdly, the validation of the measurement model for the IT support for core competencies construct is discussed. Finally, conclusions are drawn and suggestions for future research presented.
THEORETICAL BACKGROUND AND FRAMEWORK
The resource-based view (RBV) has been utilised to examine IT and competitive advantage and to explain the ‘productivity paradox’ regarding the strategic impacts of IT (Clemons & Row 1991; Feeny & Willcocks 1998; Ravichandran & Lertwongsatien 2005; Wade & Hulland 2004). It has been recognised as a cogent framework with which to evaluate the strategic value of IT (Santhanam & Hartono 2003). Furthermore, the RBV enables the investigation of the different impacts of IT resources, capabilities and competencies on competitive advantage (Wade & Hulland 2004).
Three key concepts are used in the IT and competitive advantage literature that draw from the RBV: IT resources, IT capabilities and IT support for core competencies. However, the IT literature is not always consistent on what is regarded as an IT resource, IT capability or IT support for core competence. Classifications in IT research range from using simple terminology such as the terms IT resources / IT assets (e.g. Ross, Beath & Goodhue 1996) to describe all IT-related constructs, to more sophisticated classifications that differentiate between input-based resources, transformational and managerial capabilities and output-based competencies (e.g. Ravichandran & Lertwongsatien 2005; Wade & Hulland 2004). This is, indeed, similar to the use of concepts in the generic resource-based literature, in which the terms resources, capabilities and competencies are often used interchangeably. The precise definitions of IT resources, IT capabilities and IT support for core competencies vary throughout the IT literature. Overall, however, research on the RBV of IT and competitive advantage has explored two major themes: firstly, IT’s ability to produce complementarities with organisational resources as a source of competitive advantage; secondly, IT’s intangible aspects, such as managerial or personnel skills, and how they can leverage IT resources to create competitive advantage.
What makes IT a source of sustained competitive advantage for firms is its ability to leverage differences in strategic resources (Clemons & Row 1991). Firms that manage to utilise IT to leverage structural differences, such as the quality and organisation of key resources or vertical integration and diversification, will be able to achieve competitive advantage from their IT (Clemons & Row 1991). In other words, IT by itself is necessary to compete in the business but does not provide competitive advantage. IT can be a source of competitive advantage if it leverages firms’ strategic resources through complementary relationships with other firm assets, business processes, capabilities or competencies. In their study, Powell and Dent-Micallef (1997) focused on the retail industry and IT’s ability to leverage other intangible, complementary human and business resources. The results were similar to the findings of Clemens and Row (1991) and supported the strategic necessity hypothesis of IT and the notion of the indirect effects of IT on competitive advantage through intangible, complementary human and business resources (Powell & Dent-Micallef 1997).
This logic of resource complementarities has been adopted by many researchers and argues that organisations that complement IT with other organisational resources have a better chance of defending their IT-derived competitive advantage against competitors (Bharadwaj 2000; Clemons & Row 1991; Feeny & Willcocks 1998; Mata, Fuerst & Barney 1995; Tippins & Sohi 2003). IT alone does not impact firm performance, but a number of firms have been seen to gain competitive advantage when they used IT to leverage other organisational resources (Powell & Dent-Micallef 1997).
Ray et al. (2005) empirically assessed the role of IT on the customer performance process and found that IT resources do not explain variations in process performance unless they are tacit, socially complex and firm-specific. In so far as organisational resources and processes are often unique, this further complicates imitation of the blending of IT with organisational resources (Bharadwaj 2000). This interaction is typically analysed in the IT research literature using multiplicative terms in statistical analyses to examine whether the presence of one resource enhances the value of another (Ravichandran & Lertwongsatien 2005). Powell and Dent-Micallef (1997), for example, measured the effect of complementarities between human resource practices and IT use on retail store performance with interaction terms. Another conceptual approach is the work of Ross, Beath and Goodhue (1996), who define three IT assets (human resources, technology and relationships) and argue that these IT assets, in combination with IT processes, could lead to sustained competitive advantage. The results of their study enhance the notion of its complementary impact on firm performance. Ross, Beath and Goodhue (1996) used the term IT assets to denote assets, personnel and relationship assets, and IT processes to refer to IT planning, delivery, and operations and support processes. They focused on how the interplay between IT assets and IT processes creates business value. Bharadwaj (2000) adopted a similar categorisation but included IT infrastructure (physical IT assets), IT human resources (technical and managerial skills) and IT-enabled intangibles (knowledge assets, customer orientation and synergy) as IT resources.
This classification ignores the different levels of IT resources. Rather than being on the same level as IT infrastructure and IT human resource skills, IT-enabled intangible organisational resources are enabled through the former two resources (Bharadwaj 2000). Consistent with the findings of previous scholars (Clemons & Row 1991; Powell & Dent-Micallef 1997), IT is found to only affect firm performance if it is embedded, so that it can
provide sustainable resource complementarities with firms’ intangible organisational resources (Bharadwaj 2000). This notion is also the basis for works which investigate IT’s effect on competitive advantage through IT’s potential to support organisational competencies. This is captured in the concept of IT support for core competencies (Ravichandran & Lertwongsatien 2005).
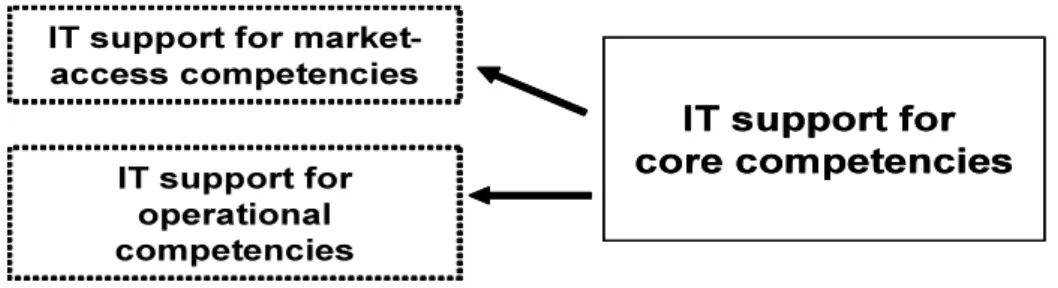
The construct IT support for core competencies is a higher order resource and reflects the degree to which IT supports organisational competencies. The understanding of IT support for core competencies is based on and extends work of Ravichandran and Lertwongsatien (2005). The constructs consists of two variables: IT support for market-access competencies and IT support for operational competencies. Figure 21 below illustrates the theoretical framework of this paper.
Firstly, IT support for market-access competencies is similar to two of Ravichandran and Lertwongsatien’s (2005) variables. Because establishing connections with customers incorporates both, the ability to identify their needs and meeting them through customised products and services, the variable IT support for market-access competence of this paper consists of both, the ability to enable IT support for market-access competencies and the ability to enable functional related competencies. Hence, IT support for market competencies enhances organisational market access and the functionally related competencies of firms.
Secondly, IT support for operational competencies is to some degree similar to Ravichandran and Lertwongsatien’s (2005) proposed variable of IT support for integrity-related competencies. It reflects IT’s potential to activate a variety of organisational competencies. These include knowledge management, operational efficiency, cross-functional integration, product development, innovation processes and other business processes.
METHODOLOGY
An important assumption in positivistic research is that the research instrument contains constructs which consist of items that have an equal amount of common core and ensure an error-free operationalisation of the construct (Churchill 1979). A clearly defined item development process must ensure that the content validity has provided a pool of items that theoretically should operationalise the constructs. The following section discusses the instrument design of this study, which is based on the Churchill’s (1979) proposed method and is followed by an outline of the data collection procedure of this study.
INSTRUMENT DESIGN
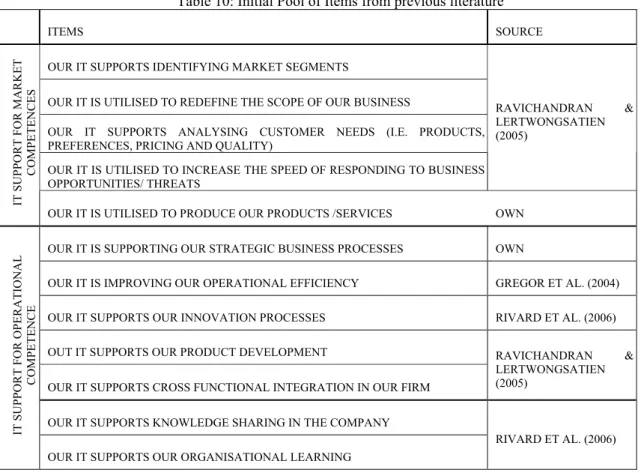
In order to quantify and validate the IT support for core competence framework it has to be operationalised through a research instrument. The rigorous development of a reliable and valid research instrument minimises the measurement error. One way of achieving a low measurement error is to draw from existing research instruments. A representative number of items were pooled from existing research instruments (Gregor et al. 2004; Ravichandran & Lertwongsatien 2005; Rivard, Raymond & Verreault 2006). The initial pool of items is presented in Table 1 below.
Table 10: Initial Pool of Items from previous literature
ITEMS SOURCE
OUR IT SUPPORTS IDENTIFYING MARKET SEGMENTS
OUR IT IS UTILISED TO REDEFINE THE SCOPE OF OUR BUSINESS
OUR IT SUPPORTS ANALYSING CUSTOMER NEEDS (I.E. PRODUCTS, PREFERENCES, PRICING AND QUALITY)
OUR IT IS UTILISED TO INCREASE THE SPEED OF RESPONDING TO BUSINESS OPPORTUNITIES/ THREATS RAVICHANDRAN & LERTWONGSATIEN (2005) IT S U P P O R T F O R M A R K E T COM PETENCES
OUR IT IS UTILISED TO PRODUCE OUR PRODUCTS /SERVICES OWN
OUR IT IS SUPPORTING OUR STRATEGIC BUSINESS PROCESSES OWN
OUR IT IS IMPROVING OUR OPERATIONAL EFFICIENCY GREGOR ET AL. (2004)
OUR IT SUPPORTS OUR INNOVATION PROCESSES RIVARD ET AL. (2006)
OUT IT SUPPORTS OUR PRODUCT DEVELOPMENT
OUR IT SUPPORTS CROSS FUNCTIONAL INTEGRATION IN OUR FIRM
RAVICHANDRAN & LERTWONGSATIEN (2005)
OUR IT SUPPORTS KNOWLEDGE SHARING IN THE COMPANY
IT S U P P O R T F O R O P E R A TI ONAL COM PETENCE
OUR IT SUPPORTS OUR ORGANISATIONAL LEARNING
RIVARD ET AL. (2006)
To further validate the research instrument a Panel of Expert survey was conducted. The panel of expert consisted of 40 IT/IS academics which were identified through a literature search. The addressed academics came from a variety of universities and had a range of experiences and research backgrounds. An online survey was set up and the experts were invited per email to rate each of the pooled research items in regards of their relevance to measure the underlying variable on a 5-point likert scale. Additionally, the experts were encouraged to provide additional feedback on each item. 14 academics replied. Inter-rater reliability was assessed through correlation-coefficients and indicated that the experts were in agreement and the obtained data valid.
Judgement on suitability of the pooled items was based on the rating as well as the provided feedback comments of the Panel of Expert survey. From the IT support for operational competence construct one item was dropped: ‘Our IT supports our organisational learning’. This was done because the researchers realised through the feedback comments that knowledge sharing is a subset of organisational learning. Organisational learning encompasses many attributes, one of which is knowledge sharing. Without knowledge sharing, no organisational learning can take place. The IT support for knowledge sharing can be measured, whereas organisational learning encompasses organisational culture and many other non-IT related attributes. Hence, the item ‘Our IT supports our knowledge sharing’ was retained, and the item ‘Our IT supports our organisational learning’ was dropped. The next step was to test the soundness of the research instrument in order to further improve its quality. The significance of this pilot test was to find out what meaning potential respondents ascribed to the terms used and what context they applied when considering their answers. This provided insights into the respondents’ thought processes and allowed us to ensure that questions were understood in the way they were intended. The pilot test was conducted via face-to-face discussion with two chief information officers (CIOs). The questionnaire was presented to the participants and they were asked to outline how they understood and interpreted the questions and whether they had any difficulties in answering them. Overall, the interviewees confirmed that the questions were clearly stated, that they understood them well, though they did suggest some wording changes in certain items. The participants also offered further feedback from the practitioner perspective and proposed deletion of one item (“Our IT is utilised to increase the speed of product and service delivery”) as well as a few wording changes to make the instrument more comprehensible for CIOs. The research instrument was now ready for data collection.
Data collection
Data for the purposes of this paper is extracted from a PhD research project. As part of the project, an online survey was administered to a sample of Australian businesses during November- December 2007. The population of the main survey were Australian CEOs and CIOs. Because it was not possible to survey every Australian CEO/CIO, a representative sample frame was selected. To estimate the required sample size, the required statistical power had to be considered. Through a review of MIS research, Baroudi and Orlikowski (1989) suggest a statistical power of 0.80. Based on research which examined the impact of sample size on the statistical power of covariance structure models (e.g. SEM) and considering and the desired fit assessment (close versus exact fit), it was estimated that a required sample of 200 would be appropriate (MacCallum, Browne & Sugawara 1996).
A typical response rate in this kind of survey with senior executives is about 5-10 % (Ballard & Prine 2002; Fink & Neumann 2007). Therefore in order to obtain an adequate response rate, a sample size of 3500 CIOs and CEOs were selected form a database bought from impact 500. To encourage response, participants were addressed personally in the invitation email and their importance and expertise were pointed out. Participants were also promised a summary of the results of the survey. After three weeks, a reminder email was sent out, leading to another flow of responses. Two months after the first invitation email was sent out the survey was closed and a total of 253 responses were received. This is equivalent of a response rate of 7%.
PROFILE OF RESPONDENTS AND ESTIMATING NON RESPONSE BIAS
The research design is based on the assumption that it is possible to generalise from the sample to the population. As with most survey data, there is always a non-response, as not all addressed participants return the questionnaire. Non-response leads to missing data. The data may be biased and thus not representative of the population. Therefore, the researcher has to estimate if there exists a non-response bias. One way of doing this is to follow the suggestions of the literature to compare early respondents with late respondents. Participants that respond later to the questionnaire are supposed to have similar characteristics than non-respondents. An independent sample t-test on the averages of the IT infrastructure flexibility and the IT personnel flexibility construct showed no significant relationships between early and late respondents. Hence, even if non-response bias exists, it doesn’t appear to be statistically significant and generalization from the sample to the population is possible.
Table 11 illustrates the profile of the respondents. 203 large organisations (more than 200 employees) and 50 medium size organisations (20-200 employees) were represented in the sample. The respondents came from all industry sectors, with manufacturing (50), trade & transport (39) and Government and Health (30) among the biggest industry groups.
Table 11: Profile of Respondents
COMPANY SIZE COMPANY SIZE
LARGE MEDIUM TOTAL LARGE MEDIUM TOTAL
HOSPITALITY 2 1 3 HEALTH SERVICES 17 6 23
HORTICULTURE 5 1 6 MANUFACTURING 44 6 50
COMMUNICATION SERVICES 15 2 17
OTHER/ NOT
SPECIFIED 33 10 43
CONSTRUCTION 9 1 10 PROPERTY 7 2 9
EDUCATION 16 16 RETAIL TRADE 8 3 11
ELECTRIC, GAS AND WATER 11 3 14
TRANSPORT AND
STORAGE 12 2 14
FINANCIAL SERVICES 17 6 23 WHOLESALE TRADE 2 10 12
GOVERNMENT, DEFENCE,
RESULTS
MEASUREMENT ASSESSMENT
Recommended instrument validation procedures call for purification of the measure before moving on to assessing construct validity through factor analysis methods (Churchill 1979; Straub, Boudreau & Gefan 2004). Measurement scales can either be of reflective or formative nature. Formative models minimise the residual variances in the ‘inner’ (structural) equation and should therefore be assessed at a construct level (Petter, Straub & Rai 2007). In contrast, reflective models minimise the residual variances in the ‘outer’ (measurement) equations and thus internal consistency is important for reflective constructs (Petter, Straub & Rai 2007). In case the reflective measurement is poorly done, the measures may not follow this predictable pattern. As reflective measures should be unidimensional, individual measures can be removed to improve construct validity without affecting content validity (Petter, Straub & Rai 2007).
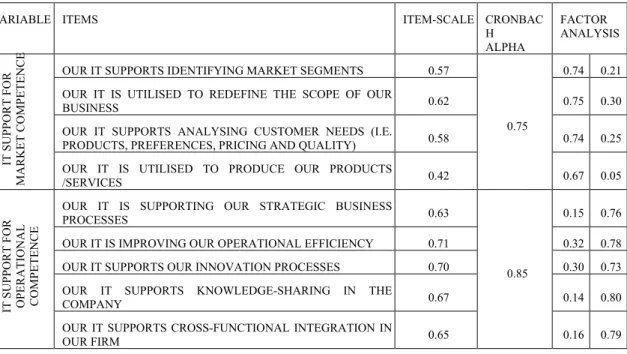
The scales of this research instrument are of a reflective nature and Cronbach alpha was used to assess the reliability of the scales. According to Churchill (1979), Cronbach’s alpha should be the first measure calculated to measure the quality of an instrument. The threshold for this study was set at 0.75. The second measure to assess internal consistency reliability is inter-item correlations. Low correlation between items is an indicator that the items do not represent the same construct, and hence are producing measurement error and unreliability (Churchill 1979). The item-scale for this item was set at 0.4, a threshold comparable to that used in studies in IT (Palvia 1996). Item-scales and Cronbach’s alpha were calculated for each variable separately. One item of the IT support for market competence variable (‘Our IT supports our product development’) failed the Item-scale threshold and was deleted. The construct was re-assessed and now both variables had sufficient high Cronbach alpha scores (IT support for market competence: 0.75, IT support for operational competence: 0.85) and all items had item-scales above 0.4 (see Table 12 below).
Table 12: Measurement assessment
VARIABLE ITEMS ITEM-SCALE CRONBAC
H ALPHA
FACTOR ANALYSIS OUR IT SUPPORTS IDENTIFYING MARKET SEGMENTS 0.57 0.74 0.21 OUR IT IS UTILISED TO REDEFINE THE SCOPE OF OUR
BUSINESS 0.62 0.75 0.30
OUR IT SUPPORTS ANALYSING CUSTOMER NEEDS (I.E.
PRODUCTS, PREFERENCES, PRICING AND QUALITY) 0.58 0.74 0.25
IT S U P P O R T F O R MAR KE T COM PETENCE
OUR IT IS UTILISED TO PRODUCE OUR PRODUCTS
/SERVICES 0.42
0.75
0.67 0.05 OUR IT IS SUPPORTING OUR STRATEGIC BUSINESS
PROCESSES 0.63 0.15 0.76
OUR IT IS IMPROVING OUR OPERATIONAL EFFICIENCY 0.71 0.32 0.78 OUR IT SUPPORTS OUR INNOVATION PROCESSES 0.70 0.30 0.73 OUR IT SUPPORTS KNOWLEDGE-SHARING IN THE
COMPANY 0.67 0.14 0.80 IT S U P P O R T F O R OPERA TI ONAL COM PETENCE
OUR IT SUPPORTS CROSS-FUNCTIONAL INTEGRATION IN
OUR FIRM 0.65
0.85
0.16 0.79
The next step to ensure construct validity was to conduct a factor analysis on the instrument. A Varimax rotated exploratory factor analysis (Principal component extraction) was conducted to ensure that the items group together and load on the predicted variables. Table 12 above illustrates the result of the exploratory factor analysis. The items of both variables loaded significantly on the predicted variable and did not cross load in a significant matter. Hence, the IT support for core competencies demonstrated acceptable construct reliability and initial construct validity.
To further assess the measurement model, and calculate convergent and discriminant validity, a confirmatory factor analysis was conducted. Confirmatory factor analysis was conducted with AMOS. Assessment of the proposed IT support for core competencies measurement model yielded an inadmissible model fit.
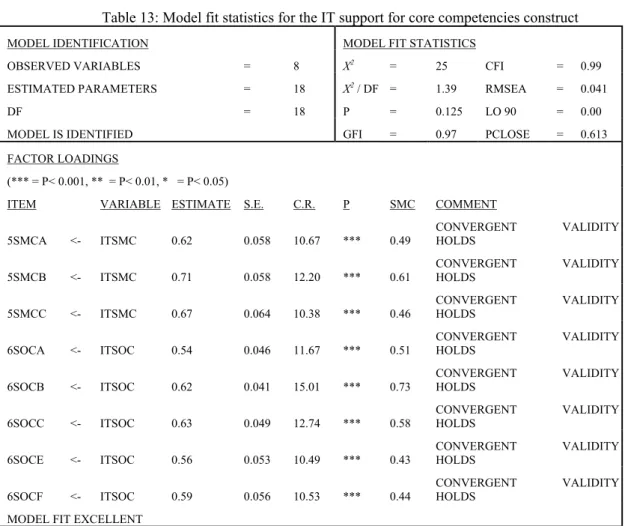
Respecification statistics were calculated and two issues were identified. Firstly, one item of the IT support for market competence (‘Our IT is utilised to produce our products / services’) had an insignificant factor loading on the variable. Hence, the item was deleted. Secondly, two items (‘Our IT supports knowledge-sharing in the company’ and ‘Our IT supports cross-functional integration in our firm’) of the IT support for operational competence variable demonstrated high standardised residual covariances. Therefore, both items were covaried and the measurement model re-estimated. Figure 22 below illustrated the final IT support for core competence measurement model and Table 13 below displays the model fit statistics of this measurement model.
Figure 22: CFA of IT support for core competence construct
Table 13: Model fit statistics for the IT support for core competencies construct MODEL IDENTIFICATION MODEL FIT STATISTICS
OBSERVED VARIABLES = 8 #2 = 25 CFI = 0.99
ESTIMATED PARAMETERS = 18 #2 / DF = 1.39 RMSEA = 0.041
DF = 18 P = 0.125 LO 90 = 0.00 MODEL IS IDENTIFIED GFI = 0.97 PCLOSE = 0.613 FACTOR LOADINGS
(*** = P< 0.001, ** = P< 0.01, * = P< 0.05)
ITEM VARIABLE ESTIMATE S.E. C.R. P SMC COMMENT
5SMCA <- ITSMC 0.62 0.058 10.67 *** 0.49
CONVERGENT VALIDITY HOLDS
5SMCB <- ITSMC 0.71 0.058 12.20 *** 0.61 CONVERGENT HOLDS VALIDITY
5SMCC <- ITSMC 0.67 0.064 10.38 *** 0.46 CONVERGENT VALIDITY HOLDS 6SOCA <- ITSOC 0.54 0.046 11.67 *** 0.51 CONVERGENT VALIDITY HOLDS 6SOCB <- ITSOC 0.62 0.041 15.01 *** 0.73 CONVERGENT VALIDITY HOLDS 6SOCC <- ITSOC 0.63 0.049 12.74 *** 0.58 CONVERGENT VALIDITY HOLDS 6SOCE <- ITSOC 0.56 0.053 10.49 *** 0.43 CONVERGENT VALIDITY HOLDS 6SOCF <- ITSOC 0.59 0.056 10.53 *** 0.44 CONVERGENT VALIDITY HOLDS
Table 14: Final Items
VARIABLE ID ITEMS
5SMCA OUR IT SUPPORTS IDENTIFYING MARKET SEGMENTS
5SMCB OUR IT IS UTILISED TO REDEFINE THE SCOPE OF OUR BUSINESS
IT SUPPORT FOR MARKET COMPETENCE
5SMCC OUR IT SUPPORTS ANALYSING CUSTOMER NEEDS (I.E. PRODUCTS, PREFERENCES, PRICING AND QUALITY)
6SOCA OUR IT IS SUPPORTING OUR STRATEGIC BUSINESS PROCESSES
6SOCB OUR IT IS IMPROVING OUR OPERATIONAL EFFICIENCY
6SOCC OUR IT SUPPORTS OUR INNOVATION PROCESSES
6SOCE OUR IT SUPPORTS KNOWLEDGE-SHARING IN THE COMPANY
IT SUPPORT FOR OPERATIONAL
COMPETENCE
6SOCF OUR IT SUPPORTS CROSS-FUNCTIONAL INTEGRATION IN OUR FIRM
Table 13 above reports the model fit summary of the full model and Table 5 above shows the final items. With 18 degree of freedom the model is clearly identified and Model fit statistics can be calculated. The model fit statistics indicate a good fitting model (normed chi-square between 1.0-2.0, p>0.05, CFI >0.95, RMSA< 0.05, GFI>0.95). To assess the convergent validity of the model the factor loadings of each item were calculated (see Table 13 above). Each item demonstrated a high regression weight, standardised regression weighs, significant critical ratios and p values below 0.05. Furthermore the squared multiple correlations (SMC) were investigated. All SMC were above 0.4, which further supported the positive convergent validity assessment of each item.
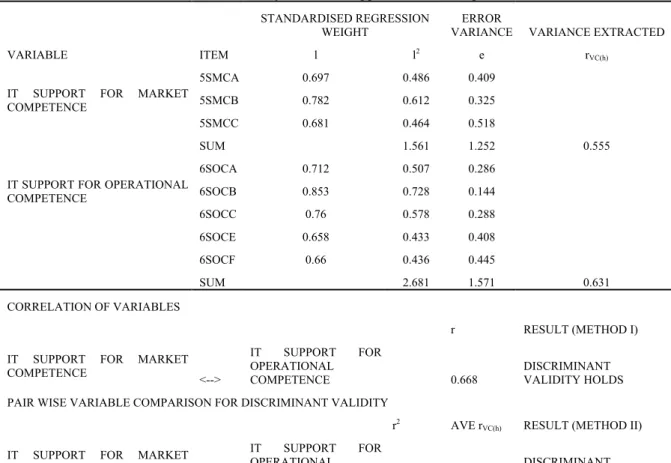
The final step was to assess discriminant validity. Discriminant validity measures to what extent latent variables differ from each other. In contrast to convergent validity, which is a measure within latent variables, discriminant validity is a measure between variables. Discriminant validity is especially important if latent variables and constructs are interrelated. It can be assessed in two ways. Firstly, correlations between different constructs can be calculated. High correlations (above 0.8 or 0.9) between constructs indicate a lack of discriminant validity (Holmes-Smith 2007). Secondly, the average variance extracted for constructs should exceed the square of the correlations between the constructs (Holmes-Smith 2007). Table 15 below displays the two discriminant validity assessments.
Table 15: Discriminant validity for the IT support for core competencies construct
STANDARDISED REGRESSION WEIGHT
ERROR
VARIANCE VARIANCE EXTRACTED
VARIABLE ITEM l l2 e rVC(h)
5SMCA 0.697 0.486 0.409
5SMCB 0.782 0.612 0.325
IT SUPPORT FOR MARKET COMPETENCE
5SMCC 0.681 0.464 0.518
SUM 1.561 1.252 0.555
6SOCA 0.712 0.507 0.286
6SOCB 0.853 0.728 0.144
IT SUPPORT FOR OPERATIONAL COMPETENCE 6SOCC 0.76 0.578 0.288 6SOCE 0.658 0.433 0.408 6SOCF 0.66 0.436 0.445 SUM 2.681 1.571 0.631 CORRELATION OF VARIABLES r RESULT (METHOD I)
IT SUPPORT FOR MARKET
COMPETENCE <--> IT SUPPORT FOR OPERATIONAL COMPETENCE 0.668 DISCRIMINANT VALIDITY HOLDS PAIR WISE VARIABLE COMPARISON FOR DISCRIMINANT VALIDITY
r2 AVE rVC(h) RESULT (METHOD II)
IT SUPPORT FOR MARKET
COMPETENCE <--> IT SUPPORT FOR OPERATIONAL COMPETENCE 0.446 0.593 DISCRIMINANT VALIDITY HOLDS
Both discriminant validity assessments demonstrated that the IT support for core competence construct has sufficient discriminant validity. The correlation between both variables was below 0.8 and the average variance extracted from both variables was lower than the squared correlations between these variables (see Table 15 above).
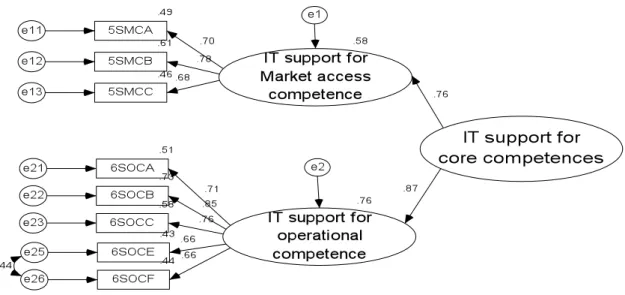
In sum, the measurement model of IT support for core competencies demonstrated reliability as well as construct validity, assessed through convergent and discriminant validity. Therefore, the developed measurement model can be transformed into a second order IT support for core competence construct, which is illustrated in Figure 23 below.
Figure 23: IT support for core competencies as second order construct
Table 16: Model fit statistics for second order IT support for core competencies construct
MODEL IDENTIFICATION MODEL FIT STATISTICS
OBSERVED VARIABLES = 8 #2 = 25 CFI = 0.99
ESTIMATED PARAMETERS = 18 #2 / DF = 1.38 RMSEA = 0.04
DF = 18 P = 0.125 LO 90 = 0
MODEL IS IDENTIFIED GFI = 0.97 PCLOSE = 0.61
FACTOR LOADINGS
(*** = P< 0.001, ** = P< 0.01, * = P< 0.05)
ITEM VARIABLE ESTIMATE S.E. C.R. P SMC COMMENT
5SMCA <- ITSMC 1.0 *** 0.486
CONVERGENT VALIDITY
HOLDS
5SMCB <- ITSMC 1.1 0.128 8.998 *** 0.611 CONVERGENT HOLDS VALIDITY
5SMCC <- ITSMC 1.07 0.128 8.4 *** 0.463
CONVERGENT VALIDITY
HOLDS
6SOCA <- ITSOC 1.0 *** 0.51 CONVERGENT HOLDS VALIDITY
6SOCB <- ITSOC 1.14 0.101 11.353 *** 0.73 CONVERGENT VALIDITY HOLDS 6SOCC <- ITSOC 1.15 0.111 10.410 *** 0.58 CONVERGENT VALIDITY HOLDS 6SOCE <- ITSOC 1.03 0.113 9.076 *** 0.43 CONVERGENT VALIDITY HOLDS 6SOCF <- ITSOC 1.08 0.119 9.097 *** 0.44 CONVERGENT VALIDITY HOLDS MODEL FIT EXCELLENT
The model fit statistics for the second order IT support for core competencies construct in Table 16 above indicate an excellent model fit. Furthermore all items display convergent validity. Hence, this second order IT support for core competence construct was accepted.
SUMMARY, CONCLUSIONS AND FURTHER RESEARCH
The purpose of this study was to develop a validated construct that measures the support IT can provide for organisations’ core competencies. The presented construct is based on works of Ravichandran and Lertwongsatien (2005) In their work they called for further research to modify and re-assess their construct and provide a validated measurement model (Ravichandran & Lertwongsatien 2005). This study has followed this call and modified their instrument in order to achieve a validated construct for IT support of core competencies. A rigorous instrument development process was applied to ensure the validity and soundness of the construct. This process included panel of expert surveys, pilot studies, and reliability and construct validity assessments. The result was a validated second order construct of IT support for core competencies.
The validated construct of this research is to some degree similar to Sambamurthy et al. (2003) theoretical construct of digital options. The IT support for core competencies construct of this research could be utilised as a part of their theoretical model which theorises relationship between IT capabilities/IT resources, IT’s ability to support the reach and range of business processes and knowledge sharing, organisational agility and competitive action repertoire of firms (Sambamurthy, Bharadwaj & Grover 2003).
Further research can utilise the validated second order construct of IT support for core competencies to examine its antecedent factors (upstream factors) as well its impact on competitive advantage of firms (downstream factors).
REFERENCES
Amit, R. & Schoemaker, P. 1993, 'Strategic assets and organisational rent', Strategic Management Journal, vol. 14, no. 1, p. 33.
Ballard, C. & Prine, C. 2002, 'Citizen perception of community policing: comparing internet and mail survey responses ', Social science computer review, vol. 20, no. 4, pp. 485-93.
Barney, J. 1991, 'Firm resources and sustained competitive advantage', Journal of Management, vol. 17, no. 1, p. 99.
Baroudi, J. J. & Orlikowski, W. J. 1989, 'The Problem Of Statistical Power In MIS Research', MIS Quarterly, vol. 13, no. 1, p. 87.
Bharadwaj, A. S. 2000, 'A resource-based perspective on information technology capability and firm performance: an empirical investigation', MIS Quarterly, vol. 24, no. 1, p. 169.
Churchill, G. A. 1979, 'A paradigm for developing better measures of marketing constructs', Journal of Marketing Research, vol. 16, no. 000001, p. 64.
Clemons, E. K. & Row, M. C. 1991, 'Sustaining IT advantage: the role of structural differences', MIS Quarterly, vol. 15, no. 3, p. 275.
Feeny, D. F. & Willcocks, L. P. 1998, 'Core IS capabilities for exploiting information technology', Sloan Management Review, vol. 39, no. 3, p. 9.
Fink, L. & Neumann, S. 2007, 'Gaining agility through IT personnel capabilities: the mediating role of IT infrastructure capabilities', Journal of the Association for Information Systems, vol. 8, no. 8, p. 440. Gregor, S., Fernandez, W., Holtham, D., Martin, M., Stern, S., Vitale, M. & Pratt, G. 2004, Achieving value from
ICT: key management strategies, Department of Communications, Information Technology and the Arts, Canberra.
Holmes-Smith, P. 2007, 'An applied introductory course in structural equation modelling using AMOS', in SREAM.
Maccallum, R., Browne, M. W. & Sugawara, H. W. 1996, 'Power analysis and determination of sample size for covariance structural modelling', Psychological Methods, vol. 1, no. 2.
Mata, F. J., Fuerst, W. L. & Barney, J. B. 1995, 'Information technology and sustained competitive advantage: a resource-based analysis', MIS Quarterly, vol. 19, no. 4, p. 487.
Palvia, P. C. 1996, 'A model and instrument for measuring small business user satisfaction with information technology', Information & Management, vol. 31, pp. 151 - 63.
Petter, S., Straub, D. & Rai, A. 2007, 'Specifying formative constructs in information systems research', MIS Quarterly, vol. 31, no. 4, p. 623.
Powell, T. C. & Dent-Micallef, A. 1997, 'Information technology as competitive advantage: the role of human, business, and technology resources', Strategic Management Journal, vol. 18, no. 5, p. 375.
Prahalad, C. K. & Hamel, G. 1990, 'The core competence of the corporation', Harvard Business Review, vol. 68, no. 3, p. 79.
Ravichandran, T. & Lertwongsatien, C. 2005, 'Effect of information system resources and capabilities on firm
performance: a resource-based perspective', Journal of Management Information Systems, vol. 21, no.
4, p. 237.
Ray, G., Muhanna, W. A. & Barney, J. B. 2005, 'Information technology and the performance of the customer service process: a resource based analysis', MIS Quarterly, vol. 29, no. 4, p. 625.
Rivard, S., Raymond, L. & Verreault, D. 2006, 'Resource-based view and competitive strategy: An integrated model of the contribution of information technology to firm performance', The Journal of Strategic Information Systems, vol. 15, no. 1, pp. 29-50.
Ross, J. W., Beath, C. M. & Goodhue, D. L. 1996, 'Develop long-term competitiveness through IT assets', Sloan Management Review, vol. 38, no. 1, p. 31.
Sambamurthy, V., Bharadwaj, A. S. & Grover, V. 2003, 'Shaping agility through digital options: reconceptualizing the role of information technology in contemporary firms', MIS Quarterly, vol. 27, no. 2, p. 237.
Santhanam, R. & Hartono, E. 2003, 'Issues in linking information technology capability to firm performance',
MIS Quarterly, vol. 27, no. 1, p. 125.
Straub, D., Boudreau, M.-C. & Gefan, D. 2004, 'Validation guidelines for IS positivistic research',
Communications of the Association for Information Systems, vol. 13, pp. 380-427.
Tippins, M. J. & Sohi, R. S. 2003, 'IT competency and firm performance: Is organisational learning a missing link?' Strategic Management Journal, vol. 24, no. 8, p. 745.
Wade, M. & Hulland, J. 2004, 'Review: the resource based view and information system research: review, extension and suggestions for future research', MIS Quarterly, vol. 28, no. 1, p. 107.
COPYRIGHT
Paschke © 2009. The authors assign to ACIS and educational and non-profit institutions a non-exclusive licence to use this document for personal use and in courses of instruction provided that the article is used in full and this copyright statement is reproduced. The authors also grant a non-exclusive licence to ACIS to publish this document in full in the Conference Papers and Proceedings. Those documents may be published on the World Wide Web, CD-ROM, in printed form, and on mirror sites on the World Wide Web. Any other usage is prohibited without the express permission of the authors.