Capital Structure and International Debt Shifting in Europe
Harry Huizinga* Tilburg University and CEPR
Luc Laeven*
International Monetary Fund and CEPR and
Gaëtan Nicodème*
European Commission and Solvay Business School (ULB) April 2006
Abstract: This paper presents a model that relates a multinational firm’s optimal debt policy to taxation and to non-tax factors such as the desire to prevent bankruptcy. The model yields the predictions that a multinational’s indebtedness in a country depends on national tax rates and differences between national and foreign tax rates. These differences matter as multinationals have an incentive to shift debt to high-tax countries. The predictions of the model are tested with the aid of a broad European data set combining firm-level data and information on the international tax treatment of dividend and interest streams. The estimation results indicate that corporate debt policy reflects national corporate tax rates and international corporate tax rate differences but not non-resident dividend withholding taxes.
Key words: corporate taxation, financial structure, debt shifting JEL classification: F23, G32, H25
*The findings, interpretations, and conclusions expressed in this paper are entirely those of the authors. They should not be attributed to the European Commission or the World Bank.
1. Introduction
In most European countries, interest expenses are deductible for corporate tax purposes while dividends have to be paid out of net-of-tax corporate income. Most European tax systems thus favor debt finance over equity finance, but to different degrees given the dispersion in top corporate tax rates. In determining their financial structure, purely domestic firms only have to deal with the domestic tax system. In Europe the largest firms, however, are typically multinational firms that operate in many or all European countries. Multinational firms face the more complicated choice of determining their overall indebtedness and the allocation of their debts to the parent firm or to subsidiaries operating in any number of countries. European multinationals have to deal with the different tax systems in each of their countries of operation. Hence, the financial structure of a multinational firm can be expected to be affected by the tax systems of all the countries where it operates.
In an international setting, the tax costs of debt and equity finance depend on the combined tax systems of the subsidiary and parent countries of the multinational firm. Dividends, as indicated, have to be paid out of the subsidiary’s income after subsidiary-country corporate tax and in addition may be subject to a non-resident dividend withholding tax in the subsidiary country. In the parent country, the dividend income may again be subject to corporate income tax. If so, double tax relief may or may not be provided for the previously paid corporate income and non-resident withholding tax. The tax costs of equity finance thus reflect tax rates as well as the double-tax relief convention used by the parent country. This paper collects detailed information on all of these aspects of the international tax system.
A firm’s financial policies are affected by tax as well as tax considerations. A non-tax consideration is that indebtedness of the overall multinational firm should not be too high to keep the probability of costly bankruptcy low. In contrast, an advantage of debt finance is that it reduces the free cash-flow within the firm and hence can act as a disciplining device for otherwise overspending managers. The disciplining properties of debt finance can explain generally positive debt levels at each of a multinational’s individual establishments (i.e., its
parent company and its foreign subsidiaries). These various considerations give rise to an optimal overall capital structure for the overall multinational firm for non-tax reasons.
This paper first presents a model of the optimal overall capital structure of the multinational firm reflecting tax and non-tax factors. Generally, the tax advantages of debt finance lead the firm to choose a higher leverage than would be desirable for purely non-tax reasons. At the same time, a change in tax policy optimally causes the firm to rebalance its capital structure in all the countries where it operates. Specifically, stronger incentives for debt finance in one country encourage debt finance in that country but at the same time discourage debt finance in other countries to keep the overall indebtedness of the multinational in check. The model yields that the optimal debt to assets ratio at any establishment of the multinational is positively related to the national tax rate and to differences between the national and foreign tax rates. The relevant tax rates in this regard are the effective tax rates that take into account any double taxation and double taxation relief. International tax rate differences matter, as they determine the incentives to shift debt internationally within a multinational firm.
Next, the paper presents some evidence on the impact of taxation on firm indebtedness for a sample of 31 European countries over the 1999-2004 period. For stand-alone domestic firms, we estimate that a 1 percent increase in the overall tax rate (reflecting corporate income taxes and non-resident dividend withholding taxes) increases the ratio of liabilities to assets by 0.0021. For multinational firms, the leverage ratio is found to be more sensitive to taxation on account of international debt shifting. As an example, we can consider a multinational with two equal-sized establishments in two separate countries. A 1 percent overall tax increase in one country is found to increase the leverage ratio in that country by 0.0027, while the leverage ratio in the other country decreases by 0.006. A split of the overall tax rate into corporate tax rates and non-resident dividend withholding taxes reveals that the latter do not have a significant impact on the leverage ratios of a multinational firm. This suggests that multinational firms can frequently avoid bilateral withholding taxes through triangular arbitrage involving a conduit company in a third country.
Several authors consider the relationship between firm leverage and taxation with U.S. data. Among these, MacKie-Mason (1990) and Gordon and Lee (2001) identify a tax effect by exploiting the different effective taxation faced by previously loss-making firms and firms of different sizes, respectively. Graham (2000) calculates the value of the tax benefits of debt finance for the U.S. case. Studies that use cross-country data have the advantage that they allow for international variation in tax rates. Examples are Rajan and Zingales (1995) and Booth, Aivazian, Demirgüc-Kunt and Maksimovic (2001). The latter set of authors finds a weak effect on leverage for a tax variable that measures the tax shield of debt finance. Next, there is a set of papers that consider the debt finance of multinationals with either parent companies or subsidiaries in the U.S.. Newberry and Dhaliwal (2001) find that the debt issuance location of U.S. multinationals is affected by these firms’ jurisdiction-specific tax-loss carry-forwards and binding foreign tax credit limitations on the value of debt tax shields. Desai, Foley and Hines (2004) find that both the internal and external financing of outward U.S. FDI is sensitive to foreign tax rates. Mills and Newberry (2004) analogously find that non-U.S. multinationals from countries with relatively low tax rates use relatively intensive debt finance of their foreign controlled corporations in the U.S..
Jog and Tang (2001) consider the leverage of firms in Canada that may or may not be part of U.S.-based or Canadian-based multinationals. The debt-to-assets ratios of Canadian corporations without foreign affiliates are found to be more sensitive to Canadian tax rates than the debt-to-assets ratios of U.S. controlled corporations located in Canada. Using data for the EU, Moore and Ruane (2005) finally examine the leverage of 8,500 foreign subsidiaries. They find that leverage ratios of these subsidiaries are sensitive to the local corporate tax rate, unless the parent country operates a foreign tax credit system. This paper nests the approaches of the latter two papers by considering how both multinational firm structure and the international tax system affect leverage in Europe. Hence, we take into account whether a firm is a parent or a subsidiary of a multinational firm or instead a stand-alone domestic firm. At the same time, we account for the tax systems of all the countries where the multinational
operates. It is the overall international tax system that determines the tax incentives for a multinational to locate debt in any one country.
In the remainder, section 2 describes the international tax treatment of the debt and equity finance of multinational firms. Section 3 presents the model. Section 4 discusses the company-level data. Section 5 presents the empirical results. Section 6 concludes.
2. The international tax system
This section describes the main features of the corporate income tax system applicable to a multinational firm with subsidiaries in one or more foreign countries.1 To fix ideas, let us consider a multinational firm that operates a foreign subsidiary in country i and has the parent firm in country p. The deductibility of interest from corporate income implies that there is no corporate taxation of interest to external debt holders. Dividends paid by the subsidiary to the parent firm in contrast are generally subject to corporate taxation in at least one country.
The subsidiary’s income in county i is first subject to the corporate income tax in this country. Table (1), column (a) indicates the statutory corporate tax rate on corporate profit for a sample of 33 European countries in 2004. These tax rates include regional and local taxes as well as specific surcharges. This information has been collected from the IBFD and various websites of national ministries of finance. The subsidiary pays out its after-tax corporate income as a dividend to the parent company. The subsidiary country may levy non-resident a withholding tax on this outgoing dividend income. Bilateral dividend withholding taxes in Europe for 2004 are presented in Table (2). These rates are zero in the majority of cases, but some countries maintain non-negligible non-resident dividend withholding tax rates. The
i
t
e iw
1
It is reasonable to assume that multinationals do not take into account the taxation of dividend, interest and capital gains at the investor level. First, important institutional investors such as pension funds may not be subject to taxation of the investor level. Second, private investors generally are subject to such taxation, but the internationally dispersed ownership of the shares of a multinational firm makes it difficult for these firms to take taxation at the personal level into account when deciding on their financing.
combined corporate and withholding tax rate in the subsidiary country is seen to be or + - .
)
1
)(
1
(
1
e i iw
t
−
−
−
t
i e iw
t
i e iw
The parent country subsequently may or may not use its right to tax the income generated abroad. In case the parent country operates a territorial or source-based tax system, it effectively exempts foreign-source income from taxation. The effective marginal tax on income reported in country i, denoted τi, in this instance equals combined corporate and
withholding tax +
t
i e - in country i.i
w
t
i ei
w
2 Alternatively, the parent country operates a worldwide or residence-based tax system. In this instance, the parent country subjects income reported in country i to taxation, but it generally provides a foreign tax credit for taxes already paid in country i to reduce the potential for double taxation. The OECD model treaty, which summarizes recommended practice, in fact gives countries an option between an exemption and a foreign tax credit as the only two ways to relieve double taxation (see OECD, 1997). The foreign tax credit reduces domestic taxes on foreign source income one-for-one with the taxes already paid abroad. The foreign tax credit can be indirect in the sense that it applies to both the dividend withholding tax and the underlying subsidiary country corporate income tax. Alternatively, the foreign tax credit is direct and applies only to the withholding tax. In either case, foreign tax credits in practice are limited to prevent the domestic tax liability on foreign source income from becoming negative.In the indirect credit regime, the multinational will effectively pay no additional tax in the parent country, if the parent tax rate tp is less than The multinational then
has unused foreign tax credits and is said to be in an excess credit position. Alternatively, t
.
e i i e i iw
t
w
t
+
−
pexceeds In that instance, the firm pays tax in the parent country at a rate equal to the difference between t
.
e i i e i iw
t
w
t
+
−
p and The effective, combined tax rate on the
dividend income, τ
.
e i i e i iw
t
w
t
+
−
i, then equals the parent country tax rate, tp. To summarize, with the indirect
2
Note that for the parent firm we have that the effective tax rate on corporate income equals
credit system the effective rate on income generated in country i, τi, is given by max
[ ]. In case of a direct foreign tax credit, the multinational analogously pays no additional tax in the parent country, if the parent tax rate t
e i i e i i p t w tw t , + −
p is less than In the more
common case where t
.
e i
w
p exceeds , the firm instead pays tax in the parent country at a rate
equal to . The effective, two-country tax rate, τ e i
w
) )( 1 ( e i p i t w t −− i, with the direct credit system
is now given by . A few countries with worldwide taxation do not
provide foreign tax credits, but instead allow foreign taxes to be deducted from the multinational’s taxable income. Under this deduction method, foreign taxes are essentially seen as a tax-deductible cost of seeing business at par with other business costs. In the scenario, the effective rate of taxation on dividends, , is given by
] , max[ ) 1 ( e i p i i t t w t + − i
τ
(
)
(
e)(
p)
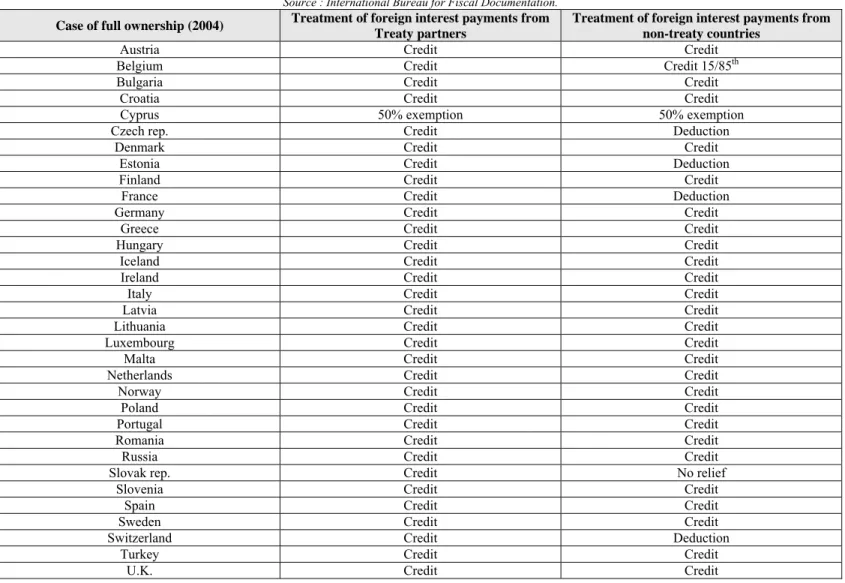
i i w t t − − − − 1 1 1 1 .Columns (b) and (c) of Table (1) provide information on the double taxation rules applied to incoming dividend. Several countries are seen to discriminate between international tax treaty partners and non-treaty countries. Finland, for instance, exempts dividend income from treaty partners, and provides a direct foreign tax credit for dividend withholding taxes paid in non-treaty counties. To know what double tax relief applies specifically, it is necessary to know whether a bilateral tax treaty exists. Table (3) indicates with a binary variable whether any two countries had concluded a tax-treaty by 2004.3 Overall, the exemption system is seen to be the most common method of double tax relief, followed by foreign tax credits. Indirect foreign tax credits are again more common than direct foreign tax credits. As exceptional cases, the Check Republic is seen to apply the deduction method to foreign dividends from non-treaty countries, while Russia provides no double tax relief at all to such income.
So far we have assumed that a parent company finances a foreign subsidiary through equity rather than internal debt. Apart from any differences in tax treatment, internal debt and
3
Most of the 33 countries in our sample had such treaties with each other. However, the treaty network of some countries – in particular some of the new EU member states and some non-EU countries – are far from complete. In contrast, Belgium, Denmark, Finland, France, Germany, Norway, Poland, Sweden and the United Kingdom have a double-tax treaty in force with all other countries. Note that the table is not exactly symmetric because the entry into force may slightly differ in each of the two treaty partners.
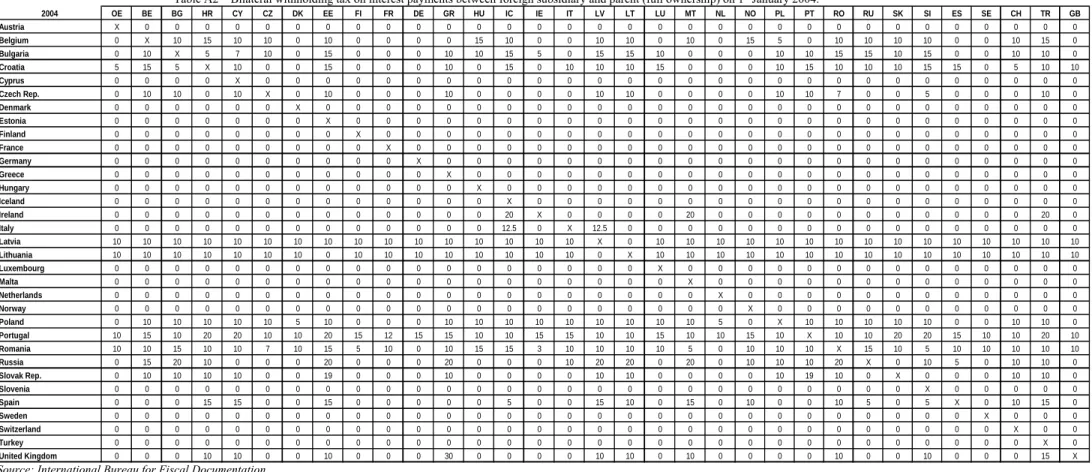
internal equity are largely equivalent. This means that the choice between these two modes of internal financing importantly depends on the tax system. Interest on internal debt is generally deductible from taxable corporate income in the subsidiary country. Such interest income thus escapes corporate income tax in the subsidiary country. The subsidiary country however may impose a non-resident interest withholding tax on the outgoing internal interest payment. The parent country in turn may tax this interest and at the same time provide double tax relief for withholding taxes. Of interest is the taxation of dividends relative to interest on internal debt. Specifically, let ϕi be the effective rate of taxation on cross-border dividends minus the effective rate of tax on interest. See the appendix for details on how to measure ϕi .
3. The model
The model considers a multinational that generally operates in n countries. The multinational is domiciled in country p, while it has foreign subsidiaries in one or more countries i with assets A i.. The subsidiary is financed with debt Li, which for now we take to be
external debt, and equity Ei. Hence, the balance sheet identity of a subsidiary implies Ai = Li +
Ei. The parent firm fully owns each subsidiary’s equity Ei. In addition, the parent firm owns
‘outside’ assets Ap. The parent firm in turn can be financed through either debt Lp or equity Ep.
Thus, the balance sheet identity for the parent can be stated as p p.
n p i i p E L E A +
∑
= + ≠Let
λ
ibe the ratio of debt to assets for each establishment of the multinational - i.e.i i
i
A
L
=
λ
. Analogously, letλ
f be the debt to assets ratio for the entire firm, i.e.∑
∑
= ==
n i i n i i fA
L
1 1λ
.Alternatively, we can write
λ
f as the asset-weighted average of the establishment-specific debtratios
λ
i as∑
, where = n i i i 1ρ
λ
∑
==
n i i i iA
A
1firm’s total assets. Throughout, we will assume that the assets Aiof subsidiary i and the parent
firm’s ‘outside’ assets Ap given.4
In deciding its financial structure, the multinational firm takes taxation as well as non-tax factors into account. To start with the latter, the multinational recognizes that higher leverage increases the chance of bankruptcy. We will assume that the parent firm provides credit guarantees for the debts of all its subsidiaries. This implies that the chance of bankruptcy of the overall multinational firm depends on the firm-wide leverage ratio
λ
f . Specifically, we will assume that expected bankruptcy costs, , of the firm are quadratic in the overall leverage ratiof
C
f
λ
and proportional to the firm’s overall outside assets as follows5)
(
)
(
2
1 2∑
==
n i i f fA
C
γ
λ
(1)Next, it is recognized that leverage may bring benefits in that it disciplines local managers and aligns their incentives more closely to those of the firm. High leverage at a subsidiary may, for instance, serve to prevent local managers from overspending on perks for themselves to prevent de jure bankruptcy of the subsidiary. On the other hand, high leverage may have the disadvantage of making local managers too risk-averse to the point where they do not make appropriate local investment decisions. In either case, the incentive effects of leverage are assumed to stem from the local leverage ratio
λ
i for establishment i. 6 On the basis of these incentive considerations alone, let λ* be the optimal leverage ratio at each of themultinational’s establishments. Deviations of the leverage ratio at any establishment from the level λ* are assumed to imply incentive-related costs to the firm. These costs are assumed to be
4 In response to a change in E
i, the parent firm thus will change either Lp or Ep rather than Ap.
5Bankruptcy costs are incurred by loss-making firms and hence are assumed not to be deductible from
taxable corporate income.
6 Higher local leverage may be disadvantageous if it increases the probability of losses that cannot be
credited against profits made elsewhere in the firm. Losses that are not creditable per definition reduce the after-corporate-tax income of the firm one-for-one. For this reason, we assume that the costs associated with higher leverage at the establishment level are not deductible from taxable corporate income.
quadratic in
λ
iand now they are proportional to the outside assets at establishment i as follows: iA
i i i iA
A
C
* 2 *22
)
-(
2
λ
µ
λ
λ
µ
=
i=1,…, n (2)Note that these cost functions are scaled to equal zero if the debt ratios
λ
i are zero, which implies that Cican be of either sign. Next, let Vl and Vu be the values of the levered andcompletely unlevered multinational firm, respectively. The two are different on account of the tax benefits of debt finance and of the (net) non-tax costs associated with debt finance. Specifically, VLand Vu are related as follows
∑
∑
= =−
−
+
=
n i i f n i i i u LV
L
C
C
V
1 1τ
(3)where again is the rate of taxation of dividend income relative to interest income in locale i
taking into account the overall international tax system.
i
τ
The multinational firm’s objective is to maximize its overall firm value in the leveraged state. Its instruments are the debt levels L
L
V
i at each establishment.7 The first order
conditions w.r.t. Li – written in terms of leverage ratios - are given by
0 ) ( − * = − −
γλ
µ
λ
λ
τ
i f i i=1,…, n (4)The first order conditions jointly allow us to solve for the optimal value of
λ
i as follows:7 The firm recognizes all subsidiary and parent firm balance sheet identities, which means that the E i are
i i
β
λ
β
τ
λ
* 1 0+
=
+ ⎥ i=1,…,n (5) ⎦ ⎤ ⎢ ⎣ ⎡ −∑
≠ n i j j j iτ
ρ
τ
β
2 ( ) where 0(
)
µ
γ
µ
β
+
=
,µ
γ
β
+
=
1
1 , and 2(
µ
(
γ
µ
)
)
γ
β
+
=
.In expression (5), the term is the optimal leverage ratio at all establishments on the basis of all non-tax considerations, or equivalently if all the
* 0
λ
β
τ
’s are equal to zero. The termβ
0λ
*can be seen to balance the expected costs of bankruptcy (with a value ofλ
above zero) against the costs of deviating from the optimal value of the leverage ratio on the basis of incentive considerations. Expression (5) further contains two tax-related terms. First, the term*
λ
i
τ
β
1 reflects the impact of taxation on the optimal leverage ratio that would obtain for a purely domestic firm located in country i. For this reason, this term is dubbed the ‘domestic’ effect of taxation on leverage. Second, the term reflects the impact ofinternational tax rate differences on the optimal leverage in country i on account of international debt shifting. Interestingly, this term weight the international tax differences
⎥ ⎦ ⎤ ⎢ ⎣ ⎡ −
∑
≠ n i j j j iτ
ρ
τ
β
2 ( ) j iτ
τ
−
by the asset sharesρ
j. This reflects that the cost function implies that it is relatively painless to shift (absolute) debt into or out of country j, if the assets in this country are relatively large. This second effect of taxation on leverage in country i is named the ‘international’ or ‘debt-shifting’ effect. Note that leveragei
C
i
λ
in country i is negatively related toτ
j on account of the ‘debt-shifting’ effect.The theoretical equation (5) gives rise to the following regression equation
i n i j j j i i i i
α
β
τ
β
τ
τ
ρ
ε
λ
⎥+ ⎦ ⎤ ⎢ ⎣ ⎡ − + + =∑
≠ ) ( 2 1 i=1,…,n (6)where αi is a country-specific fixed effect and
ε
iis an error term. In the benchmark case, thesample will consist of observations for all subsidiaries to the exclusion of parent firms.8 In practice, a range of firm-level and country-level control variables is included in the estimation.
After obtaining empirical estimates of
β
1 andβ
2, we can solve for the cost function parameters γ and µ in (1) and (2) by employing the following expressions2 1
1
β
β
µ
+
=
and ) ) ( ( 2 1 1 2β
β
β
β
γ
+ = 4. The dataThe data on multinational firms are taken from the Amadeus database compiled by Bureau Van Dijk.9 This database provides accounting data on private and publicly owned European firms as well as on their ownership relationships. These ownership data allow us to match European firms with their domestic subsidiaries and subsidiaries located in other European firms. A firm is defined to be a subsidiary, if at least 50 percent of the shares are owned by another single firm. A multinational firm has at least one foreign subsidiary. Multinational firms tend to provide consolidated and unconsolidated accounting statements. Consolidated statements reflect the activities within the parent companies themselves and of all domestic and foreign subsidiaries. Separate, non-consolidated statements in contrast reflect the activities directly within the parent firm and in each of its subsidiaries. The data below on parent firms and subsidiaries are based on non-consolidated statements.
Information on the number of parent companies and subsidiaries - domestic and foreign in our data set – is provided in Panel A of Table 4. The total number of parent companies is 38,736, while the total number of subsidiaries is 90,599. Note that Amadeus only
8In this instance, the country fixed effect in part can serve to reflect so-called thin capitalization rules
that may limit the tax benefits (in terms of interest deductibility) associated with subsidiary indebtedness.
9 The database is created by collecting standardized data received from 50 vendors across Europe. The
provides information on subsidiaries located in one of the European countries listed in the table. France, Spain and the United Kingdom each are home to at least 4,000 parent companies in the data set. Each subsidiary has a home country and a host country (for domestic subsidiaries home and host countries are the same). For each country, the table lists the number of subsidiaries by home country and by home country. The table reveals that, for instance, Germany and the Netherlands are the home country to relatively many subsidiaries. Hence, there are relatively many subsidiaries with a parent firm in one of these countries. Croatia, the Czech Republic and Romania instead are the host country to relatively many subsidiaries.
Panel B of Table 4 provides information on financial leverage and applicable tax rates. First, financial leverage is defined as the ratio of total liabilities to total assets. Adjusted financial leverage, instead, is the ratio of total liabilities minus accounts receivable minus cash to total assets minus accounts payable minus cash. These adjustments reflect that accounts payable are liabilities that reflect current operations rather than efforts to optimize the firm’s capital structure. Similarly, the substraction of cash reflects that cash may be on hand to pay off existing debts. By definition, adjusted financial leverage is equal to or less than financial leverage. The average parent company financial leverage of 0.62 indeed exceeds the average adjusted financial leverage for some companies of 0.49. Average financial leverage ranges from 0.36 for Russia and Slovenia to 0.80 for Romania. Interestingly, subsidiaries by host country have average financial leverage and adjusted financial leverage of 0.62 and 0.49, respectively – exactly equal to the averages for parent firms. Hence, there is no tendency for subsidiaries to be either more or less leveraged than parent firms. Next, the effective tax rate for subsidiaries by host country is seen to be highest for Germany at 0.49, and lowest for Estonia at 0.14. As discussed before, the effective tax reflects the taxation of dividends in the host country itself as well as the tax treatment of this income in any foreign parent country. The tax incentive to shift debt for subsidiaries by host country is the asset-weighted difference of the effective tax rate in the host country and the effective tax rates applicable to other establishments of the same multinational firm. A positive value of this variable indicates that multinationals on average have an incentive to shift debt out of a particular host country. By
this measure, subsidiaries hosted in Germany have the largest incentive to shift debt away, while subsidiaries located in Hungary have the largest incentive to attract debt.
Panel C of Table 4 provides summary statistics of our leverage and tax variables as well as of control variables included in the subsequent estimation. The control variables are several firm-level variables derived from the firm’s balance sheet or income statement as well as some country variables. Among the firm-level variables, tangibility is defined as the ratio of fixed assets to total assets. This variable captures that it may be relatively easy to borrow against fixed assets. Next, log of sales is the logarithm of sales. This is a scaling variable to reflect that larger firms may have easier access to credit. Next, profitability is the ratio of earnings before interest, taxes, depreciation and amortization to total assets. Profitability may affect leverage in several ways. Profitable firms may be perceived to be relatively riskless, which would facilitate their access to credit. On the other hand, profitable firms may use their profits to pay down their debts or alternatively to finance investments through retained earnings. In either way, high profitability may lead to a low leverage. Among the country variables, creditor rights is an annual index of creditor rights in a country. Well protected creditor rights are expected to encourage leverage. Next, political risk is an annual index of political risks. High political risks may encourage borrowing from local creditors, as this is a way to reduce a multinational’s value at risk in a country. Inflation is the annual percentage change in the consumer price index. High inflation increases the value of the tax deductibility of interest to the extent that inflation leads to higher nominal interest rates. At the same time, an inflationary environment may also lead to a higher risk premium as part of the nominal interest rate, which discourages debt finance. Finally, the growth opportunities variable measures the median annual growth rate of sales in an industry in a particular country. Growth opportunities signal future profitability and possibly an ability to borrow.
5. Empirical results
Table 5 represents regressions along the lines of (6). The sample consists of all European subsidiaries in Amadeus. For each observation, an effective tax rate and a debt
shifting incentive variable can be constructed. All regressions in the table includes parent, industry and year fixed effects. Regression (1) includes the effective tax rate to the exclusion of the debt shifting incentive variable. The pertinent coefficient is estimated to be 0.259 and highly significant. The tangibility variable has a negative coefficient, while log of sales enters positively. Profitability obtains a negative coefficient, which suggests that the overall effect of higher profitability is to reduce leverage. Note that the 71,355 subsidiaries in the sample are associated with a total of 5,566 parent companies. Yearly observations of the same subsidiary are counted separately.
Regression (2) includes the debt shifting incentive variable. The estimated coefficient for this variable is positive and statistically significant, which confirms that leverage at any subsidiary of a multinational reflects the overall international tax system faced by the multinational. Next, regression (3) includes a set of additional, country-level controls. The creditor rights variable enters the regression positively and significantly. The political risk variable is equally positively and significantly related to leverage. As indicated, this may reflect that political risks lead a multinational to increase local borrowing in order to reduce its own capital at risk. Next, inflation has a negative and significant impact on leverage. This could reflect that in an inflationary environment there is more uncertainty about the ex post real interest rate to be paid on nominal debt denominated in the local currency. Finally, the growth opportunities variable enters the regression positively and significantly. High growth at the industry and country level may facilitate debt finance of the affected subsidiaries. Finally, in regression (4) adjusted financial leverage is taken to be the dependent variable. In other respects, regression (4) mimicks regression (3). The effective tax rate and debt shifting incentive variables continue to obtain positive and significant coefficients, albeit somewhat larger than before. Hence the adjustment of financial leverage for accounts payable and cash has little impact on the estimated impact of taxation on leverage. In regression (4), however, the political risk and growth opportunities variables cease to be obtain significant coefficients.
The estimated coefficients of regression (3) can serve to evaluate the size of the effect of taxation on leverage. First, the estimated size of β1 indicates the full effect of taxation on the
leverage of domestic, stand-alone firms (even though such firms have not been included in our sample). Specifically, the ‘domestic’ effect of an increase in the effective tax rate by 0.01 on leverage is 0.0021. Clearly enough, a tax reform leading to an increase of τ by 0.1 (or ten percent) will increase leverage by roughly 0.02 (or 2 percent). This effect is economically rather small. Next, the estimated size of β2 at 0.116 suggest an also somewhat small ‘international’ or ‘debt-shifting’ effect of taxation on leverage. As an example, we can take a hypothetical multinational firm that has a single foreign subsidiary with assets of equal size to those of the parent firm. In this instance, an increase of the effective tax rate by 0.01 in the subsidiary country has a positive ‘international’ effect on leverage in the subsidiary country of 0.00058 (or half of 0.00166). The sum effect of an increase of the effective tax rate by 0.01 on subsidiary leverage is now calculated to be 0.0027. In contrast, an increase in the effective tax in the parent country of 0.01 has a negative ‘international’ effect on leverage in the subsidiary of –0.00058.
Next, Table 6 presents some robustness checks taking regression (3) in Table 5 as a starting point. In regression 1, we correct standard errors for clustering across country-industry observations. The estimated coefficients for the two tax variables are virtually unchanged from those of the benchmark regression. Regression (2) in turn limits the sample to subsidiaries in the manufacturing sector. In this regression, the estimated sizes of β1 and β2 are somewhat smaller, and much larger, respectively. The relatively large size of β2 may reflect that manufacturing firms are relatively transparent. Hence, for these firms it may be relatively easy to borrow in one country against the assets located in other countries to explain that leverage in one country is relatively sensitive to international tax rate differences. Next, regression 3 limits the sample to foreign subsidiaries. This reduces the sample size to 23,296 subsidiaries rather than 49,248 in regression (3) in Table 5. Relative to the benchmark regression, the value of β2 is somewhat larger at 0.213. In regression (4) we only include subsidiaries of multinationals, i.e. of firms that have at least one foreign subsidiary. The estimated size of β1 and β2 are very similar to the benchmark results. Finally, in regression 5 we split the two tax variables into parts that exclude and are specifically due to non-resident dividend withholding taxes. The first
part is obtained by setting all withholding taxes to zero. The second part is obtained as the difference between the ‘regular’ tax rate variables and the tax variables excluding withholding taxes. Interestingly, only the tax variables exclusive of withholding taxes are estimated with positive and significant coefficients. This suggests that withholding taxes are not seen as part of the effective tax burden, possibly because they can be avoided by triangular arbitrage involving a conduit company in a tax haven.
6. Conclusions
This paper has considered the sensitivity of the capital structure of European firms to taxation. Generally this capital structure depends on the national or international structure of the firm and on the tax systems of all the countries where a firm operates. On the basis of a large sample of European firms over the 1999-2004 period, we find that a firm’s leverage depends on national tax rates as well as international tax rate differences. While statistically very significant, the size of the tax effect on leverage is rather small. The local tax effect on local leverage is larger for a multinational firm than for a stand-alone domestic firm on account of the international debt shifting. Corporate tax rates rather than non-resident dividend withholding tax rates appear to matter for leverage, as the latter may be easy to avoid for multinational firms by using conduit companies in third countries.
References
Altshuler, Rosanne and Harry Grubert, 2002, Repatriation taxes, repatriation strategies and multinational financial policy, Journal of Public Economics 87, 73-107.
Altshuler, Rosanne and Jack M. Mint, 1995, U.S. interest-allocation rules: effects and policy,
International Tax and Public Finance 2, 7-35.
Booth, Laurence, Varouj Aivazian, Asli Demirgüç-Kunt, Vojislav Maksimovic, 2001, Capital structures in developing countries, Journal of Finance 54, 87-130.
Bradley, M., G. Jarrell, and E.H. Kim, 1984, On the existence of an optimal capital structure: theory and evidence, Journal of Finance 39, 857-878.
Chowdhry, Bhagwan and Joshua D. Coval, 1998, Internal financing of multinational subsidiaries: Debt vs. equity, Journal of Corporate Finance 4, 87-106.
Collins, J.H. and D.A. Shackelford, 1992, Foreign tax credit limitations and preferred stock issuances, Journal of Accounting Research 30, 103-124.
Denis, Cécile, Harry Huizinga and Gaëtan Nicodème, 2005, Foreign ownership in Europe: determinants and taxation consequences, in The Internationalisation of Asset Ownership in
Europe, H. Huizinga and L. Jonung editors, Cambridge University Press.
Desai, Mihir A., C. Fritz Foley and James R. Hines Jr., 2003, A multinational perspective on capital structure choice and internal capital markets, NBER WP 9715.
Fama, Eugene F. and Kenneth R. French, 1998, Taxes, financing decisions, and firm value,
Journal of Finance 53, 819-843.
Froot, Kenneth A and James R. Hines, 1995, Interest allocation rules, financing patterns, and the operation of U.S. multinationals’ in Martin Feldstein, James R. Hines and R. Glenn Hubbard, eds., The effects on multinational corporations, University of Chicago Press, Chicago, 277-307.
Gordon, Roger H. and Young Lee, 2001, Do taxes affect corporate debt policy? Evidence from U.S. corporate tax return data, Journal of Public Economics 82, 195-224.
Graham, John R., 1996, Debt and the marginal tax rate, Journal of Financial Economics 41, 41-73.
Graham, John R., M.L. Lemmon and J.S. Schallheim, 1998, Debt, leases, taxes, and the endogeneity of corporate tax status, Journal of Finance 53, 131-162.
Graham, John R., 1999, Do personal taxes affect corporate financing decisions?, Journal of
Public Economics 73, 147-185.
Graham, John R., 2000, How big are the tax benefits of debt, Journal of Finance 55, 1901-1941.
Grubert, Harry, 1998, Taxes and the division of foreign operating income among royalties, interest, dividends and retained earnings, Journal of Public Economics 68, 269-290.
Hines, James. R. and R. G. Hubbard, 1990, Coming home to America: dividend repatriations by U.S. multinationals, in Assaf Razin and Joel Slemrod, eds., Taxation and the Global
Economy, University of Chicago, Chicago, 161-200.
Hodder, James E. and Lemma W. Senbet, 1990, International capital market equilibrium,
Journal of Finance 45, 1495-1516.
La Porta, Rafael, Florencio Lopez-De-Silanes, Adrei Shleifer and Robert W. Vishny, 1997, Legal determinants of external finance, Journal of Finance 1997, 1131-1150.
Job, Vijay and Jianmin Tang, 2001, Tax reforms, debt shifting and tax revenues: multinational corporations in Canada, International Tax and Finance 8, 5-25.
MacKie-Mason, Jeffrey K, 1990, Do taxes affect corporate financing decisions?, Journal of
Finance 45, 1471-1493.
Miller, Merton H., 1977, Debt and taxes, Journal of Finance 32, 261-275.
Mills, Lillian F. and Kaye J. Newberry, 2004, Do foreign multinationals’ tax incentives influence their U.S. income reporting and debt policy?, National Tax Journal 57, 89-107. Moore, Padraig J. and Frances P. Ruane, 2005, Taxation and the financial structure of foreign direct investment, IIIS Discussion Paper 88.
Newberry, Kaye J. and Dan S. Dhaliwal, 2001, Cross-jurisdictional income shifting by U.S. multinationals: evidence from international bond offerings, Journal of Accounting Research
39, 643-662.
Organization for Economic Cooperation and Development, 1997, Model tax convention on
income and on capital, Paris.
Rajan, Raghuram G. and Luigi Zingales, 1995, What do we know about capital structure? Some evidence from international data, Journal of Finance 50, 1421-1460.
Titman, Sheridan and Roberto Wessels, 1988, The determinants of capital structure choice,
Table 1
Corporate taxation and double-tax relief systems for dividend received in selected European countries (2004).
Source : International Bureau for Fiscal Documentation.
Taxation of dividend income Case of full ownership (2004)
Statutory corporate tax rate Including local taxes and
surcharges (%) (a)
Treatment of foreign dividends from Treaty partners
(b)
Treatment of foreign dividends from non-treaty countries
(c)
Austria 34 Exemption Exemption
Belgium 33.99 95% exemption 95% exemption
Bulgaria 19.5 Indirect credit Direct credit
Croatia 20 Exemption Exemption
Cyprus 15 Exemption Exemption
Czech rep. 28 Indirect credit Deduction
Denmark 30 Exemption Exemption
Estonia 2610 Indirect credit Indirect credit
Finland 29 Exemption Direct credit
France 35.4311 95% exemption 95% exemption
Germany 38.2912 95% exemption 95% exemption
Greece 35 Indirect credit Indirect credit
Hungary 17.6813 Exemption Exemption
Iceland 18 Exemption Exemption
Ireland 12.514 Indirect credit Indirect credit
Italy 37.25 95% Exemption 95% Exemption
Latvia 15 Exemption Exemption
Lithuania 15 Exemption Exemption
Luxembourg 30.3815 Exemption Exemption
Malta 35 Indirect credit Indirect credit
Netherlands 34.5 Exemption Exemption
Norway 28 Indirect credit Indirect credit
10 Zero percent on retained earnings. A distribution tax of 26% is applied on distributed profit. 11 Including a 3% social surcharge and a special 3.3% surcharge for large companies.
12 Including solidarity surcharge of 5.5% and an average (deductible) trade tax of 16.28%. 13 Including a deductible local business tax.
14 The rate is 25% for non-trading activities. 15 Including employment surcharge and local taxes.
Taxation of dividend income Case of full ownership (2004)
Statutory corporate tax rate Including local taxes and
surcharges (%) (a)
Treatment of foreign dividends from Treaty partners
(b)
Treatment of foreign dividends from non-treaty countries
(c)
Poland 19 Indirect credit16 Direct Credit
Portugal 27.5 Direct credit17 Direct credit
Romania 25 Indirect credit Indirect credit
Russia 24 Direct credit No relief
Slovak rep. 19 Exemption Exemption
Slovenia 25 Exemption Exemption
Spain 35 Exemption Indirect credit
Sweden 28 Exemption Exemption
Switzerland 21.7418 Exemption Exemption
Turkey 33 Indirect credit Direct credit
U.K. 30 Indirect credit Indirect credit
16 Indirect tax credit if holding 75% for two years and treaty, as well as in the cases where the EU Parent-subsidiary directive holds. 17 Exemption if EU Parent-Subsidiary directive applies (but foreign withholding tax is not creditable).
Table 2 Bilateral withholding tax on dividend payments between foreign subsidiary and parent (full ownership) on 1
stJanuary 2004.
2004 OE BE BG HR CY CZ DK EE FI FR DE GR HU IC IE IT LV LT LU MT NL NO PL PT RO RU SK SI ES SE CH TR GB Austria X 0 0 0 10 10 0 5 0 0 0 0 10 25 0 0 25 25 0 15 0 5 10 0 15 5 10 5 0 0 0 25 0 Belgium 0 X 10 5 10 5 0 5 0 0 0 0 10 5 0 0 5 5 0 15 0 5 5 0 5 10 5 5 0 0 10 15 0 Bulgaria 0 10 X 5 5 10 5 15 10 5 15 10 10 15 5 10 15 15 5 0 5 15 10 10 10 15 10 15 5 10 5 10 10 Croatia 0 10 15 X 10 5 5 15 5 5 5 5 5 15 5 10 5 5 15 5 10 15 5 15 5 5 5 15 15 5 5 10 5 Cyprus 0 0 0 0 X 0 0 0 0 0 0 0 0 0 0 0 0 0 0 0 0 0 0 0 0 0 0 0 0 0 0 0 0 Czech Rep. 10 5 10 5 10 X 15 5 5 10 5 15 5 5 5 15 5 5 5 5 0 5 5 10 10 10 5 5 5 0 5 10 5 Denmark 0 0 5 5 10 15 X 0 0 0 0 0 5 0 0 0 5 5 0 0 0 0 0 0 10 10 15 5 0 0 0 15 0 Estonia 0 0 0 0 0 0 0 X 0 0 0 0 0 0 0 0 0 0 0 0 0 0 0 0 0 0 0 0 0 0 0 0 0 Finland 0 0 10 5 29 0 0 5 X 0 0 0 5 0 0 0 0 0 0 0 0 0 0 0 0 0 0 5 0 0 0 15 0 France 0 0 5 5 10 10 0 5 0 X 0 0 5 5 0 0 5 5 0 5 0 0 5 0 10 10 10 5 0 0 5 15 0 Germany 0 0 15 15 10 5 0 5 0 0 X 0 5 5 0 0 5 5 0 5 0 0 5 0 10 5 5 15 0 0 0 15 0 Greece 0 0 0 0 0 0 0 0 0 0 0 X 0 0 0 0 0 0 0 0 0 0 0 0 0 0 0 0 0 0 0 0 0 Hungary 10 10 10 5 5 5 5 20 5 5 5 10 X 20 5 10 20 20 5 5 5 10 10 10 5 10 5 10 5 5 10 10 5 Iceland 15 5 15 15 15 5 0 5 0 5 5 15 15 X 15 15 5 5 5 15 0 0 5 10 15 15 5 15 5 0 5 15 5 Ireland 0 20 0 0 0 0 0 0 0 0 0 20 0 20 X 0 0 0 0 20 0 0 0 0 0 0 0 0 0 0 0 20 0 Italy 0 0 10 10 15 15 0 5 0 0 0 0 10 27 0 0 27 5 0 15 0 15 10 0 10 5 15 10 0 0 15 15 0 Latvia 10 5 10 5 10 5 5 5 5 5 5 10 10 5 5 10 X 0 10 5 5 5 5 10 10 10 10 5 10 10 10 10 5 Lithuania 0 0 0 0 0 0 0 0 0 0 0 0 0 0 0 0 0 X 0 0 0 0 0 0 0 0 0 0 0 0 0 0 0 Luxembourg 0 0 0 20 20 0 0 20 0 0 0 0 0 0 0 0 20 20 X 0 0 0 0 0 0 0 0 0 0 0 0 20 0 Malta 0 0 0 0 0 0 0 0 0 0 0 0 0 0 0 0 0 0 0 X 0 0 0 0 0 0 0 0 0 0 0 0 0 Netherlands 0 0 5 0 25 0 0 5 0 0 0 0 5 0 0 0 5 5 0 5 0 0 5 0 0 5 0 5 0 0 0 5 0 Norway 5 15 15 15 0 5 0 5 0 0 0 20 10 0 0 15 5 5 5 15 0 X 5 10 10 10 5 15 10 0 5 20 5 Poland 10 10 10 5 10 5 5 5 5 5 5 15 10 5 0 10 5 5 5 5 5 5 X 10 15 10 5 5 5 5 5 10 5 Portugal 0 0 10 25 25 10 0 25 0 0 0 0 10 10 0 0 10 10 0 10 0 10 10 0 10 10 25 25 0 0 10 25 0 Romania 15 5 10 5 10 10 10 10 5 10 5 15 5 15 3 10 10 10 5 5 5 10 5 10 X 15 10 5 10 10 10 15 10 Russia 5 15 15 5 0 10 10 15 5 5 5 15 10 5 10 5 15 15 10 15 5 10 10 10 15 X 10 10 5 5 5 10 10 Slovak Rep. 0 0 0 0 0 0 0 0 0 0 0 0 0 0 0 0 0 0 0 0 0 0 0 0 0 0 X 0 0 0 0 0 0 Slovenia 5 5 15 15 10 5 5 15 5 5 15 10 10 15 5 10 5 5 5 5 5 15 5 15 5 10 5 X 5 5 5 15 5 Spain 0 0 5 15 15 5 0 15 0 0 0 0 5 5 0 0 15 5 0 15 0 10 5 0 5 5 5 5 0 0 10 5 0 Sweden 0 0 0 0 0 0 0 0 0 0 0 0 0 0 0 0 0 0 0 0 0 0 0 0 0 0 0 0 0 X 0 0 0 Switzerland 5 10 5 35 35 5 0 35 5 5 5 5 10 5 10 15 5 5 0 35 0 5 5 10 10 5 5 5 10 0 X 35 5 Turkey 11 11 11 11 11 11 11 11 11 11 11 11 11 11 11 11 11 11 11 11 11 11 11 11 11 11 5.5 11 5.5 11 11 X 11 United Kingdom 0 0 0 0 0 0 0 0 0 0 0 0 0 0 0 0 0 0 0 0 0 0 0 0 0 0 0 0 0 0 0 0 XSource: International Bureau for Fiscal Documentation. Notes : (a) The Parent-Subsidiary directive is binding between EU Member States and provides exemption from withholding tax when holding is at least 25%. It is applied by all new Member States from May 2004. (b) Ireland: companies located in EU or treaty countries are exempt from withholding tax provided that they are not under the control of persons not resident in such countries. (c) Estonia: general exemption from withholding tax if holding in foreign company is at least 20%. (d) Italy: if the recipient can prove a tax is paid in its country on the dividend, the Italian authorities can provide a refund equal to the tax claimed limited to 4/9 of the Italian Withholding tax. (e) Lithuania: general exemption from withholding tax if holding in foreign company is at least 10%. (f) Luxembourg: exemption from withholding tax for EU and treaty partners if holding in foreign company is at least 10%. (g) Sweden: No withholding tax if there is normal corporate taxation in the foreign country and if the shares are hold on business-related reasons.
Table 3
Existence of a bilateral tax treaty on January 1
st2004.
2004 OE BE BG HR CY CZ DK EE FI FR DE GR HU IC IE IT LV LT LU MT NL NO PL PT RO RU SK SI ES SE CH TR GB OE X 1 1 1 1 1 1 1 1 1 1 1 1 0 1 1 0 0 1 1 1 1 1 1 1 1 1 1 1 1 1 1 1 BE 1 X 1 1 1 1 1 1 1 1 1 1 1 1 1 1 1 1 1 1 1 1 1 1 1 1 1 1 1 1 1 1 1 BG 1 1 X 1 1 1 1 0 1 1 1 1 1 0 1 1 0 0 1 1 1 1 1 1 1 0 1 0 1 1 1 0 1 HR 1 1 0 X 0 1 1 0 1 1 1 1 1 0 1 1 1 1 0 0 1 1 1 0 1 1 1 0 0 1 0 0 1 CY 1 1 1 0 X 1 1 0 0 1 1 1 1 0 1 1 0 0 0 1 0 1 1 0 1 1 1 1 0 1 0 0 1 CZ 1 1 1 1 1 X 1 1 1 1 1 1 1 1 1 1 1 1 1 0 1 1 1 1 1 1 1 1 1 1 1 0 1 DK 1 1 1 1 1 1 X 1 1 1 1 1 1 1 1 1 1 1 1 1 1 1 1 1 1 1 1 1 1 1 1 1 1 EE 1 1 0 0 0 1 1 X 1 1 1 0 0 1 1 1 1 1 0 0 1 1 1 0 0 0 0 0 0 1 0 0 1 FI 1 1 1 1 0 1 1 1 X 1 1 1 1 1 1 1 1 1 1 1 1 1 1 1 1 1 1 1 1 1 1 1 1 FR 1 1 1 1 1 1 1 1 1 X 1 1 1 1 1 1 1 1 1 1 1 1 1 1 1 1 1 1 1 1 1 1 1 DE 1 1 1 1 1 1 1 1 1 1 X 1 1 1 1 1 1 1 1 1 1 1 1 1 1 1 1 1 1 1 1 1 1 GR 1 1 1 1 1 1 1 0 1 1 1 X 1 0 1 1 0 0 1 0 1 1 1 1 1 0 1 1 1 1 1 0 1 HU 1 1 1 1 1 1 1 0 1 1 1 1 X 0 1 1 0 0 1 1 1 1 1 1 1 1 1 1 1 1 1 1 1 IC 0 1 0 0 0 1 1 1 1 1 1 0 0 X 0 0 1 1 1 0 1 1 1 1 0 1 1 0 1 1 1 0 1 IE 1 1 1 1 1 1 1 1 1 1 1 0 1 0 X 1 1 1 1 0 1 1 1 1 1 1 1 1 1 1 1 0 1 IT 1 1 1 1 1 1 1 1 1 1 1 1 1 0 1 X 0 1 1 1 1 1 1 1 1 1 1 1 1 1 1 1 1 LV 0 1 0 1 0 1 1 1 1 1 1 0 0 1 1 0 X 1 0 0 1 1 1 1 1 0 1 1 0 1 1 1 1 LT 0 1 0 1 0 1 1 1 1 1 1 0 0 1 1 1 1 X 0 0 1 1 1 1 1 0 1 1 1 1 1 0 1 LU 1 1 1 0 0 1 1 0 1 1 1 1 1 1 1 1 0 0 X 1 1 1 1 1 1 1 1 1 1 1 1 0 1 MT 1 1 1 1 1 1 1 1 1 1 1 0 1 0 0 1 1 0 1 X 1 1 1 1 1 0 1 1 0 1 1 0 1 NL 1 1 1 1 0 1 1 1 1 1 1 1 1 1 1 1 1 1 1 1 X 1 1 1 1 1 1 1 1 1 1 1 1 NO 1 1 1 1 1 1 1 1 1 1 1 1 1 1 1 1 1 1 1 1 1 X 1 1 1 1 1 1 1 1 1 1 1 PL 1 1 1 1 1 1 1 1 1 1 1 1 1 1 1 1 1 1 1 1 1 1 X 1 1 1 1 1 1 1 1 1 1 PT 1 1 1 0 0 1 1 0 1 1 1 1 1 1 1 1 1 1 1 1 1 1 1 X 1 1 1 0 1 1 1 0 1 RO 1 1 1 1 1 1 1 0 1 1 1 1 1 0 1 1 1 1 1 0 1 1 1 1 X 1 1 1 1 1 1 1 1 RU 1 1 1 1 1 1 1 0 1 1 1 0 1 1 1 1 0 0 1 0 1 1 1 1 1 X 1 0 1 1 1 1 1 SK 1 1 1 1 1 1 1 0 1 1 1 1 1 1 1 1 1 1 1 1 1 1 1 1 1 1 X 1 1 1 1 1 1 SI 1 1 0 0 1 1 1 0 1 1 1 1 1 0 1 1 1 1 1 1 1 1 1 0 1 1 1 X 1 1 1 0 1 ES 1 1 1 0 0 1 1 0 1 1 1 1 1 1 1 1 0 1 1 0 1 1 1 1 1 1 1 1 X 1 1 1 1 SE 1 1 1 1 1 1 1 1 1 1 1 1 1 1 1 1 1 1 1 1 1 1 1 1 1 1 1 1 1 X 1 1 1 CH 1 1 1 0 0 1 1 0 1 1 1 1 1 1 1 1 1 1 1 1 1 1 1 1 1 1 1 1 1 1 X 0 1 TR 1 1 1 1 0 0 1 0 1 1 1 0 1 0 0 1 0 1 0 0 1 1 1 0 1 1 1 0 1 1 0 X 1 GB 1 1 1 1 1 1 1 1 1 1 1 1 1 1 1 1 1 1 1 1 1 1 1 1 1 1 1 1 1 1 1 1 XTable 4
Descriptive Statistics for Subsidiaries of European Multinationals
Panel A lists the number of parent companies and subsidiaries (by home and host country) in the sample. Panel B presents the sample averages of financial leverage and tax variables. Panel C presents the summary statistics for the financial leverage, tax, and other variables for subsidiaries only. Financial leverage is the ratio of total liabilities to total assets. Adjusted financial leverage is the ratio of total liabilities minus accounts payables minus cash to total assets minus accounts payables minus cash. Effective marginal tax rate (τ) is the statutory tax rate on dividend income generated in the subsidiary country, taking withholding taxes and the tax system for foreign source income into account. Tax incentive to shift debt is the sum of international tax differences between subsidiary countries weighted by subsidiary asset shares, taking withholding taxes and the international tax system into account. Tangibility is the ratio of subsidiary fixed assets to subsidiary total assets. Log of sales is the logarithm of subsidiary sales. Profitability is the ratio of subsidiary earnings before interest, taxes, depreciation and amortization to subsidiary total assets. Creditor rights is the annual index of credit rights in the country from Djankov et al. (2005). Political risk is the annual (December) index of political risk from International Country Risk Guide. We inverted the scale from 0-100 with higher scores indicating greater risk. Inflation is the annual percentage change in CPI of the subsidiary’s host country from World Development Indicators. Growth opportunities is the median of the annual growth rate of subsidiary sales in a subsidiary’s country and industry. Sample consists of parent companies and subsidiaries of European firms in Amadeus.
Panel A: Number of parent companies and subsidiaries
Number of parent companies: Number of subsidiaries:
Country by home country by home country by host country
Austria 184 397 385 Belgium 3840 8864 10463 Bulgaria 158 678 50 Croatia 0 0 177 Cyprus 0 0 2 Czech Rep 5 10 421 Denmark 1159 3304 2041 Estonia 48 105 169 Finland 916 1986 2435 France 4360 11491 10109 Germany 1763 6245 3716 Greece 1316 2650 1993 Hungary 50 136 373 Iceland 130 333 315 Ireland 280 770 418
Italy 3982 6111 6553 Latvia 9 42 71 Lithuania 36 52 55 Luxembourg 42 61 162 Netherlands 2902 6024 3641 Norway 1005 2457 4184 Poland 147 311 541 Portugal 551 793 1757 Romania 15 12 331 Russia 37 82 24 Slovak Rep 21 46 27 Slovenia 129 163 42 Spain 6954 14844 18818 Sweden 3391 7888 5952 Switzerland 388 483 444 UK 4918 14261 14930 Total 38736 90599 90599
Panel B: Financial leverage and marginal tax rates
Financial leverage Adjusted financial leverage Effective marginal tax rate Tax incentive to shift debt Parent companies: Subsidiaries: Parent companies: Subsidiaries: Subsidiaries: Subsidiaries: Country by home country by host country by home country by host country by host country by host country Austria 0.58 0.61 0.52 0.56 0.34 -0.008 Belgium 0.66 0.66 0.50 0.51 0.40 0.007 Bulgaria 0.56 0.42 0.43 0.33 0.30 -0.005 Croatia 0.48 0.32 -0.002 Cyprus 0.15 0.06 0.35 0.000 Czech Rep 0.47 0.45 0.27 0.22 0.42 0.008 Denmark 0.62 0.65 0.54 0.57 0.31 -0.004 Estonia 0.49 0.50 0.26 0.27 0.14 -0.029 Finland 0.56 0.55 0.45 0.46 0.29 -0.009 France 0.60 0.63 0.43 0.46 0.37 0.003 Germany 0.65 0.66 0.58 0.60 0.49 0.028 Greece 0.54 0.55 0.38 0.38 0.42 0.003 Hungary 0.50 0.49 0.40 0.43 0.26 -0.072 Iceland 0.57 0.63 0.47 0.57 0.43 0.015 Ireland 0.59 0.58 0.41 0.43 0.26 -0.012 Italy 0.73 0.70 0.61 0.58 0.45 0.014 Latvia 0.71 0.62 0.47 0.38 0.33 0.015 Lithuania 0.60 0.56 0.46 0.32 0.28 0.004 Luxembourg 0.68 0.58 0.59 0.48 0.37 -0.004 Netherlands 0.63 0.63 0.52 0.52 0.35 -0.002 Norway 0.63 0.63 0.52 0.51 0.33 -0.005 Poland 0.56 0.54 0.37 0.40 0.35 -0.006 Portugal 0.63 0.63 0.54 0.50 0.37 0.001 Romania 0.80 0.52 0.59 0.37 0.37 0.003 Russia 0.36 0.48 0.18 0.17 0.35 0.015 Slovak Rep 0.48 0.48 0.33 0.34 0.42 0.002
Slovenia 0.36 0.40 0.37 -0.008 Spain 0.61 0.60 0.45 0.45 0.35 -0.001 Sweden 0.61 0.62 0.51 0.53 0.29 -0.009 Switzerland 0.52 0.58 0.37 0.49 0.31 -0.020 UK 0.57 0.62 0.44 0.50 0.31 -0.010 Total 0.62 0.62 0.49 0.49 0.36 0.000
Panel C: Summary statistics of leverage, tax, and control variables
Variable No. of observations Average Standard Deviation Minimum Maximum Financial leverage 90599 0.62 0.21 0.00 1.00 Adjusted financial leverage 86516 0.49 0.27 0.00 1.00 Effective marginal tax rate 90599 0.36 0.06 0.00 0.67 Tax incentive to shift debt 66462 0.00 0.03 -0.33 0.27 Tangibility tor rights 89945 2.07 1.18 0.00 4.00 90233 0.38 0.26 0.00 1.00 Log of sales 81747 10.40 1.93 0.00 18.56 Profitability 74812 0.11 0.19 -10.13 28.03 Credi Political Risk 90517 16.56 5.86 3.00 57.00 Inflation 90599 2.64 3.78 -1.18 154.76 Growth opportunities 78310 0.00 0.42 -7.26 14.00
Table 5
The Impact of Domestic and International Taxes on the Financial Leverage of Subsidiaries of Multinational Firms
The dependent variable in columns (1) to (4) is the ratio of subsidiary total liabilities to subsidiary total assets. The dependent variable in column (4) is the ratio of total liabilities minus accounts payables minus cash to total assets minus accounts payables minus cash. Effective marginal tax rate (τ) is the statutory tax rate on dividend income generated in the subsidiary country, taking withholding taxes and the tax system for foreign source income into account. Tax incentive to shift debt is the sum of international tax differences between subsidiary countries weighted by subsidiary asset shares, taking withholding taxes and the international tax system into account. Tangibility is the ratio of subsidiary fixed assets to subsidiary total assets. Log of sales is the logarithm of subsidiary sales. Profitability is the ratio of subsidiary earnings before interest, taxes, depreciation and amortization to subsidiary total assets. Creditor rights is the annual index of credit rights in the country from Djankov et al. (2005). Political risk is the annual (December) index of political risk from International Country Risk Guide. We inverted the scale from 0-100 with higher scores indicating greater risk. Inflation is the annual percentage change in CPI of the subsidiary’s host country from World Development Indicators. Growth opportunities is the median of the annual growth rate of subsidiary sales in a subsidiary’s country and industry. Sample consists of subsidiaries of European companies in Amadeus. All regressions are estimated using OLS and include parent, industry, and year fixed effects. We report White (1980)’s heteroskedasticity-consistent standard errors between brackets. * denotes significance at 10%; ** significance at 5%; and *** significance at 1%.
(1) (2) (3) (4)
Financial leverage Financial leverage Financial leverage Adjusted financial leverage Effective marginal tax rate 0.259*** 0.199*** 0.212*** 0.238***
(0.017) (0.030) (0.031) (0.042) Tax incentive to shift debt 0.117*** 0.116*** 0.168***
(0.040) (0.042) (0.057) Tangibility -0.130*** -0.123*** -0.120*** 0.105*** (0.005) (0.006) (0.006) (0.008) Log of sales 0.022*** 0.023*** 0.023*** 0.022*** (0.001) (0.001) (0.001) (0.001) Profitability -0.062** -0.055** -0.060* -0.081* (0.025) (0.027) (0.032) (0.042) Creditor rights 0.006*** 0.019*** (0.001) (0.002) Political risk 0.001*** -0.000 (0.000) (0.000) Inflation -0.001*** -0.002*** (0.000) (0.000) Growth opportunities 0.022*** 0.011 (0.008) (0.009)
Parent, industry, and year fixed effects Y Y Y Y No. of subsidiaries 71355 52310 49248 47511 No. of parent companies 5566 5118 5064 5016 R-squared 0.08 0.08 0.08 0.05
Table 6
The Impact of Taxes on the Financial Leverage of Subsidiaries of Multinational Firms: Robustness Checks
The dependent variable is the ratio of subsidiary total liabilities to subsidiary total assets. Effective marginal tax rate (τ) is the statutory tax rate on dividend income generated in the subsidiary country, taking withholding taxes and the tax system for foreign source income into account. Tax incentive to shift debt is the sum of international tax differences between subsidiary countries weighted by subsidiary asset shares, taking withholding taxes and the international tax system into account. In column (1), we correct standard errors correct for clustering across country-industry observations. In column (2), we only include subsidiaries operating in the manufacturing industries. In column (3), we only include the subset of foreign subsidiaries. In column (4), we only include subsidiaries of multinational companies. In column (5), we split both tax variables in one component that does not depend on withholding taxes and another component that depends on withholding taxes. Tangibility is the ratio of subsidiary fixed assets to subsidiary total assets. Log of sales is the logarithm of subsidiary sales. Profitability is the ratio of subsidiary earnings before interest, taxes, depreciation and amortization to subsidiary total assets. Creditor rights is the annual index of credit rights in the country from Djankov et al. (2005). Political risk is the annual (December) index of political risk from International Country Risk Guide. We inverted the scale from 0-100 with higher scores indicating greater risk. Inflation is the annual percentage change in CPI of the subsidiary’s host country from World Development Indicators. Growth opportunities is the median of the annual growth rate of subsidiary sales in a subsidiary’s country and industry. Sample consists of subsidiaries of European companies in Amadeus. All regressions are estimated using OLS and include parent, industry, and year fixed effects. We report White (1980)’s heteroskedasticity-consistent standard errors between brackets. * denotes significance at 10%; ** significance at 5%; and *** significance at 1%.
(1) (2) (3) (4) (5)
Clustering Manufacturing Foreign Multinationals Effective marginal tax rate 0.212*** 0.180*** 0.231*** 0.234***
(0.052) (0.045) (0.043) (0.039) Tax incentive to shift debt 0.116* 0.282*** 0.213*** 0.106**
(0.059) (0.064) (0.053) (0.047)
Effective marginal tax rate excl. withholding taxes 0.214*** (0.032) Tax incentive to shift debt excl. withholding taxes 0.129***
(0.043) Effective marginal tax rate due to withholding taxes 0.194 (0.136) Tax incentive to shift debt due to withholding taxes -0.220 (0.180) Tangibility -0.120*** -0.080*** -0.116*** -0.115*** -0.119*** (0.014) (0.010) (0.009) (0.007) (0.006) Log of sales 0.023*** 0.019*** 0.018*** 0.020*** 0.023*** (0.002) (0.002) (0.001) (0.001) (0.001) Profitability -0.060** -0.131*** -0.144*** -0.052 -0.060*
(0.030) (0.023) (0.015) (0.036) (0.032) Creditor rights 0.006** 0.009*** 0.016*** 0.007*** 0.006*** (0.003) (0.002) (0.002) (0.001) (0.001) Political risk 0.001* 0.001*** 0.001** 0.001*** 0.001*** (0.000) (0.000) (0.000) (0.000) (0.000) Inflation -0.001** -0.002*** -0.001*** -0.001*** -0.001*** (0.000) (0.000) (0.000) (0.000) (0.000) Growth opportunities 0.022*** 0.014 0.039*** 0.029*** 0.022*** (0.006) (0.010) (0.009) (0.008) (0.008) Parent, industry, and year fixed effects Y Y Y Y Y Observations 49248 19397 23296 30187 49248 Number of parent 5064 2416 2844 2883 5064 R-squared 0.08 0.06 0.09 0.08 0.08
Appendix . The taxation of dividends relative to interest on internal debt.
Interest on internal debt is generally deductible from taxable corporate income in the subsidiary country. The subsidiary country, however, may impose a non-resident interest withholding tax on the outgoing internal interest payment. Let this interest withholding tax be denoted . Information on bilateral interest withholding taxes for 2004 in Europe is presented in Table A1. The internal interest is received by the parent firm and in the parent country may or may not be subject to corporate income taxation subject and subsequent double-tax relief. Again, here there are three possibilities: the parent country may apply an exemption, a credit or a deduction to the foreign interest income. Table A2 provides information on the double taxation rules applicable to incoming interest from treaty and non-treaty signatory countries, respectively. Foreign source interest benefits from a tax credit in most countries. This is particularly the case for interest payments originating from tax treaty partner countries with Cyprus being an exception to this.
d i
w
Let
σ
i denote the effective international taxation of internal interest income. In case of an exemption of foreign interest income, we simply have = . In case of a foreign tax credit, we have = max [ti
σ
di
w
i
σ
p,w
id]. Finally, in case of a deduction we haveσ
i = tp +w
id- tp. Let ϕ
d i
w
i be the taxation of dividends relative to interest on internal debt so that = -. Clearly, depends on the possibly different double tax relief provided by the parent country for both foreign dividend and foreign interest income. Expressions fori