VTT PUBLICATIONS 447
TECHNICAL RESEARCH CENTRE OF FINLAND ESPOO 2001
Effects of weather-controlled
variable message signing
on driver behaviour
Pirkko Rämä
VTT Building and Transport
Dissertation for the degree of Doctor of Science (Technology) to be presented with due permission for public examination and debate in Auditorium at Helsinki University of Technology (Otakaari 4, Espoo,
ISBN 951–38–5871–5 (soft back ed.) ISSN 1235–0621 (soft back ed.)
ISBN 951–38–5872–3 (URL: http://www.inf.vtt.fi/pdf/) ISSN 1455–0849 (URL: http://www.inf.vtt.fi/pdf/)
Copyright © Valtion teknillinen tutkimuskeskus (VTT) 2001 JULKAISIJA – UTGIVARE – PUBLISHER
Valtion teknillinen tutkimuskeskus (VTT), Vuorimiehentie 5, PL 2000, 02044 VTT puh. vaihde (09) 4561, faksi (09) 456 4374
Statens tekniska forskningscentral (VTT), Bergsmansvägen 5, PB 2000, 02044 VTT tel. växel (09) 4561, fax (09) 456 4374
Technical Research Centre of Finland (VTT), Vuorimiehentie 5, P.O.Box 2000, FIN–02044 VTT, Finland phone internat. + 358 9 4561, fax + 358 9 456 4374
VTT Rakennus- ja yhdyskuntatekniikka, Liikenne ja logistiikka, Lämpömiehenkuja 2, PL 1800, 02044 VTT
puh. vaihde (09) 4561, faksi (09) 464 850
VTT Bygg och transport, Trafikteknik och logistik, Värmemansgränden 2, PB 1800, 02044 VTT tel. växel (09) 4561, fax (09) 464 850
VTT Building and Transport, Transport and Logistics, Lämpömiehenkuja 2, P.O.Box 1800, FIN–02044 VTT, Finland phone internat. + 358 9 4561, fax + 358 9 464 850
Rämä, Pirkko. Effects of weather-controlled variable message signing on driver behaviour. Espoo 2001. Technical Research Centre of Finland, VTT Publications 447. 55 p. + app. 50 p.
Keywords traffic signs, speed limit, variable message signs, VMS, cold weather, driver behavior, road condition, slippery, evaluation, information systems, winter, road surface, ice, traffic safety
Abstract
This study investigated the effects of local and frequently updated information about adverse weather and road conditions on driver behaviour. The information was transmitted by several types of variable message signs (VMS). Two evaluations investigated the effects of VMS systems involving an individual sign or two signs; two other evaluations focused on more extensive VMS systems involving several signs, and two evaluations studied the effects of the sign technology. The slippery road condition sign and minimum headway sign decreased the mean speed of cars travelling in free-flow traffic by 1–2 km/h. The minimum headway sign also decreased the proportion of short headways. In addition, drivers’ reports suggested that these variable message signs have other effects on driver behaviour, such as the refocusing of attention to seek cues on potential hazards, testing the slipperiness of the road, and more careful passing behaviour. Lowering the speed limit from 100 km/h to 80 km/h on a weather-controlled road decreased the mean speed by an average of 3.4 km/h in winter. The system proved most effective when adverse weather and road conditions were not easy to detect. The system also decreased the standard deviation of speed. Most drivers accepted lowered speed limits and found variable speed limits useful. Variable speed limit signs using fibre-optic technology were found to be more effective than electromechanical signs. However, effective signs may divert the driver’s attention from adjacent fixed signing. The slippery road condition sign is recommended for careful use at critical spots, whereas a system including variable speed limits is recommended for somewhat longer road sections. The use of fibre-optic signs is recommended for weather-controlled applications.
Foreword
This study was carried out at the Technical Research Centre of Finland (VTT), Transport and Logistics. I would like to thank my superiors at VTT for providing excellent facilities and support for the work.
I have been fortunate to work with my academic advisor Juha Luoma. I wish to thank him for his guidance in scientific thinking and writing, and for giving his time and advice whenever needed. I was privileged to start the first field experiment with Risto Kulmala, to whom I would like to express my thanks for his support and valuable discussions throughout the study. Many thanks also to all my colleagues at VTT who contributed to the study and created an excellent and productive working atmosphere at our institute.
The research would not have been possible without the investments and financial support of the Finnish Road Administration (Finnra). I wish to thank all my colleagues at Finnra who were involved in the field studies for their excellent co-operation. In particular, I am grateful to Yrjö Pilli-Sihvola for his ever positive and innovative attitude towards research.
I would also like to thank Arja Wuolijoki for the layout of the thesis. Adelaide Lönnberg has done an excellent job correcting the English language.
Finally, I would like to extend my heartfelt thanks to my family: my parents for their encouragement and help, my children Anna and Jussi, and especially my husband Martti for their love and support.
List of original articles
The study is based on the following articles referred to in the text by their Roman numerals (see Appendices I–VI):
(I) Rämä, P. and Kulmala, R. 2000. Effects of variable message signs for slippery road conditions on driving speed and headways. Transportation Research Part F, Vol. 3, pp. 85–94.
(II) Luoma, J., Rämä, P., Penttinen, M. and Anttila, V. 2000. Effects of variable message signs for slippery road conditions on reported driver behaviour. Transportation Research Part F, Vol. 3, pp. 75–84.
(III) Rämä, P. 1999. Effects of weather-controlled variable speed limits and warning signs on driver behavior. Transportation Research Record, 1689, pp. 53–59. (IV) Rämä, P. and Luoma, J. 1997. Driver acceptance of weather-controlled road signs
and displays. Transportation Research Record, 1573, pp. 72–75.
(V) Luoma, J. and Rämä, P. 1998. Effects of variable speed limit signs on speed behaviour and recall of signs. Traffic Engineering + Control, Vol. 39, pp. 234–237. (VI) Rämä, P., Luoma, J. and Harjula, V. 1999. Distraction due to variable speed limits.
Contents
ABSTRACT... 3
FOREWORD ... 5
LIST OF ORIGINAL ARTICLES... 6
1. INTRODUCTION... 9
1.1 Need to provide real time information on weather and road conditions ... 9
1.2 Traffic safety and driver behaviour during adverse weather and road conditions... 10
1.2.1 Traffic safety in winter ... 10
1.2.2 Driver behaviour in slippery road conditions ... 11
1.3 Traffic sign information as a measure to prevent accidents under poor road conditions... 12
1.3.1 Fixed traffic signs ... 12
1.3.2 Effects of fixed signs on driver behaviour ... 13
1.4 Potential of variable message signs... 14
1.4.1 Application areas of variable message sign systems... 14
1.4.2 Effects of weather-controlled variable message signs on driver behaviour ... 15
1.4.3 The Finnish approach to weather-controlled variable message signs . 15 1.5 Driver behaviour and sign information ... 16
1.5.1 The driver as an information processor... 16
1.5.2 Potential to influence drivers’ risk perception by real time sign information ... 19
1.6 Purpose of the study... 20
2. EFFECTS OF VARIABLE MESSAGE SIGNS FOR SLIPPERY ROAD CONDITIONS (STUDIES I AND II)... 22
2.1 Method ... 22 2.1.1 Study I... 22 2.1.2 Study II ... 23 2.2 Results... 23 2.2.1 Effects on speed... 23 2.2.2 Effects on headways ... 24
2.2.4 Effects of the minimum headway sign on reported behaviour... 26
2.2.5 Correlation of the reported effects ... 27
3. EFFECT OF WEATHER-CONTROLLED SIGN SYSTEM (STUDIES III AND IV)... 28
3.1 Method ... 28
3.1.1 Description of the system ... 28
3.1.2 Design and data collection... 28
3.2 Results... 29
3.2.1 Speed effects... 29
3.2.2 Assessment of the system reliability... 31
3.2.3 Recall and acceptance of the variable message signs ... 32
4. EFFECT AND SIDE EFFECTS OF FIBRE-OPTIC SIGNS (STUDIES V AND VI) ... 34
4.1 Method ... 34
4.2 Results... 35
4.2.1 Driver behaviour... 35
4.2.2 Recall of signs... 36
5. DISCUSSION ... 37
5.1 Speed effects of variable message signs ... 37
5.2 Other effects... 41
5.3 Recall and acceptance of variable message signs ... 42
5.4 Assessment of the used approach and designs ... 44
6. IMPLICATIONS AND RECOMMENDATIONS... 46
REFERENCES ... 49 APPENDICES
Studies I–VI
Appendices of this publication are not included in the PDF version. Please order the printed version to get the complete publication (http://otatrip.hut.fi/vtt/jure/index.html)
1. Introduction
1.1 Need to provide real time information on weather and
road conditions
In many northern countries a considerable share of all accidents occur in adverse weather and road conditions, when friction between tyres and the road is low because of rain, snow or ice. The main measures against these accidents have traditionally been winter maintenance operations (i.e. snow removal, de-icing with salt, sanding etc.), use of winter tyres, and providing information (e.g. weather forecasts, driver training and information).
Current developments in winter maintenance, such as preventive salting of roads based on weather forecasts have also required improved monitoring and data collection on weather and road conditions. New technology has produced smart sensors and automated data collection, and modification and processing systems such as road weather stations. At the same time, the development of transport telematics or ITS (Intelligent Transport Systems) has led the road authorities to devote more attention to providing traffic information. Traffic Management Centres (TMC, in co-operation with the Road Weather Centres) have been established to collect a wide range of data from the roads, manage and process it, and deliver information to maintenance personnel, drivers and many other interest groups. Consequently, the road authorities have a large quantity of updated information which is useful for many purposes, including traffic management and information.
Despite investments in winter maintenance there is normally a delay between detection of slipperiness and maintenance operations. In Sweden, Öberg (1993) estimated that accident risk in the hour preceding maintenance operations is 12 times higher compared with 12 hours earlier. However, during this most risky hour TMC operators are usually aware of the slippery conditions. Thus important and useful information already exists; the fundamental issue is its efficient and rapid delivery to drivers.
However, providing information does not guarantee that drivers will use it optimally by modifying their behaviour. Many studies have failed to show that information, whether in the form of information campaigns, driver training or warning signs, is an efficient way to improve traffic safety (e.g. Evans 1991, Wilde 1994). The ITS applications, however, have provided new and potentially effective means to improve the quality of information. Specifically, information about adverse road and weather conditions can be real time and local. Moreover, variable message signs (VMS) can display several individual messages, and variable speed limits can form part of an extensive traffic control system.
1.2 Traffic safety and driver behaviour during adverse
weather and road conditions
1.2.1 Traffic safety in winter
Overall, in the last few decades traffic safety in Finland has shown positive trends. Figure 1 shows that the accident rate (i.e. accidents per vehicle kilometre) has fallen steadily since 1979 (Malmivuo and Peltola 1997). In the 1980s, when experiments with weather-controlled VMS began, the risk of fatal accident was clearly higher in winter than in summer. Since the 1990s when lower speed limits were introduced in winter, the risk of fatal accident has generally been the same in both seasons (Figure 1).
Figure 1. Risk of fatal accidents on public roads in Finland, 1979–99.
However, the accident risk in winter is above average if the road is icy or snowy. Although risk estimates for different conditions are approximate in view of the limited exposure data, the risk of injury accidents in Finland has been estimated to be over nine times higher on snowy roads and 20 times higher on icy road surfaces than on dry and bare roads (Polvinen 1985, Malmivuo and Peltola 1997). In Norway, the relative injury risk on snowy or icy roads has been estimated to be 2.5 times higher than on a bare road surface (Elvik et al. 1997). It would therefore seem that accident risk in winter converges on specific situations, calling for special measures directed at these 'black periods'.
1.2.2 Driver behaviour in slippery road conditions
The main human errors leading to increased risk in winter are drivers’ poor ability to recognise slipperiness and to adapt their behaviour to adverse weather conditions. On slippery road surfaces only 14% of Finnish drivers estimate the road to be slippery, while more than half consider the friction normal (Heinijoki 1994). In terms of speed, average speeds on a slippery road surface are roughly 4 km/h lower than in good winter conditions (Saastamoinen 1993, Estlander 1995). The reduction is not sufficient to compensate for the effect of inclement weather (Edwards 1999) nor for the reduced friction (Roine 1993, Saastamoinen 1993, Várhelyi 1996, Malmivuo and Peltola 1997). Overall, headways are not substantially affected by winter conditions (Saastamoinen 1993).
Insufficient adaptation of driver behaviour can be expected for a number of reasons. Safe driving behaviour is said to result from a successful interaction of three components: the driver, the vehicle and the road environment (e.g. Häkkinen 1978). Inclement weather alters the road environment, for which the other two components should compensate. Despite the increased friction provided by winter tyres, driving is more demanding than in good road conditions and the driver is responsible for reacting adequately. This, however, is difficult for many reasons: First, drivers are not only safety oriented; they have several parallel goals while driving which may compete with, or even contradict, the safety goal which itself is abstract and distant (Häkkinen 1978). It could be argued that safety is a secondary consideration for every driver at least once in a while. Second, information indicating slipperiness is seldom sufficient. Third, inappropriate behaviour usually does not give immediate or sufficient feedback on the threat of low friction, which the driver detects too late. Finally, there is probably substantial variation in drivers’ abilities. It is the development of their cognitive models (Mikkonen and Keskinen 1980) which enables anticipation or proper reactions in risky situations. Even for a safety-motivated and skilful driver, it may be a demanding task to adjust the behaviour to prevent an increase in accident risk when the road becomes slippery. The decision-making task to adjust to prevailing road conditions is complex and passes through several phases. Applying the general description of ‘the human information processor’ by Wickens (1992) to driver tasks under poor road conditions, the first step is to create an opinion or hypothesis concerning the friction, based on the driver’s information acquisition and perception of the situation. This is followed by assessment of the impacts of the lowered friction level on the driver’s ability to control the movements of the vehicle, then a decision on necessary actions such as decreasing speed or increasing headway. To perceive slipperiness is difficult as such, as there may be minimal visual cues indicating the hazard. Furthermore, it has been shown (Edwards et al. 1965, Edwards 1968) that a human operator when revising a hypothesis (or adjusting odds) is generally conservative, not extracting as much information as necessary from each diagnostic observation of data. The concept of ‘anchoring’ (Einhorn and Hogart 1982) refers to difficulty by human operators in changing an initial hypothesis in line
with subsequent sources of evidence; rather the opinion (‘cognitive anchor’) shifts only slightly. These phenomena and known characteristics of human behaviour make it understandable why behavioural adaptation to slippery conditions is difficult for drivers. It is especially difficult when friction decreases unexpectedly during the trip, which can happen because of changes in temperature or sudden encounters with black ice spots on e.g. the coast or bridges.
1.3 Traffic sign information as a measure to prevent
accidents under poor road conditions
1.3.1 Fixed traffic signs
Traffic signs are classified in three main categories: danger warning signs, informative signs and regulatory signs (Vienna Convention 1968). The warning sign for slippery road has not traditionally been used in Finland to warn about slipperiness caused by winter weather. Instead, the pictogram has mainly been used (on fixed signs) to alert drivers to the slipperiness of new pavement, accompanied by the text 'during rain'. Warnings for slipperiness in winter have been provided by the mass media (radio, television and newspapers).
To maximise the effectiveness of warnings they should contain the following elements (Wolgater 1999): (1) inclusion of a signal word such as ‘Danger’, (2) description of the hazard, (3) warning of the consequences, and (4) directions or instructions.
The warning sign for slippery road conditions with a pictogram of a car on wavy lines meets elements 1–3 satisfactorily. First, the red triangle can be regarded as a substitute for the word ‘Danger’, because signs with this triangle are interpreted as warnings (Luoma and Rämä 2001). Second, the pictogram describes both the hazard and the consequences in a comprehensible way (Luoma and Rämä 2001). However, the sign provides the driver with no explicit instruction on how to react. Should the driver be mentally prepared for slippery conditions or should he or she perform a specific action? The most effective signs are regarded as regulatory – those which ‘are intended to inform road-users of special obligations, restrictions or prohibitions with which they must comply’ (Vienna Convention 1968). Mandatory speed limits are included in this category. In contrast to many other traffic signs, drivers are aware that exceeding the posted speed limit can be measured more easily than many other traffic violations (ignoring the slippery road condition sign, for example), that speed enforcement really exists, and that there might be some legal consequences if the speed limit is exceeded. Because of the high accident risk during winter, posted speed limits in Finland are lowered during the winter season. On most single-carriageway roads speed limits of 100 km/h are lowered to 80 km/h, and on motorways from 120 km/h to 100 km/h. The
lowered limits are normally in force from the beginning of November to the beginning of April.
1.3.2 Effects of fixed signs on driver behaviour
Studies investigating the effects of traffic signs on driver behaviour in real life have typically focused on two aspects: how drivers respond to the signs and how they perceive the information on them. Although a driver can respond to a sign in many ways, most responses, except for vehicle speed, are difficult to measure (Luoma 1991). In the case of speed limit signs, however, the speed effects are of primary interest.
A meta-analysis by Ranta and Kallberg (1996) showed that decreasing the speed limit on interurban roads by 20 km/h typically lowered the mean speed by 4–8 km/h. Peltola (2000) showed that a seasonal speed limit drop from 100 km/h to 80 km/h decreased the mean speed of cars by 5.2 km/h and of all vehicles by 3.8 km/h. The number of injury accidents was estimated to be reduced by 28% during the experiment. The speed effects of warning signs have typically been minimal, if any (e.g. Summala and Hietamäki 1984, Luoma 1991, 1992).
Any behavioural effects in terms of speed must be preceded by detection and identification of the sign. These phases have been investigated in the field with a wide range of experiments. However, according to Luoma (1991), all of the methods have been modifications or combinations of three basic ones: the registration of (1) eye movements, (2) recalls or (3) responses. Each method involves the description and explanation of a different characteristic of driver information acquisition, and each method has its own advantages and drawbacks.
In this context we focus on driver recall. If the sign is recalled correctly, very probably it has also been identified. However, some of the recalls can be guesses, especially in the case of frequently applied speed limits. Identification, on the other hand, does not invariably mean a correct recall. The validity of recall rates as a measure for identification may be weakened by other processes (Näätänen and Summala 1976, Crundall and Underwood 1997). However, recall is usually much easier to investigate than identification, therefore the recall rate is frequently used as a measure for one dimension of the efficiency of the sign. Furthermore, Luoma (1993) has shown that the recall of subjectively important speed limit signs is not affected by the delay in requesting the sign, provided that the time delay is 1 minute or less.
Although the recall rate of speed limits has usually been high compared with many other traffic signs, there is variation between studies, for example the speed limit in question and the questioning procedure. Peltola (2000) found a recall rate of 95% for the seasonally changing speed limit of 80 km/h. However, the correct recalls might include guesses because the general speed limit on interurban roads was also 80 km/h. Indeed, the recall rate of a 100 km/h speed limit was 75% in the same study (Peltola 2000). The
studies conducted in Finland and Sweden (Häkkinen 1965, Johansson and Rumar 1966, Johansson and Backlund 1970) have shown recall of the speed limit sign to be 69–80%. Warnings are used for many purposes such as elk, children, road works and slippery road conditions. The recall rate of warning signs varies depending on the sign and procedure (Luoma 1993). Earlier studies (Häkkinen 1965, Johansson and Rumar 1966, Johansson and Backlund 1970, Åberg 1981) have shown that 61–77% of drivers recalled a special police control sign, 46–67% a game (elk) crossing sign and 18–39% a general warning sign.
1.4 Potential of variable message signs
1.4.1 Application areas of variable message sign systems
VMSs are displays on the roadside which can (but do not invariably) show a range of traffic signs or other symbolic or textual messages. The colours of the signs on the displays can be traditional or inverted. Examples of sign technology used are fibre-optic, LED and electromechanical techniques. Usually the message alternatives are defined beforehand and the control system selects the most appropriate one.
The basic concept of VMS is not very recent (see e.g. Forbes 1972). However, modern systems frequently include automatic data collection, data communication and processing systems, and the control of signs is at least partially automated (for review see TROPIC 1996, McCabe et al. 1999). Furthermore, data collection systems may include automatic measurement stations such as road weather stations on the weather-controlled E18 road (Pilli-Sihvola 1994, Toivonen 1996). On the E18, every 5 minutes the central station collects, through a direct data line, information from the road weather stations for storage and analysis. The central unit of the road weather information system also analyses the road conditions and recommends speed limits based on the information. The recommended messages are transmitted to the traffic signs' control logistics equipment. All the signs have both data and electric wiring and are connected to the technical building with a standard industrial bus. The signs can also be controlled manually.
The systems including VMSs and variable speed limits are designed and built up for different purposes. The main use in Europe has been to improve control of traffic flow during congestion. More specifically, the VMS systems aim to harmonise traffic and to improve capacity during heavy traffic by variable speed limits (e.g. Smulders 1990, Buijn et al. 1994, van den Hoogen and Smulders 1994) and variable information signs (e.g. Filippi et al. 1989). Many systems have included information and guidance for alternative routes as well (e.g. Alppivuori et al. 1995, Giaever 1996, Yim and Ygnace 1996, Kraan et al. 1999), and some of them give information about traffic accidents (e.g. Filippi et al. 1989). Typically, drivers prefer this type of information provision
(Penttinen et al. 1997) and accept the VMS systems well (van den Hoogen and Smulders 1994, Kraan et al. 1999, Harjula et al. 1998). There is also evidence of a resulting decrease of accidents (Buijn et al. 1994), decrease of mean speed, and variance in speed, and increased homogeneity of traffic flow (van den Hoogen and Smulders 1994, Kraan et al. 1999).
In addition, there are VMSs for informing, warning or controlling traffic at special spots, like at intersections to make merging easier and near road works or schools to improve the traffic safety of schoolchildren (e.g. Amundsen 1988). Towliat (2001) found that a variable pedestrian warning sign (a pedestrian-crossing pictogram with an additional ‘stop for pedestrian’ panel) decreased the 85th percentile speeds by 5 to 6 km/h.
Weather-controlled VMS systems (Cooper and Sawyer 1993, Baltz and Zhu 1994, Hogema and van der Horst 1997) have mainly been built up to prevent accidents in fog but also to lower speeds in slippery road conditions like wet pavement. In most cases the variable speed limits have been used in combination with variable message warning signs.
1.4.2 Effects of weather-controlled variable message signs on driver behaviour
Most earlier studies concerning the effects of weather-controlled VMSs have dealt with systems warning about fog. The Dutch fog warning system included variable maximum speed limits and warning signs depending on the available visibility range (Hogema and van der Horst 1997). The results showed that the VMS system decreased the mean speed in fog by 8 to 10 km/h. The speed limit was lowered in fog from 100 km/h to 80 km/h or 60 km/h. In extremely dense fog, the proposed speed limit (60 km/h) seemed to be too high compared with speeds without the system, and the system had an adverse effect on speed. It is assumed that this happened because drivers tended to rely on the variable speed display. The standard deviation of speed decreased marginally. Other dependent variables, such as headway, changed only slightly.
Cooper and Sawyer (1993) assessed the automatic fog-warning system on the M25 motorway in England displaying the “Fog” legend on roadside matrix signals. The results showed that the net mean vehicle speed reduction was approximately 3 km/h when the signals were switched on. Baltz and Zhu (1994) found that a VMS system including speed limits and warnings for fog and aquaplaning decreased the number of accidents.
1.4.3 The Finnish approach to weather-controlled variable message signs
In the early 1990s in Finland, ITS applications were seen as one way to reduce the number of accidents occurring on slippery roads. The underlying logic of this approach was as follows: First, VMSs including real time and local warnings or information would
alert drivers to observe road conditions more carefully and provide information about dangerous conditions that are not easy detectable (Kosonen and Luoma 1994). Second, in spite of the promising results obtained with seasonally changing speed limits, traffic safety in winter could be improved by weather-controlled speed limits. This is because the weather and road conditions might be so poor that speed limits should be lowered by much more than 20 km/h. This concerns especially situations which are not easily detectable as dangerous by drivers, such as frost or black ice. Also, the fixed winter speed limits have been criticised as being inflexible, because there are frequently long periods in winter when the road conditions are as good as in summertime. Finally, it might also be justified to lower the summer speed limits during adverse road conditions, because of the danger of aquaplaning, for example, and especially in early spring and late autumn because of occasional flurries or black ice.
The Finnish Road Administration adopted a policy to develop ITS applications gradually during experiments, as problem driven and not as technology driven (Finnra 1998). As a first step, the Finnish Road Administration decided to carry out experiments concerning individual VMSs for slippery road conditions, and later a Finnish test site project on the E18, including the weather-controlled road, was introduced (Pilli-Sihvola 1994). It was also decided to evaluate the effectiveness of the implemented sign systems, which required several studies of the effects of the systems on driver behaviour.
1.5 Driver behaviour and sign information
1.5.1 The driver as an information processor
The phases of human information processing are described by Wickens (1992) in the general qualitative model presented in Figure 2. The model is a composite of previously presented models, as Wickens (1992) states, and it describes the critical stages in human performance. It is assumed that each stage of processing performs some transformation of data and demands some time for its operation. In the following, the model is used as a framework to describe driver information processing when encountering a VMS. In the case of visual stimuli like VMS, the visual sense and eyes are of primary importance. The properties of the VMS, like colours and how conspicuous the sign is, in combination with the characteristics of the eye, affect the quality and quantity of information that is initially registered, and potentially further processed. The information is preserved temporarily (normally for less than 1 s) in iconic memory (Neisser 1967). Unlike the following phases, this short-term store (STSS, Figure 2) does not demand any conscious attention resources. When the information is processed further it is assumed to make contact with a unique neural code in the brain which is learned and was stored earlier. The sign is perceived or recognised, and possibly identified and categorised.
Figure 2. General qualitative model of ‘the human information processor’ by Wickens (1992).
Most of the cognitive activities involve bottom-up and top-down processing in combination (Eysenck and Keane 1990). Bottom-up processing means stimuli-driven processing, whereas top-down processing means conceptually driven processing including expectations determined by context and past experience. Bottom-up and top-down processes are interactive (Neisser 1967). For example, in word perception, sentences must be processed to provide the higher-level context that in turn provides top-down processing for word recognition (Wickens 1992). Theeuwes and Hagenzieker (1993) studied top-down governed visual selection in natural traffic scenes and found that visual search in the unexpected condition was significantly more error prone than search in the expected condition. The importance of top-down processing is emphasised when the efficiency of VMS is considered. It is assumed that experiences and expectations, and understanding of control strategies, play an important role in the processing of VMS information and in possible actions. This means that a driver who is aware of the control strategies of the signs and has confidence in their functioning will more likely or more efficiently adapt his or her behaviour according to the message. After perception the driver must decide what to do.The distinction between automatic behaviour which is fast and effortless and controlled behaviour which is slow and attention demanding, is relevant to driving (Ranney 1994). It is obvious that much of routine driving is done automatically. Changes in motivation or uncertainty created by an unexpected event may change primarily automatic processing to controlled processing (Ranney 1994). Decisions concerning the messages on a VMS are sometimes assumed to be careful and thoughtful ones, but they may also be quite rapid ones. The
decision is followed by a possible response execution. Feedback of the response, such as a decrease of speed, is received through visual but also other senses. Typically, in car driving this type of feedback is frequently insufficient. Drivers get used to the speed, for example, and the decrease of speed feels subjectively greater than it objectively is. In addition, sensation of friction or ‘feeling the road with the car' (Gibson and Crooks 1938) on an icy surface is not an easy task. Consequently, it has been suggested that cars should be equipped with special devices providing friction values to the drivers (Peltola and Kulmala, 2000). Future ITS technologies under development, such as intelligent speed adaptation (ISA) or weather related intelligent speed adaptation (WISA), include special devices to monitor the circumstances and to control the movements of vehicles according to changing driving conditions (Várhelyi 1996, Peltola and Kulmala 2000). However, it may take some time before such ITS applications are available for widespread use.
According to Wickens’ model (Figure 2) much of the processing that occurs following iconic memory requires attention to function efficiently. If some processes require more of the resource pool, less is available for other processes, whose performance therefore will deteriorate. Given the visual characteristics of some VMS technologies, it is possible that the information processing caused by those VMSs temporarily interferes with other activities necessary for car driving, provided that the attention demanding phases (other or the same mode) are in use.
Although the model presented by Wickens (1992) appropriately describes the human operator when he or she is conducting a complex task or combination of tasks, there are some aspects to be added when considering driver behaviour. For example, the operator is assumed to be quite motivated and concentrated on the task at hand. In practice, however, driving a car in real life is not the primary task all the time and therefore the model does not cover all situations or aspects of driver behaviour when driving in adverse road conditions and encountering VMSs. The driver may, however, be more concentrated on the driving task because of the poor road.
More generally, current theories of cognitive psychology may be defective in describing or predicting the behaviour of the human operator in the context of the human machine interface. The reason for this lies in the history of cognitive psychology. This psychological approach was developed in close relationship with computational modelling. Eysenck and Keane (1990), for example, call it the marriage of these sciences. The behaviour of a human being was described and understood based on an analogy with computers. In this theory formation the “real human components” (that is, the qualitative properties which distinguish a human from machines) might have been at least partly assimilated out, and are poorly represented in the theories of cognitive psychology. These theories should, however, form the basis when trying to better describe and understand the “human component” in the human machine interface, for example in ITS applications.
1.5.2 Potential to influence drivers’ risk perception by real time sign information
In the following, the weather-controlled VMS as a safety measure is discussed in relation to some relevant theories of driver behaviour, that is, theories considering especially risk perception and experience of risk.
According to the Risk Homeostasis Theory (Wilde 1994), road users as a population have a target level of risk, that is an accepted or tolerated level of risk which is maintained over time. When a traffic safety measure is applied, people alter their behaviour so that for a relatively long time period the risk of the way they behave will not change. This is the case unless the measures are capable of motivating people to alter the amount of risk they are willing to incur. The Risk Homeostasis Theory assumes that ‘perceptual skills’ define ‘perceived risk’ which is then compared with ‘target level of risk’. In this context, the weather-controlled VMSs are designed to support perception of risk, that is to enhance ‘perceptual skills’ when the circumstances change so that drivers’ ability to make reliable perceptions is temporarily deteriorated.
As Wilde states (1994), the risk homeostasis mechanism is expected to come true concerning all road users, the whole population in a given area, and for a reasonable long time period (for example a year), that is on the system level. However, the use of VMSs has until now been quite limited both locally and temporarily. Thus, it is likely that the possible compensation of safety benefits would not be very effective for this kind of measure. Theoretically, one could expect the risk homeostasis to occur when VMSs are applied on a larger scale, and the effects are evident in accident statistics. Drivers could then make the conclusion that it is not that dangerous to drive in winter conditions and reduce their reactions to the VMSs or even to adverse weather and road conditions. However, it is unlikely that drivers are constantly monitoring the risk in traffic. In fact, as McKenna (1982, 1985) states, it would presuppose that people are able to monitor the probabilities of very infrequent events. It is more likely that people are monitoring their own interaction with the road and traffic system (McKenna 1985). One dimension of the events in this interaction is the level of danger of situations, but there are many other dimensions too, like the fluency of traffic, comfort, different kinds of emotions etc. In this context, the purpose of the weather-controlled VMS is to focus drivers' attention on the monitoring of risk.
In addition, weather-controlled VMSs may have long lasting effects like increasing drivers’ consciousness of dangerous situations and motivating them to avoid risky behaviour. According to the zero-risk theory (Näätänen and Summala 1976) this is not very probable, the effects being only temporary and local. The zero-risk theory assumes that drivers do not experience any risk at all most of the time, meaning that the subjective risk is zero. However, the mean speed decreases in adverse road conditions, indicating that the subjective risk is probably not zero at least in these circumstances
(Häkkinen and Luoma 1991). Another question (not discussed here) is to what extent the drivers are aware of the consequences of an accident whether economical, physical or mental.
The relationship of subjective and objective risk is not simple or linear. The subjective risk depends partly on the objective risk. Drivers then have the possibility to compensate for the danger or reduce the accident risk at least to some degree, by modifying their own behaviour. One could regard the most risky situations to be those in which the objective risk is increased substantially with no or only a slight increase in subjective risk. Or, to use the terminology of Fullers’ threat avoidance theory (1984), when the driver regards the likelihood of some potential aversive stimulus or threat to be very low, in which case the avoidance response is delayed. Examples of such situations are a cyclist on whom the driver does not focus his or her attention, or undetected slipperiness of the road surface.
1.6 Purpose of the study
The principal aim of this study was to investigate the effects of local and frequently updated information about adverse weather and road conditions on driver behaviour. The information was transmitted by several VMS types including slippery road condition signs, minimum headway signs, temperature displays and speed limits. Two evaluations investigated the effects of VMS systems involving an individual sign or two signs, and two other evaluations focused on more extensive VMS systems involving several signs. In addition, effects of the sign technology were also studied in two evaluations because of the exceptional outlook of weather-controlled VMSs. However, these two evaluations provided only indirect information for the weather-controlled VMS system. The data for each study was collected in field conditions.
Traffic safety is a central concept in the driver behaviour theories discussed above. A surrogate measure, driving speed is used to measure safety effects indirectly. A second criterion, not provided with as good safety-increasing evidence, is the proportion of short headways. The theoretical introduction emphasised the sign category, the duration of the effects, and the potential to affect driver behaviour with the effective signs, taking into consideration the restricted resource pool in human information processing. The main hypotheses of the studies are listed as follows:
1. The variable slippery road condition sign and minimum headway sign decreases driving speed and the proportion of short headways, in contrast to a general pattern of non-evident effects of fixed warning and information signs.
2. The safety effects of variable speed limits included in a VMS system are greater compared to the effects of individual VMSs providing warnings or information. 3. The effects of VMS warnings are of short duration.
4. A VMS using fibre-optic technology is more effective than conventional-looking signs in terms of recall rate and speed behaviour, but at the same time may be more disturbing.
5. A VMS showing no message does not have harmful effects on driver behaviour in terms of traffic safety.
In the following, the findings are presented in integrated form in three sections. First, the effects of individual VMSs for slippery road conditions are examined (Studies I and II). This is followed by studies of the effects of the extensive weather-controlled speed limit and warning system (Studies III and IV). Third, the effects of the sign technology on speed behaviour and recall of signs are discussed (Studies V and VI). The overall findings are discussed and recommendations made.
2. Effects of variable message signs for
slippery road conditions (Studies I and II)
Studies I and II concerned the VMS for slippery road conditions. Study I focused on the effectiveness in terms of speed and headways, while Study II aimed to cover other potential effects of these signs.
2.1 Method
2.1.1 Study I
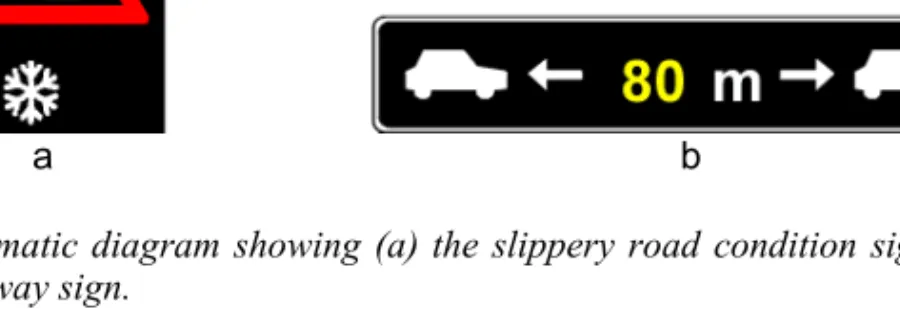
Two VMSs were evaluated: (a) a slippery road condition sign and (b) a sign recommending the minimum headway between vehicles (Figure 3).
a b
Figure 3. Schematic diagram showing (a) the slippery road condition sign and (b) the minimum headway sign.
Operators at the TMC manually controlled the signs. For that purpose the TMC operators classified the road surface conditions in three categories based on data from road weather stations. The categories were (a) good, (b) possibly slippery and (c) verified slippery. The slippery road condition sign was off, in steady mode or in flashing mode, respectively. The minimum headway sign was always on and the recommended headway depended on vehicle length, driving speed and road surface condition. During the second winter of the study, the word “SUOSITUS” (i.e. ‘recommendation’) was added below the headway pictogram to improve the comprehensibility of the sign. There were three sites (Site 1, Site 2 and Site 3) in Southwest Finland. The posted speed limit at each site was 80 km/h. The after period covered two winter periods.
Driving speeds and headways were measured with loop detector based traffic monitoring stations (TS) before drivers could see the signs (TS1), and after the signs (TS2) 360– 1,100 m downstream. The traffic monitoring stations, especially TS2, were in places
where the road curved slightly. In addition, a third measurement point (TS3, not at Site 3) was used further (7,670–13,000 m) downstream.
In the analysis, driver behaviour at TS2 was compared with the behaviour at TS1 both before and after the implementation of the signs. The data were classified based on weather and road condition and use of the signs. The data on driver behaviour in the opposite direction was used to control possible local differences in weather and road surface conditions.
2.1.2 Study II
The signs and controlling practices were identical to those used in Study I, except for minor differences in the supplemental panels. The data were collected from a combination of roadside and telephone interviews. Two roadside interviews sampled drivers who encountered either the slippery road condition sign or the minimum headway sign during adverse road surface conditions. If a driver recalled and comprehended the sign in question, he or she was asked to participate in a telephone interview in the near future.
In the telephone interviews, spontaneous reporting of the effects of VMS on behaviour were sought first. Next, other potential effects were asked about following a checklist, the main effects (e.g. speed behaviour) being discussed in greater detail (e.g. speed in curves).
In the case of the slippery road condition sign, which drivers had encountered during snowfall, the interview continued with a request to consider road conditions in which the level of adversity would not be as detectable as at the moment of the roadside interview. This question was followed by the same procedure as in the case of prevailing road conditions.
2.2 Results
2.2.1 Effects on speed
The main results showed that the slippery road condition sign (at Site 1 in combination with the minimum headway sign) decreased the mean speed of cars travelling in free-flow traffic (with a minimum headway of 5 s between the actual vehicle and the vehicle ahead) at Site 1 and Site 2 on average by 1.2 km/h (p < 0.05) with the steady display (I). When the sign was flashing (Table 1), the decrease at Sites 1 and 2 was on average 2.1 km/h (p < 0.05). At Site 3 the system had the opposite effect, the average speed increasing by 1.1 km/h (p < 0.05, Table 1). These effects were found in addition to the effect of adverse weather and road conditions.
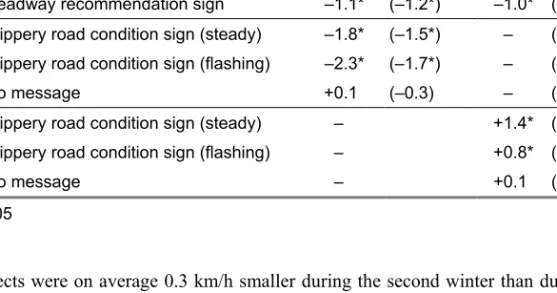
Table 1. Effects of variable road condition signs on mean speed for cars travelling in free-flow traffic, and in parentheses for total traffic flow (n varied between 603 and 32 361).
Site VMS Speed effect (km/h) TS2-TS1
1st winter 2nd winter 1 Slippery road condition sign (steady) and
headway recommendation sign –0.9* (–0.5*) –0.8* (–0.1*) Slippery road condition sign (flashing)
and headway recommendation sign –2.2* (–2.2*) –1.9* (–1.8*) Headway recommendation sign –1.1* (–1.2*) –1.0* (–1.1*) 2 Slippery road condition sign (steady) –1.8* (–1.5*) – (–0.6*) Slippery road condition sign (flashing) –2.3* (–1.7*) – (–1.3*)
No message +0.1 (–0.3) – (–0.2)
3 Slippery road condition sign (steady) – +1.4* (+1.2*)
Slippery road condition sign (flashing) – +0.8* (+0.5*)
No message – +0.1 (+0.1)
* p < 0.05
The effects were on average 0.3 km/h smaller during the second winter than during the first. When no message was shown, the signs had no significant effect on the mean speed (Table 1). The signs did not have any substantial effect on the standard deviation of speed.
The results showed that the effect tended to be more substantial at night. The flashing slippery road condition sign decreased the mean speed by 2 km/h on average at the third monitoring station further downstream (TS3).
2.2.2 Effects on headways
Investigation of the headway distributions showed that at Site 1, with the additional minimum headway sign (I), the proportion of short headways was decreased significantly (p < 0.05, Table 2). The minimum headway sign seemed even to shift the whole headway distribution. At Site 1, during adverse weather and road conditions the mode of distribution was between 2 and 3 s during the after studies with the VMS on, compared with 1.5 and 2 s during the before studies.
At site 2, the slippery road condition sign alone did not influence headways in a substantial manner. However, at Site 3 there was a slight significant decrease in the proportion of headways shorter than 1.5 s (p < 0.05).
Table 2. Changes in the percentual shares of headways shorter than 1.5 s out of all headways of 5 s or less. Only statistically significant (p < 0.05) effects are shown.
Site / Road condition Winter 1 (%) Winter 2 (%)
Site 1 / good condition –38 –28
Site 1 / possibly slippery –47 –37
Site 1 / verified slippery –37 –31
Site 3 / possibly slippery – –12
During the second winter, the effects were roughly one third smaller. Additional analysis showed that the reduction of the effect was substantial after the word ‘recommendation’ was added to the sign.
2.2.3 Effects of the slippery road condition sign on reported behaviour
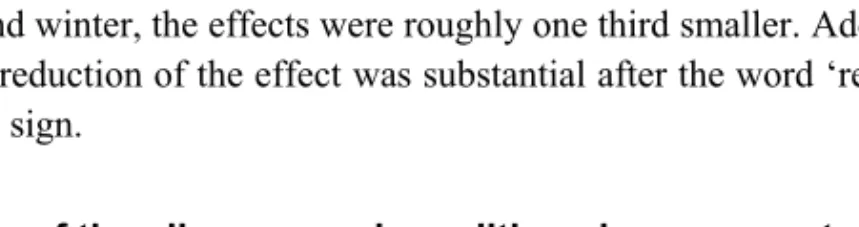
Eleven percent of the 114 interviewed drivers indicated that the sign had no effect on their behaviour (II). The corresponding proportion in ‘black ice’ conditions was 1%. Other drivers usually indicated several effects (Figure 4).
In both road conditions, drivers reported that the slippery road condition sign influenced driving speed in particular. Specified effects included reduction of the driving speed in general, and in curves in particular.
Another frequently reported effect was a change in the focus of attention. Specified effects included more frequent monitoring of oncoming vehicles than usual, concentrating more on one’s own driving, and monitoring the road surface or vehicles travelling ahead.
Testing of the road slipperiness was emphasised especially in black ice conditions. In addition, drivers frequently reported the following responses: improved driving comfort (e.g. through knowing that all drivers were informed about the slipperiness of the road), increased following distance, refraining from overtaking (completely, more cautiously or more infrequently) and different use of car controls (steering, brake pedal or accelerator pedal).
None of the drivers indicated that he or she would have changed travel mode or interrupted the trip because of the slippery road condition sign.
Figure 4. Reported effects of the slippery road condition sign by weather and road conditions.
2.2.4 Effects of the minimum headway sign on reported behaviour
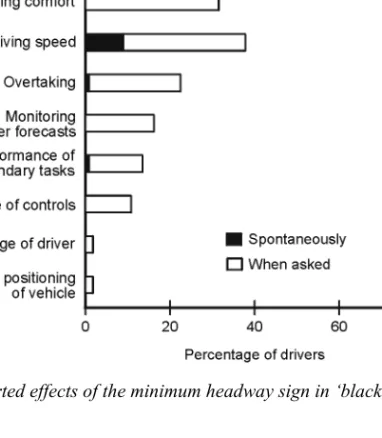
Two percent of the 111 interviewed drivers indicated that the sign had no effect on their behaviour (II). Other drivers indicated the effects shown in Figure 5.
The drivers indicated that the minimum headway sign influenced their following distance in particular (monitoring or increasing the distance). In addition, the following effects were reported relatively frequently: altered focus of attention (monitoring the vehicle ahead and focusing on one’s own driving), discussion of the meaning of the message, the appropriateness of the message or VMSs in general, driving speed (checking actual speed and general speed reduction) and testing the road slipperiness by braking.
Figure 5. Reported effects of the minimum headway sign in ‘black ice’ conditions. 2.2.5 Correlation of the reported effects
In an additional analysis the reported effects on driving speed, following distance and testing of slipperiness were cross-tabulated with other reported effects (II). The results showed that the effects of the slippery road condition sign on speed and the following distance correlated positively with each other: if a driver indicated that the sign influenced driving speed, then he or she more frequently reported that the sign influenced the following distance. The relationship of these variables with the testing of slipperiness was not so evident. Secondly, if a driver indicated that the sign influenced driving speed, following distance or testing of slipperiness, then he or she more frequently reported other effects. The results showed rather similar trends for the minimum headway sign. However, the relationships were not as strong as those of the slippery road condition sign.
3. Effect of weather-controlled sign system
(Studies III and IV)
In Study III the effects of variable weather-controlled speed limits and warning signs on driver behaviour were investigated. Study IV examined driver acceptance of this system.
3.1 Method
3.1.1 Description of the system
The site of the experiment was located on Finland’s southern coast on interurban motorway E18. The experimental motorway was a new 14 km long section, and all speed limit signs on the section were variable fibre-optic signs. In addition, there were five information displays consisting of two sign modules (a fibre-optic warning sign and a text information LED sign). These VMSs provided e.g. warnings regarding slipperiness and information about air and road temperatures.
Speed limits were automatically controlled based on data from two road weather stations. The road and weather condition was classified in three categories as good, moderate, or poor. The automatic classification was based on several factors: The most important included rain or snowfall, rain intensity, road surface conditions, visibility, and wind velocity. If necessary, manual control was used by the TMC operators in co-operation with winter maintenance personnel (Pilli-Sihvola 1994, Toivonen 1996). The speed limits were lowered in winter from 100 km/h to 80 km/h (20% of total time) during adverse road conditions. During the summer season, speed limits were lowered from 120 km/h to 100 km/h (20% of total time) or to 80 km/h (3% of total time). If the variable speed limit system had not been used, the fixed speed limit on the road would have been 100 km/h in winter and 120 km/h in summer.
3.1.2 Design and data collection
The speed analyses were based on comparisons of the speed distribution in different road and weather conditions on the experimental road and the control road. The control road was used to estimate effects of road and weather conditions on speed. The speed limits, shown by fixed signs on the control road, were 120 km/h in summer and 100 km/h in winter.
The effects were computed by subtracting the effects of adverse conditions, determined by the data from the control road, from the effects found from the experimental road. In the reference situation the road conditions were good, the speed limit was 100 km/h in winter and 120 km/h in summer, and there was no significant information on the display.
The data from the experimental and control road were matched by weather classification, day of the week and time of day.
Speed and headway data were obtained from loop detectors. There were three automatic traffic data collection stations on the experimental motorway and one station on the control road. In addition, there was a loop on the single-carriageway road section next to the experimental road section for assessment of the effects of the VMSs at further distance. Road and weather conditions at the loop locations were estimated by the data from automatic road weather stations. Data collection began in March 1995, after 4 months’ use of the system during the first winter.
Drivers were randomly picked from the traffic flow and pointed to a rest area for the survey. The closest VMS was located about 400 m and the closest variable speed limit sign about 2.5 km before the survey site. Drivers were interviewed in January, February, September and December. The first interview took place 3 months after opening the road. The final sample consisted of 590 drivers.
The reliability of operation of the weather-controlled system was assessed by collecting manual observations of weather and road conditions and carrying out friction measurements. In total, 139 situations were analysed. Most of the manual observations were made when weather and road conditions were turning worse.
3.2 Results
3.2.1 Speed effects
In winter, the mean effect of lowering the speed limit from 100 to 80 km/h was 3.4 km/h (p < 0.001) for cars travelling in free flow-traffic (Table 3). In dry weather but adverse road conditions (like black ice) the decreasing effect was about 2 km/h greater, i.e. 5.3 km/h (p < 0.001). The effect of adverse road conditions was smaller (on the control road) in situations not easily detectable by drivers as adverse.
Use of the variable 80 km/h speed limit also decreased the standard deviation of speed compared with the control road, where the speed distribution tended to spread during adverse road conditions.
Table 3. Speed effects of reduced speed limits and adverse road conditions on the experimental road, of adverse road conditions on the control road, and of the VMS in wintertime.
Experimental road Control road Effect Speed parameter
km/h km/h km/h
Mean / free flow –9.7 –6.3 –3.4
Mean / free flow / no rain –9.5 –4.2 –5.3
Mean/total –8.8 –6.3 –2.5
Standard deviation –0.8 +2.3 –3.4
85th percentile –8.2 –3.5 –4.7
15th percentile –6.7 –8.2 +1.5
Clarification of symbols: variable speed limit fixed speed limit
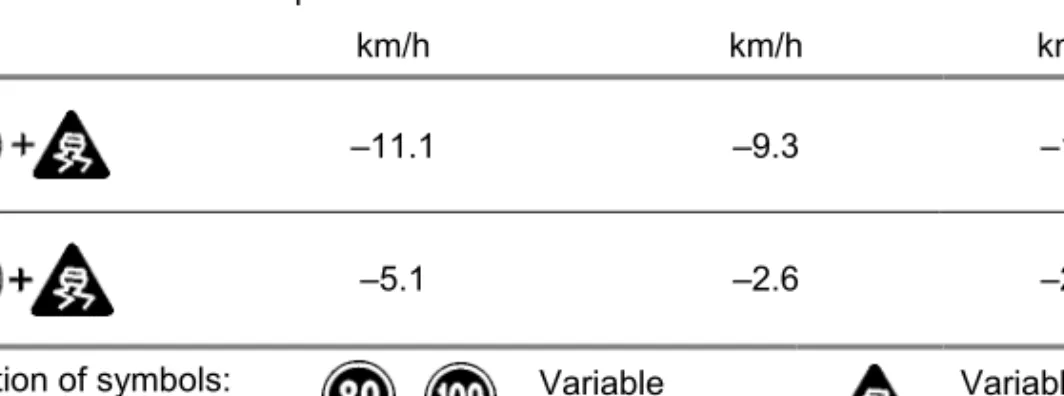
When the slippery road condition sign was displayed in addition to the decreased speed limit because of snow or ice, the speed reduction caused by the VMSs was smaller, being on average 1.7 km/h (p < 0.001). However, under these severe conditions, the effect of poor weather was substantial on the control road, i.e. 9.3 km/h (Table 4). In some cases, the speed limit was not reduced but the slippery road sign was displayed, for example, when the right lane was in good condition but the left lane was slippery. The mean effect of the sign for slippery road was then 2.5 km/h. However, examination of the results based on the driving direction showed that the effects were more substantial and significant (p < 0.001) for westbound traffic only.
Table 4. Mean speed effects of slippery road condition sign combined with speed limits of 80 km/h and 100 km/h and effect of adverse road conditions on the experimental road, of adverse road conditions on the control road, and of the VMS in wintertime.
VMS Experimental road Control road Effect
km/h km/h km/h –11.1 –9.3 –1.7 –5.1 –2.6 –2.5 Clarification of symbols: Variable
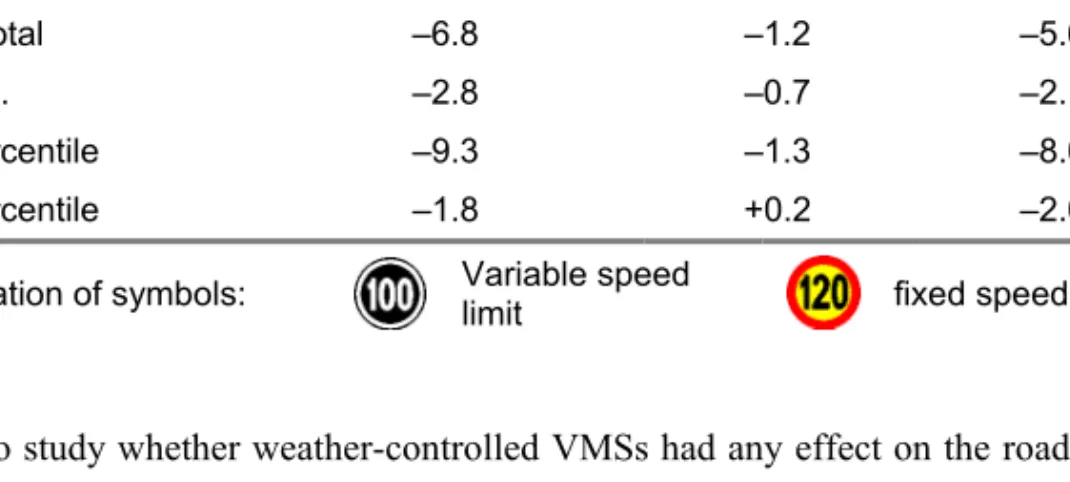
In the summer season, changing the variable speed limit from 120 km/h to 100 km/h decreased the mean speed on average by 5.1 km/h (p < 0.001), in addition to the effect of poor weather. The estimated effect of poor weather on the mean speed was less than in winter, i.e. 2.0 km/h (Table 5). The highest speeds were affected most by the 100 km/h speed limit, and consequently the standard deviation of the speed was reduced by 2.1 km/h.
Table 5. Speed effects of reduced speed limits and adverse road conditions on the experimental road, of adverse road conditions on the control road, and of the VMS in the summer season.
Experimental road Control road Effect Speed parameter
Km/h km/h km/h
Mean /free flow –7.2 –2.0 –5.1
Mean/total –6.8 –1.2 –5.6
Std.dev. –2.8 –0.7 –2.1
85th percentile –9.3 –1.3 –8.0
15th percentile –1.8 +0.2 –2.0
Clarification of symbols: Variable speedlimit fixed speed limit
In order to study whether weather-controlled VMSs had any effect on the road network nearby, speeds on the two-lane road section next to the experimental weather-controlled road were analysed. The control direction (towards the experimental road) was used to estimate the effects of adverse road and weather conditions. In winter, the mean speed effect for all vehicles on the following road section was a decrease of 0.8 km/h to 1.0 km/h (p < 0.001) in the various conditions.
3.2.2 Assessment of the system reliability
In 70%of cases the speed limit and use of the sign for slippery road were estimated to be in agreement with the control strategy and circumstances. In 26% of cases, however, the speed limit was assessed to be too high or the sign for slippery road was not displayed when it should have been. In contrast, actual speed limits were seldom too low compared with the control strategies adopted.
3.2.3 Recall and acceptance of the variable message signs
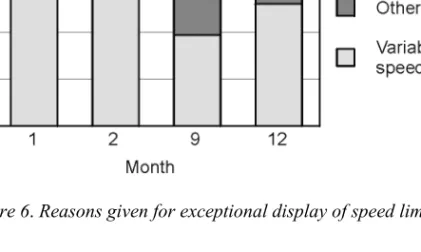
Ninety-one percent of drivers recalled the posted speed limit. When asked what they assumed to be the reason for the exceptional display of the limit (i.e. lit numbers on a dark background), the most frequent answer was that the sign was variable (Figure 6).
However, the answers differed by month (p < 0.001). Specifically, the proportions of ‘Don’t know’ and ‘Other reason’ answers were relatively high in September and December.
Figure 6. Reasons given for exceptional display of speed limits.
Drivers were asked whether they knew the controlling factors for variable speed limits.
On average, 93% reported weather and road conditions as controlling factors. However, there were differences between months (p < 0.01), indicating that especially in September there were many drivers (11%) who did not know the system.
On average, 81% of drivers indicated that the prevailing speed limit was appropriate.
However, the appropriateness was affected by the prevailing speed limit (Figure 7) (p < 0.05). More specifically, the proportion of drivers who favoured the prevailing limit was roughly the same for each speed limit, but the proportion of drivers favouring higher limits was higher when the limit was lower, and vice versa.
Figure 7. Appropriateness of the speed limit, by limit.
Ninety-five percent of drivers indicated that speed limits that vary according to prevailing road conditions are useful. The most frequent benefits mentioned were road safety (55% of drivers) and enhanced flow of traffic (30% of drivers).
Recall of the last road sign drivers remembered having passed was requested in two different situations: when the last sign was (1) a slippery road condition sign (only in February) or (2) a temperature display. The signs were recalled by 66% and 34% of drivers, respectively. A statistically significant decrease from 40% (January) to 23% (December) in recall of the temperature sign was observed during the experiment (p < 0.05).
4.
Effect and side effects of fibre-optic
signs (Studies V and VI)
The effectiveness of the fibre-optic speed limit sign compared to the electromechanical sign and fixed sign was investigated in Studies V and VI, as well as potential distraction caused by the fibre-optic speed limit sign in Study VI. Both studies measured the effects in terms of speed behaviour and recall of the sign at the same site.
4.1 Method
The experimental site was located in southern Finland on a single carriageway road with a fixed speed limit of 80 km/h. A variable speed limit sign was erected before an intersection to facilitate the flow of joining traffic from the secondary road.
The signs tested in Study V were a variable speed limit sign of fibre-optic technology and a variable electromechanical speed limit sign (Figure 8). The signs of Study VI included a variable speed limit sign of fibre-optic technology and a fixed speed limit sign, and a fixed general warning sign with a supplemental sign displaying “traffic investigation”.
A1 A2
B1 B2 B3
Figure 8. Diagram of signs tested in Studies V (A) and VI. (B): fibre-optic speed limit sign (A1 and B1), electromechanical speed limit sign (A2), fixed speed limit sign (B2) and general warning sign with supplemental sign (B3).
The type of variable speed limit sign (V and VI) and the location of the fixed warning sign (VI) were systematically varied. In Study V, a driver encountered either the fibre-optic or electromechanical speed limit sign. In Study VI, a driver encountered either the fibre-optic or fixed speed limit sign preceded or followed by a fixed warning sign. In both studies the speed data were collected by two pairs of detector loops, the first pair placed 1,285 m before the signs and the second pair 220–241 m beyond them.
Drivers were randomly picked from the traffic flow and pointed to a rest area for the survey. In Study V the speed limit sign at the intersection was requested first. In Study VI the driver was first asked, “What was the last warning sign you passed?” If the driver recalled the sign correctly, the text of the supplementalsign was requested. Next, the speed limit at the intersection was requested.
The data was collected on Tuesday through Thursday, between 09:00 and 15:00. The stimulus condition was always changed after 1 hour to match the lighting and traffic conditions. The data collection was conducted in good weather and road surface conditions. The fibre-optic speed limit sign was in use throughout the year between Studies V and VI.
4.2 Results
4.2.1 Driver behaviour
The main speed analysis concerning cars and vans focused on the mean speed before and after the speed limit sign. Only vehicles travelling in free-flow traffic situations (with a minimum headway of 5 s between the actual vehicle and the vehicle ahead) were included in this analysis.
The results of both studies showed that there were no statistically significant speed differences by type of sign before the speed limit sign (Figure 9). After the sign, the mean speed was 66.3 km/h for the fibre-optic sign, and 70.4 km/h for the electromechanical sign (p < 0.001) in Study V. The corresponding speeds were 69.8 km/h for the fibre-optic sign and 71.7 km/h for the fixed speed limit sign in Study VI (p < 0.01).
Figure 9. Mean speed of the vehicles travelling in free-flow situations before and after the sign in studies V and VI.
Two additional analyses were conducted in Study V. First, a sample of identified vehicles was analysed. Comparison of matched samples made it possible to calculate the exact speed reductions. These speed reductions were 21.3 km/h for the fibre-optic sign and 17.5 km/h for the electromechanical sign (p < 0.001). Finally, the results showed that vehicles travelling in free-flow traffic situations exceeded the speed of 65 km/h more frequently when the electromechanical sign was applied (65.5%) than when the fibre-optic sign was applied (47.0%, p < 0.01).
In Study V, there were no statistically significant differences by type of sign between the proportions of short headways (less than 1.0 s) before and after the sign.
4.2.2 Recall of signs
The interviews involved 307 drivers in Study V and 950 drivers in Study VI. In Study V 91.0% of drivers recalled the sign when the fibre-optic sign was used, but only 71.6% of drivers recalled the sign when the electromechanical sign was used (p < 0.001). One year later the recall rate of the fibre-optic sign was 82.5% and the recall rate of the fixed speed limit sign was 67.2% (p < 0.001) (VI).
In Study VI, recall of the warning sign was categorised as correct if the warning sign or the supplemental sign was recalled correctly. On average, 8.3% of drivers who had passed the fixed speed limit sign recalled the warning sign, while 4.2% of drivers recalled the warning sign when the fibre-optic variable speed limit sign was used (p < 0.01). The effect of the location of the warning sign was not significant for either sign or the total data.
5. Discussion
The main purpose of the study was to investigate the effects of local and frequently updated VMS information about adverse weather and road conditions on driver behaviour. Driver behaviour was measured in terms of speed, headways, reported behaviour, recall of signs, as well as understanding and acceptance of the weather-controlled system. The investigation included six individual studies grouped in three sections: the first two studies investigated the effects of individual VMSs for slippery road conditions, followed by two studies evaluating the effects of the variable speed limit and warning sign system, and two studies examining the effects and side effects of
fibre-optic speed limit signs.
The VMSs were implemented to improve traffic safety, particularly in difficult weather and road conditions typically leading to high accident risk. However, this study evaluated the safety benefits in terms of driver behaviour, not in terms of accidents. The five research hypotheses in the study were: (1) Weather-controlled VMSs providing warnings or recommendations decrease driving speed and the proportion of short headways in contrast to a general pattern of non-evident effects of fixed warning and information signs; (2) the safety effects of variable speed limits included in a VMS system are greater compared to the effects of individual VMSs used in the study; (3) the effects of VMSs providing warnings are short lasting; (4) VMSs using fibre-optic technology are more effective than conventional-looking signs in terms of recall rate and speed behaviour but, at the same time, they may be more disturbing; and (5) VMSs showing no message do not have harmful effects on driver behaviour in terms of traffic safety.
5.1 Speed effects of variable message signs
The most important dependent variable of this study was the mean speed of cars in free-flow traffic. In addition, the standard deviation of speed was investigated as an indicator of the homogeneity of speed behaviour, as a decrease of the standard deviation would indicate an improvement in traffic safety (Solomon 1964, Baruya 1998). On the other hand, if the VMS had been comprehended or obeyed by some driver groups only, this could have led to increased heterogeneity. In the following, the speed effects are discussed mainly in the order of the above given hypotheses.
The slippery road condition sign and the minimum headway sign improved traffic safety by decreasing the mean speed. Specifically, the slippery road condition sign decreased the mean speed by 1–2 km/h at a distance of 500–1,100 m after the signs (I). Earlier research has not shown similar effects for fixed warning or information signs. The effects have been smaller, if any, and they have been measured near the signs (Häkkinen