UDC 55
In print: ISSN 0352–1206
CODEN – GEOME 2
On line: ISSN 1857–8586
GEOLOGICA MACEDONICA
Geologica Macedonica
Geologica Macedonica
Vol.
Год
.
29
No
Број
1
pp.
стр
.
1–100
Štip
Штип
2015
Geologica Macedonica
Год
.
29
Број
1
стр
.
1–100
Штип
2015
GEOLOGICA MACEDONICA
Published by: –
Издава
:
The "Goce Del
č
ev" University, Faculty of Natural and Technical Sciences, Štip, Republic of Macedonia
Универзитет
„
Гоце
Делчев
“,
Факултет
за
природни
и
технички
науки
,
Штип
,
Република
Македонија
EDITORIAL BOARD
Todor Serafimovski
(R. Macedonia, Editor in Chief),
Prof. Blažo Boev
(R. Macedonia, Editor),
David Alderton (UK), Tadej Dolenec (R. Slovenia), Ivan Zagorchev (R. Bulgaria), Wolfgang Todt (Germany),
acad. Nikolay S. Bortnikov (Russia), Clark Burchfiel (USA), Thierry Augé (France), Todor Delipetrov (R. Macedonia),
Vlado Bermanec (Croatia), Milorad Jovanovski (R. Macedonia), Spomenko Mihajlovi
ć
(Serbia),
Dragan Milovanovi
ć
(Serbia), Dejan Prelevi
ć
(Germany), Albrecht von Quadt (Switzerland)
УРЕДУВАЧКИ
ОДБОР
Тодор
Серафимовски (
Р
.
Македонија
,
главен
уредник
), Блажо
Боев (
Р
.
Македонија
,
уредник
),
Дејвид
Олдертон
(
В
.
Британија
),
Тадеј
Доленец
(
Р
.
Словенија
),
Иван
Загорчев
(
Р
.
Бугарија
),
Волфганг
Тод
(
Германија
),
акад
.
Николај
С
.
Бортников
(
Русија
),
Кларк
Барчфил
(
САД
),
Тиери
Оже
(
Франција
),
Тодор
Делипетров
(
Р
.
Македонија
),
Владо
Берманец
(
Хрватска
),
Милорад
Јовановски
(
Р
.
Македонија
),
Споменко
Михајловиќ
(
Србија
),
Драган
Миловановиќ
(
Србија
),
Дејан
Прелевиќ
(
Германија
),
Албрехт
фон
Квад
(
Швајцарија
)
Language
editor
Лектура
Marijana Kroteva
Маријана
Кротева
(English) (
англиски
)
Georgi Georgievski, PhD.
д
-
р
Георги
Георгиевски
(Macedonian) (
македонски
)
Technical
editor
Технички
уредник
Blagoja Bogatinoski
Благоја
Богатиноски
Proof-reader
Коректор
Alena Georgievska
Алена
Георгиевска
Address
Адреса
GEOLOGICA MACEDONICA
GEOLOGICA MACEDONICA
EDITORIAL
BOARD
РЕДАКЦИЈА
Faculty of Natural and Technical Sciences
Факултет
за
природни
и
технички
науки
P. O. Box 96
пошт
.
фах
96
MK-2000 Štip, Republic of Macedonia
МК
-2000
Штип
,
Република
Македонија
Tel. ++ 389 032 550 575
Тел
. 032 550 575
E-mail: todor.serafimovski@ugd.edu.mk
400
copies
Тираж
: 400
Published twice yearly
Излегува
двапати
годишно
Printed
by:
Печати
:
2
riAvgust – Štip
2
риАвгуст
–
Штип
Price:
500
den
Цена
: 500
ден
.
Geologica Macedonica
Geologica Macedonica
Vol.
Год
.
29
No
Број
1
pp.
стр
.
1–100
Štip
Штип
2015
TABLE OF CONTENTS
285. Tena Šijakova-Ivanova, Vesna Ambarkova
Geochemical assessment of some natural waters from eastern and south-eastern Macedonia ... 5–14
286. Vojo Mir
č
ovski, Blažo Boev, Zlatko Efremoski,
Ajka Šorša,
Ðor
đ
i Dimov
Hydrochemical data for the ground waters in the Bitola’s part of the Pelagonia valley,
Republic of Macedonia ... 15–24
287. Dafinka Dimitrova, Ivan Boev, Vesna Zajkova Panova
Heavy and toxic metals in water and sediments of the river of Vardar in Skopje ... 25–46
288. Orce Spasovski, Daniel Spasovski
Possibilities for using travertine from the Nabigori deposit village of Velmej
(western Macedonia) as architectural stone ... 47–52
289. Biljana Balabanova, Traj
č
e Stafilov, Robert Šajn, Claudiu T
ă
n
ă
selia
Lead distribution in soil due to lithogenic and anthropogenic factors
in the Bregalnica river basin... 53–61
290. Igor Ivanovski, Dalibor Serafimovski, Goran Tasev, Todor Serafimovski
3D modelling of the Plavica Au-Cu polymetallic deposit, Republic of Macedonia ... 63–74
291. Igor Peševski , Milorad Jovanovski, Jovan Br. Papi
ć
, Biljana Abolmasov
Model for GIS landslide database establishment and operation in Republic of Macedonia ... 75–86
292. Arianit A. Reka, Blagoj Pavlovski, Todor Anovski, Slobodan Bogoevski,
Boško Boškovski
Phase transformations of amorphous SiO2 in diatomite at temperature range
of 1000–1200°C ...
87–92
293. Vladimir Manevski, Todor Delipetrov, Marjan Delipetrev
Geoelectrical measurements in environment with presence of underground water
... 93–98
Geologica Macedonica
Год
.
29
Број
1
стр
.
1–100
Штип
2015
СОДРЖИНА
285.
Тена
Шијакова
-
Иванова
,
Весна
Амбаркова
Геохемиска
процена
на
некои
природни
води
од
источна
и
југоисточна
Македонија
... 5–14
286.
Војо
Мирчовски
,
Блажо
Боев
,
Златко
Ефремоски
,
Ajka Šorša,
Ѓорги
Димов
Хидрохемиски
податоци
за
подземните
води
на
битолскиот
дел
од
Пелагониската
Котлина
,
Република
Македонија
... 15–24
287.
Дафинка
Димитрова
,
Иван
Боев
,
Весна
Зајкова
Панова
Тешки
и
токсични
метали
во
водата
и
седиментите
на
реката
Вардар
во
Скопје
... 25–46
288.
Орце
Спасовски
,
Даниел
Спасовски
Можности
за
користење
на
травертинот
од
наоѓалиштето
Набигори
,
с
.
Велмеј
(
западна
Македонија
)
како
архитектонски
камен
... 47–52
289. Biljana Balabanova, Traj
č
e Stafilov, Robert Šajn, Claudiu T
ă
n
ă
selia
Дистрибуција
на
олово
во
почвите
како
резултат
на
литогените
и
антропогените
фактори
во
регионот
на
сливот
на
реката
Брегалница
... 53–61
290.
Игор
Ивановски
,
Далибор
Серафимовски
,
Горан
Тасев
,
Тодор
Серафимовски
3D
моделирање
на
полиметаличното
Au-Cu
наоѓалиште
Плавица
,
Република
Македонија
... 63–74
291.
Игор
Пешевски
,
Милорад
Јовановски
,
Јован
Бр
.
Папиќ
,
Биљана
Аболмасов
Индекс
за
восппставување
и
управување
на
банка
на
податоци
за
свлечишта
во
Република
Македонија
... 75–86
292.
Аринит
A.
Река
,
Благој
Павловски
,
Тодор
Ановски
,
Слободан
Богоевски
,
Бошко
Бошковски
Фазни
трансформации
на
аморфен
SiO2
во
дијатомит
во
температурен
интервал
1000–1200 °C... 87–92
293.
Владимир
Маневски
,
Тодор
Делипетров
,
Марјан
Делипетрев
Геоелектрични
мерења
во
средина
со
присуство
на
подземна
вода
... 93–98
Упатство
за
авторите
...99–100
287 Geologica Macedonica, Vol. 29, No. 1, pp. 25–46 (2015)
GEOME 2 In print: ISSN 0352 – 1206
Manuscript received: March 9, 2015 On line: ISSN 1857 – 8586
Accepted: April 4, 2015 UDC: 504.5:546.4/.8]:627.154(497.711)
Original scientific paper
HEAVY AND TOXIC METALS IN WATER AND SEDIMENTS
OF THE VARDAR RIVER IN SKOPJE
Dafinka Dimitrova, Ivan Boev, Vesna Zajkova Panova
Faculty of Natural and Technical Sciences, Institute of Geology, University “Goce Delčev”in Štip,
Blvd. Goce Delčev, 89, Štip, Republic of Macedonia
ivan.boev@ugd.edu.mk
A b s t r a c t: Ninety composite samples (45 samples of surface water and 45 samples of river sediments) were collected from course of the Vardar river, in the urban part of the Skopje valley – City, in the period from 8. 3. 2013 to 17. 5. 2013. Heavy metals concentrations (Аl, As, Ba, Ca, Cd, Co, Cr, Cu, Fe, K, Mg, Mn, Na, Ni, Pb, Sr, Ti, Zn), some non-metals (B, P), anions and more physico-chemical parameters of water and sediments in the Vardar river, during its course through the urban area, were studied in order to assess and discuss its pollution in Skopje and the origin of this pollution. Besides water, river sediments, as reservoirs of most pollutants, were analyzed, using meth-ods of Geoaccumulation index (Igeo) and Enrichment factor (EF).
Key words: heavy metals; Vardar river; pollution; water; sediments
INTRODUCTION
In the course of the Vardar river is situated
major urban settlement Skopje, where live about
500,000 people. Increasing urbanization and
indus-trialization results in polluting the river, since the
river is preferred waste disposal site for domestic,
agricultural and industrial effluents, (Boev and
Le-pitkova, 2002), sometimes in their unprocessed
state, because some industries do not make
pre-treatment
of waste water or sewage, which they
discharged to river, so effluents go, directly or
in-directly, to river waters, by surface run off or
drainage. They are all potential sources of
contami-nants in the Vardar river. Various substances,
or-ganic or inoror-ganic, that can contaminate the river,
come to Vardar (many of them come from
anthro-pogenic sources, they are results of various human
activities) (Boev and Lipitkova, 2002), but the
most common and most dangerous are metals,
primarily because they have significant
toxicologi-cal impact and are particularly resistant to
degrada-tion and removal. Heavy metals, derived from
natural (geochemical) or anthropological sources,
when they come in contact with water systems, are
distributed among the various parts of these
sys-tems, water, sediments and biological communities
in the sediments, their distribution depends of the
mineralogical and chemical composition of various
substances present, of anthropological influences
and processes. Suspended particles in water flows
collect contaminants due to their nature of
sorp-tion, for example heavy and toxic metals (which
are considered the least soluble), coming up to
en-vironment from anthropogenic sources in the form
of inorganic complexes or hydrated ions, floating
in waters or accumulate in sediments of aquatic
ecosystems, where they bind to sediment matrices,
with weak physical and chemical bonds and
sedi-ment at bottom of rivers. Sedisedi-ments are known as
major removers of metals in aquatic environments,
but they are also important reservoirs of such
sub-stances, from where they are desorbed and
trans-formed to different bioavailable and toxic forms
(Imran & Aboul-Enein, 2006). with exposure to
various chemical environments. Sorbed on
sedi-ments, in aquatic ecosystems, such as the Vardar
river, contaminants are transported by river in
sus-pension or like drag sediment and through
solubil-ity, they become sources of water pollution with
heavy metals. The more heavy metals dissolve and
pass easier in the aqueous phase, the more they
have greater toxicological significance and
bio-availability. Surface sediments provide a good
rep-resentation and analysis of the current state of
an-thropogenic input of metals into rivers.
THE STUDY AREA
The study area is located on the northern part
of the Republic of Macedonia, in the Skopje
val-ley, its urban part – Skopje City, on about 41
˚
59’
latitude, 21
˚
25’ longitude. Starts from the west
en-trance of the Vardar river in Skopje, near the
set-tlement of Kondovo, before the bridge on the ring
road around Skopje and ends at the southeast of
Skopje, near Dolno Lisi
č
e, just before the bridge
over the Vardar, on the road that connects Dolno
Lisi
č
e with Jurumleri.
Measurement locations were chosen because
of the proximity of potential contaminants and
availability of measuring points (Table 1 and
Fig-ure 1). They are:
1) v. Kondovo – reference point, the first
measurement location, comparing the input into
Vardar, in terms of what is input and
characteris-tics of the river before entering the city – M1;
2) St. Lazar – located in Ðor
č
e Petrov, just
before the tributary Treska – M2;
3) Hrom – in the settlement of Hrom, where
on the left riverbank, near the river are situated
more former, large industrial facilities – M3;
4) Zloku
ć
ani – before the tributary Lepenec,
in urban neighborhoods Vlae and Karpoš 4, near
the great industrial zone – Lepenec – M4;
5) Momin Potok – after the triburaty Serava,
near the industrial zone, with more old and
cur-rents plants and warehouses – M5
6) Železni
č
ka stanica –
in the very urban core
of the city,
with more current and former sources
of pollutants. Just before the measurement point is
Transport center (railway station) and railway
bridge – M6;
7) Novo Lisi
č
e – urban part of the city, on the
right bank of the river is a urban settlement and
more sites and the left bank of the river has more
former, large industrial facilities, some of which
are still active – M7;
8) Gorno Lisi
č
e – near one side has a landfill
and industrial zone, and on the other side is
settle-ment of Gorno Lisi
č
e and agricultural areas – M8;
9) Dolno Lisi
č
e – near wild dump, on the road
connecting settlements Dolno Lisi
č
e and Jurumleri,
before the bridge on Vardar, near cultivated,
agri-cultural areas – M9;
The measurement locations are located at the
following coordinates, assessed with the GPS.
T a b l e 1
Coordinates of measurement locations
Т. Masurement location Latitude Longitude M1 v. Kondovo 42.00661N 21.31379E M2 St. Lazar – GP 42.00294N 21.34574E M3 Hrom 41.99906N 21.37503E M4 Zlokućani 42.01160N 21.38202E M5 Momin Potok 42.01397N 21.41670E M6 Železnička st. 41.99270N 21.45135E M7 Novo Lisiče 41.99057N 21.47608E M8 Gorno Lisiče 41.98093N 21.49924E M9 Dolno Lisiče 41.96273N 21.54423E
Heavy and toxic metals in water and sediments of the River Vardar in Skopje
27
Geologica Macedonica, 29 (1), 25–46 (2015)
MATERIALS AND METHODS
Sampling and preparation
From each one measurement location on the
Vardar river, were sampled simultaneously,
com-posite water and comcom-posite sediment samples (for
composite samples – Mitra, Somenath, 2003;
Har-vey, 2006). Water and fresh retained sediments
(that are sediments before a short time frame and
retained and separated by river currents and
sedi-ments that the river carries), were taken from
shal-low, coastal waters of the river, near the right and
left banks of the river, at a distance from the coast
1–1.5 m. The waters were collected at a depth of
10–15 cm from the surface of the water and
sedi-ments at a depth of 0–10 cm from the bottom of
the river, on the same measurement locations.
Samples were collected during the period 8. 3.
2013
to 17. 5. 2013 in 5 occasions, with frequency
of measurement 18–19 days. Water samples were
collected in bottles of inert plastic (polyethylene),
with immersion on the specified depth and
sedi-ment samples were taken with grab and placed in
polyethylene bags, then they were transported
un-der standard conditions to the laboratory.
Tempera-tures of the water and sediments are determined in
the field, while the other parameters (pH, turbidity,
organic matter, alkalinity, COD, anions, cations)
are determined before or after certain preparations
were made on them in the laboratory.
Analysis of samples
Concentrations of heavy metals were
deter-mined by Liberty – Varian ICP – AES
spectrome-ter, after being extracted from the samples, by the
digestion with acids, anions were determined with
the spectrophotometer and for the determination of
other parameters were used valid, standard
analyti-cal methods and equipment (Ahuja & Jespersen,
2006; Van de Wiel, 2003; Boss & Fredeen, 1997).
RESULTS AND DISCUSSION
The purpose of this study is to assess the
level of contamination, toxic heavy metals and
quality of water and sediments in surface parts of
the Vardar river, horizontal distribution of these
contaminants and to evaluate the status of pollution
around
the downstream of Vardar in its urban part
– Skopje City, because contamination is most
eas-ily accomplished by human activity, so the river
water and especially river sediments near urban
areas usually contain high levels of contaminants,
which is a serious environmental problem.
River water
The measured values for heavy metals in the
river water are given in Table 2 and they are
com-pared
with the maximum allowable concern of
me-tals under
Uredba za klasifikacija na vodite
– Sl.
vesnik br.18/99 (Decree on Water Classification –
Gazette No. 18/99), with Dutch (target values – TG
and intervention – IntV values,
The New Dutchlist
)
and Australian standards for metals in freshwater
(
А
NZECC/ARMCANZ-2000).
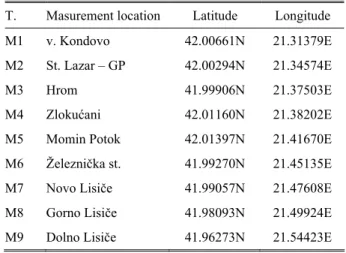
The obtained results of surface water in
Var-dar distribution is shown in Figure 2) compared
with Macedonian MAC regulation (
Uredba za
clasifikacija na vodite,
Sl. vesnik RM br.18/99 –
Decree on Water Classification – Gazette RM No.
18/99), indicate that the waters of the river meet
the quality criteria of class I, in terms of Al, Ba,
Co, Cr, Fe, Ti, Zn and B,
there are no
contamina-tions with these metals. Compared with average
measured values of Al, Cr, in 2007 in the Vardar
river there is a decrease in the concentration of
these metals. There is a slight increase in
concen-tration of Fe and Zn, that measured values show
compared to 2007 (
Study on waste water
manage-ment 2007
– LEAP 2 Skopje City – 2011).
How-ever, incurred increased concentrations of Cr, two
times in M1 (v. Kondovo) are larger than TG –
values from the Dutch list of standards for ground
water, but far from IntV–value (intervention),
which are requiring action to prevent further
pollu-tion. In terms of Mg, Ca, K and Na, results were
monitored by MAC for drinking water in
emergen-cies and there is no evidence of contamination
(
Pravilnik za bezbednost na vodata
, Sl. vesnik
46/08 – Rules of water safety). It is notable
pollu-tion with Pb, especially 29. 4. 2013 at two
measur-ing locations, M1 and M3, with values
correspond-ing to the V class of water, and in M5, on the 17. 5.
2013. The measurement locations M3 and M6
con-sistently elevated value of Pb, suggesting the
exis-tence of a source of ongoing contamination with
Pb in these locations. Regarding the previously
mentioned Study from 2007, there is some increase
of Pb concentration, from then (LEAP 2, 2011).
All measured values are smaller than Dutch
IntV-value for Pb. Accidental pollution of the Vardar
river happens with Mn (M5), As (M2) and Cd
(M9), and there is little pollution in M5 with Cu.
Cu pollution is larger to some measurement
loca-tions in relation to 2007
,
according to the Study
from 2007. The content of As is in satisfactory
lim-its, except 12. 4. 2013 in M2, but at this point the
measured value is less than the Dutch IntV-value,
too. The content of Sr is evaluated according to
some studies in the United States, after which the
values of Sr under 0.5 mg/l for rivers are low
val-ues for ambient water (Skougstadt & Horr, 1960;
Alfredo, 2014) and from this aspect the measured
Sr contents in Vardar are below these values.
Pol-lution of surface waters of Vardar
is greater from
aspect of P ratio eutrophication, at all measurement
locations, especially in M5 (Momin Potok) and M9
(Dolno Lisi
č
e), except for M3 (Hrom), where is
close to the value for I and II-class of waters.
T a b l e 2
Concentrations of metals and some non-metals in water of the Vardar
Water (mg/l) Al As Ba Cd Co Cr Cu Fe Mg Mn Ni Pb Sr Ti Zn 8. 03. 2013 М1 <0.005 0.019 0.034 <0.005 <0.005 0.008 <0.005 0.069 4.91 0.008 0.028 <0,01 0.104 <0.005 0.020 М2 0.008 <0.005 0.014 <0.005 <0.005 <0.005 <0.005 0.069 5.40 0.005 0.039 <0,01 0.095 <0.005 <0.005 М3 0.010 0.022 0.018 <0.005 <0.005 <0.005 <0.005 0.071 12.00 0.003 0.044 <0,01 0.122 <0.005 <0.005 М4 0.011 0.009 0.015 <0.005 <0.005 <0.005 <0.005 0.051 11.90 0.004 0.016 0.015 0.114 <0.005 <0.005 М5 0.011 0.007 0.024 <0.005 <0.005 <0.005 <0.005 0.049 23.43 0.078 0.028 <0,01 0.226 <0.005 <0.005 М6 0.011 0.013 0.016 <0.005 <0.005 <0.005 <0.005 0.051 12.30 0.008 0.021 0.024 0.120 <0.005 <0.005 М7 0.011 0.027 0.019 <0.005 <0.005 <0.005 <0.005 0.060 14.80 0.007 0.105 <0,01 0.142 <0.005 0.005 М8 0.012 0.030 0.019 <0.005 <0.005 <0.005 <0.005 0.049 14.30 0.009 0.027 <0,01 0.138 <0.005 0.006 М9 0.012 0.020 0.017 <0.005 <0.005 <0.005 <0.005 0.040 13.40 0.008 0.043 <0,01 0.127 <0.005 0.010 Mean 0.011 0.017 0.020 0.005 0.005 0.006 0.005 0.057 12.49 0.015 0.039 0.013 0.132 0.005 0.008 Med 0.011 0.019 0.018 0.005 0.005 0.005 0.005 0.051 12.30 0.008 0.028 0.010 0.122 0.005 0.005 Min 0.005 0.005 0.015 0.005 0.005 0.005 0.005 0.040 4.91 0.004 0.016 0.010 0.095 0.005 0.005 Max 0.012 0.030 0.034 0.005 0.005 0.008 0.005 0.071 23.43 0.078 0.105 0.024 0.226 0.005 0.020 SD 0.003 0.009 0.006 0.000 0.000 0.001 0.000 0.011 5.46 0.024 0.027 0.005 0.039 0.000 0.005 26. 3. 2013 М1 0.011 0.027 0.021 <0.005 <0.005 <0.005 <0.005 0.039 4.90 0.008 0.017 <0,01 0.132 <0.005 <0.005 М2 0.012 0.007 0.023 <0.005 <0.005 <0.005 <0.005 0.037 5.00 0.006 0.025 <0,01 0.135 <0.005 <0.005 М3 0.010 0.014 0.016 <0.005 <0.005 <0.005 <0.005 0.157 5.30 0.003 0.018 0.011 0.115 <0.005 <0.005 М4 0.011 0.014 0.019 <0.005 <0.005 <0.005 <0.005 0.096 5.40 0.003 0.035 0.010 0.119 <0.005 <0.005 М5 0.011 0.009 0.018 <0.005 <0.005 <0.005 0.011 0.096 7.10 0.056 <0,005 <0,01 0.140 <0.005 <0.005 М6 0.009 0.016 0.018 <0.005 <0.005 <0.005 <0.005 0.104 5.30 0.006 0.039 0.012 0.125 <0.005 <0.005 М7 0.007 <0,005 0.011 <0.005 <0.005 <0.005 <0.005 0.138 4.10 0.001 0.004 <0,01 0.087 <0.005 <0.005 М8 0.008 <0,005 0.012 <0.005 <0.005 <0.005 <0.005 0.018 4.40 0.005 0.039 <0,01 0.089 <0.005 <0.005 М9 0.007 0.021 0.012 0.025 <0.005 <0.005 <0.005 0.047 7.52 0.002 <0,005 0.030 0.093 <0.005 <0.005 Mean 0.010 0.013 0.017 0.008 0.005 0.005 0.006 0.082 5.45 0.010 0.021 0.013 0.115 0.005 0.006 Med 0.010 0.014 0.018 0.005 0.005 0.005 0.005 0.096 5.30 0.005 0.018 0.010 0.119 0.005 0.005 Min 0.008 0.005 0.011 0.005 0.005 0.005 0.005 0.018 4.10 0.001 0.004 0.010 0.087 0.005 0.005 Max 0.012 0.027 0.023 0.025 0.005 0.005 0.011 0.157 7.52 0.056 0.039 0.030 0.140 0.005 0.007 SD 0.002 0.008 0.005 0.007 0.000 0.000 0.002 0.049 1.15 0.018 0.015 0.007 0.021 0.000 0.001Heavy and toxic metals in water and sediments of the River Vardar in Skopje
29
Geologica Macedonica, 29 (1), 25–46 (2015) Water (mg/l) Al As Ba Cd Co Cr Cu Fe Mg Mn Ni Pb Sr Ti Zn 12. 4. 2013 М1 0.011 0.008 0.023 <0.005 <0.005 0.008 <0.005 0.015 4.2 <0.005 0.002 0.018 0.143 <0.005 <0.005 М2 0.011 0.040 0.029 <0.005 <0.005 <0.005 <0.005 0.009 4.3 <0.005 0.038 <0,01 0.159 <0.005 <0.005 М3 0.010 0.011 0.022 <0.005 <0.005 <0.005 <0.005 0.004 5.3 <0.005 0.009 0.011 0.151 <0.005 <0.005 М4 0.010 0.023 0.020 <0.005 <0.005 <0.005 <0.005 0.005 4.8 <0.005 0.036 <0,01 0.147 <0.005 <0.005 М5 0.010 <0.005 0.021 <0.005 <0.005 <0.005 <0.005 0.019 5.0 <0.005 0.007 0.011 0.162 <0.005 <0.005 М6 0.010 0.017 0.021 <0.005 <0.005 <0.005 <0.005 0.006 4.7 <0.005 0.009 <0,01 0.144 <0.005 <0.005 М7 0.009 <0.005 0.020 <0.005 <0.005 <0.005 <0.005 0.006 4.2 <0.005 0.005 <0,01 0.138 <0.005 <0.005 М8 0.009 0.008 0.017 <0.005 <0.005 <0.005 <0.005 0.001 3.5 <0.005 <0,005 0.020 0.130 <0.005 <0.005 М9 0.009 0.020 0.016 <0.005 <0.005 <0.005 <0.005 0.005 3.7 <0.005 0.007 0.022 0.113 <0.005 <0.005 Mean 0.010 0.016 0.021 0.005 0.005 0.006 0.005 0.008 4.41 0.005 0.014 0.014 0.144 0.005 0.005 Med 0.010 0.012 0.021 0.005 0.005 0.005 0.005 0.006 4.30 0.005 0.007 0.011 0.144 0.005 0.005 Min 0.009 0.005 0.016 0.005 0.005 0.005 0.005 0.001 3.53 0.005 0.002 0.010 0.114 0.005 0.005 Max 0.012 0.040 0.029 0,005 0,005 0.008 0.005 0.019 5.27 0.005 0.038 0.023 0.163 0.005 0.005 SD 0.001 0.012 0.004 0.000 0.000 0.001 0.000 0.006 0.59 0.000 0.014 0.006 0.015 0.000 0.000 29. 4. 2013 М1 0.007 0.028 0.029 <0.005 <0.005 <0.005 <0.005 0.004 3.1 0.015 0.014 0.034 0.128 <0.005 <0.005 М2 0.008 0.021 0.035 <0.005 <0.005 <0.005 <0.005 0.228 3.8 0.022 0.103 0.010 0.133 <0.005 <0.005 М3 0.008 0.022 0.038 <0.005 <0.005 <0.005 <0.005 0.060 3.7 0.003 <0,005 0.041 0.137 <0.005 <0.005 М4 0.010 0.021 0.021 <0.005 <0.005 <0.005 <0.005 0.033 5.1 0.001 0.034 <0,01 0.132 <0.005 <0.005 М5 0.015 0.011 0.043 <0.005 <0.005 <0.005 <0.005 0.051 12.6 0.133 0.039 0.023 0.349 <0.005 <0.005 М6 0.009 0.011 0.100 <0.005 <0.005 <0.005 <0.005 0.075 4.1 0.005 0.019 0.021 0.125 <0.005 <0.005 М7 0.009 0.006 0.023 <0.005 <0.005 <0.005 <0.005 0.051 4.3 0.003 0.007 0.011 0.125 <0.005 <0.005 М8 0.009 <0.005 0.022 <0.005 <0.005 <0.005 <0.005 0.049 4.1 0.008 0.013 <0,01 0.113 <0.005 <0.005 М9 0.009 0.014 0.029 <0.005 <0.005 <0.005 <0.005 0.066 4.4 0.021 0.011 <0,01 0.127 <0.005 <0.005 Mean 0.010 0.016 0.038 0.005 0.005 0.005 0.005 0.069 5.02 0.024 0.028 0.019 0.153 0.005 0.006 Med 0.009 0.014 0.029 0.005 0.005 0.005 0.005 0.051 4.10 0.008 0.014 0.011 0.128 0.005 0.005 Min 0.008 0.005 0.022 0.005 0.005 0.005 0.005 0.004 3.08 0.002 0.005 0.010 0.113 0.005 0.005 Max 0.015 0.028 0.100 0.005 0.005 0.005 0.005 0.228 12.62 0.133 0.103 0.042 0.349 0.005 0.009 SD 0.003 0.008 0.025 0.000 0.000 0.000 0.000 0.063 2.91 0.042 0.031 0.012 0.075 0.000 0.002 17. 5. 2013 М1 0.007 0.014 0.021 <0.005 <0.005 <0.005 <0.005 0.052 2.4 0.018 0.050 <0,01 0.102 <0.005 <0.005 М2 0.007 0.004 0.021 <0.005 <0.005 <0.005 <0.005 0.091 2.4 0.015 0.016 0.010 0.111 <0.005 <0.005 М3 0.009 0.001 0.020 <0.005 <0.005 <0.005 <0.005 0.019 3.9 0.008 0.058 <0,01 0.136 <0.005 <0.005 М4 0.009 0.016 0.020 <0.005 <0.005 <0.005 <0.005 0.057 3.5 0.007 0.016 <0,01 0.131 <0.005 <0.005 М5 0.014 0.012 0.037 <0.005 <0.005 <0.005 <0.005 0.092 10.9 0.122 0.014 0.043 0.313 <0.005 <0.005 М6 0.008 0.013 0.021 <0.005 <0.005 <0.005 <0.005 0.066 3.6 0.013 0.045 0.014 0.145 <0.005 <0.005 М7 0.007 <0.005 0.020 <0.005 <0.005 <0.005 <0.005 0.065 3.2 0.013 0.039 <0,01 0.130 <0.005 <0.005 М8 0.009 0.021 0.008 <0.005 <0.005 <0.005 0.006 0.069 3.7 0.016 0.019 <0,01 0.130 <0.005 <0.005 М9 0.008 0.012 0.022 <0.005 <0.005 <0.005 <0.005 0.098 3.2 0.099 0.034 <0,01 0.139 <0.005 <0.005Water (mg/l) Al As Ba Cd Co Cr Cu Fe Mg Mn Ni Pb Sr Ti Zn Mean 0.009 0.011 0.022 0.005 0.005 0.005 0.006 0.068 4.08 0.035 0.033 0.015 0.149 0.005 0.005 Med 0.009 0.013 0.021 0.000 0.005 0.005 0.005 0.066 3.50 0.015 0.034 0.010 0.131 0.005 0.005 Min 0.007 0.001 0.009 0.005 0.005 0.005 0.005 0.020 2.36 0.008 0.015 0.010 0.103 0.005 0.005 Max 0.014 0.021 0.038 0.005 0.005 0.005 0.006 0.099 10.93 0.122 0.059 0.044 0.313 0.005 0.005 SD 0.002 0.007 0.008 0.000 0.000 0.000 0.001 0.025 2.61 0.044 0.017 0.012 0.063 0.000 0.000 MAC Mak I–
V class 1.5 0.03–0.05 1–4 0.0001–0.01 0.1–2 0.05–0.1 0.01–0.05 0.3–1 50▲ 0.05–1 0.05–0.1 0.01–0.03 – 0.1 0.1–0.2 Dutch (TG– MAC) – 0.01– 0.06 0.05– 0.625 0.0004– 0.006 0.02– 0.1 0.001– 0.03 0.015– 0.075 – – – 0.015– 0.075 0.0150 –.075 – – 0.065– 0.8 ANZECC 0.2 0.01 2 0.002 – Cr(VI)0.05 2 0.3 15 0.5 0.02 0.01 – – 3
Average values for harmful and hazardous substances in the Vardar river and its tributaries on the territory of the city – river Treska and river of Lepenec [Source: Study on waste water management 2007 – LEAP 2 Skopje City – 2011]
Saraj 0.0622 – – 0.00002 – 0.0064 0.0014 0.042 – – – 0.003 – – 0.0069 Vlae 0.0434 – – 0.00001 – 0.0057 0.0015 0.034 – – – 0.004 – – 0.0059 Kamen 0.0624 – – 0.00001 – 0.0052 0.0013 0.061 – – – 0.003 – – 0.0102 Saem 0.0503 – – 0.00002 – 0.0053 0.0019 0.068 – – – 0.003 – – 0.0083 Ohis 0.0392 – – 0.00001 – 0.0036 0.0021 0.100 – – – 0.003 – – 0.0098 Trubarevo. 0.0412 – – 0.00002 – 0.0039 0.0021 0.089 – – – 0.003 – – 0.0084 Treska river 0.0299 – – 0.00003 – 0.0038 0.0013 0.036 – – – 0.003 – – 0.0058 Lepenec 0.1256 – – 0.00002 – 0.0037 0.0019 0.089 – – – 0.004 – – 0.0115
Continuation of Table 2
Water(mg/l) Ca K Na B P 8. 3. 2013 М1 49.62 1.90 5.30 0.018 0.030 М2 41.78 1.28 4.80 <0,01 0.023 М3 64.60 1.41 7.20 0.022 <0,01 М4 58.64 1.39 6.40 0.012 0.006 М5 68.11 2.57 16.62 <0,01 0.121 М6 62.49 1.34 7.30 0.013 0.017 М7 74.29 1.43 7.70 0.017 <0,01 М8 70.53 1.54 8.50 0.014 0.078 М9 65.72 1.42 8.20 0.012 0.018 Mean 61.76 1.59 8.00 0.015 0.035 Med 64.60 1.42 7.30 0.013 0.018 Min 41.78 1.28 4.80 0.010 0.006 Max 74.29 2.57 16.62 0.022 0.121 SD 10.34 0.41 3.46 0.004 0.039Heavy and toxic metals in water and sediments of the River Vardar in Skopje
31
Geologica Macedonica, 29 (1), 25–46 (2015) Water(mg/l) Ca K Na B P 26. 3. 2013 М1 35.176 1.49 5.1 <0,01 0.074 М2 41.583 1.44 5.2 <0,01 0.051 М3 43.693 1.49 5.7 <0,01 <0,01 М4 38.642 1.32 5.4 <0,01 0.165 М5 36.890 2.12 7.8 <0,01 0.141 М6 38.207 1.39 5.6 <0,01 0.038 М7 32.758 1.16 4.2 <0,01 0.022 М8 36.301 1.36 6.0 <0,01 0.091 М9 30.777 1.62 7.0 <0,01 0.076 Mean 37.12 1.49 5.78 0.010 0.075 Med 36.89 1.44 5.60 0.010 0.074 Min 30.78 1.17 4.25 0.010 0.010 Max 43.70 2.12 7.83 0.010 0.166 SD 4.04 0.269 1.06 0.000 0.053 12. 4. 2013 М1 32.980 1.49 4.1 <0,01 0.014 М2 36.724 1.48 4.7 <0,01 <0,01 М3 40.632 1.44 5.1 <0,01 <0,01 М4 37.891 1.47 4.9 <0,01 0.023 М5 33.655 1.86 25.5 <0,01 0.044 М6 35.333 1.57 5.0 <0,01 <0,01 М7 34.453 1.59 5.1 <0,01 0.024 М8 32.018 1.39 4.8 <0,01 0.042 М9 35.149 1.32 4.7 <0,01 <0,01 Mean 35.43 1.52 7.10 0.010 0.021 Med 35.15 1.48 4.90 0.010 0.014 Min 32.02 1.33 4.10 0.010 0.010 Max 40.64 1.86 25.50 0.010 0.045 SD 2.67 0.155 6.91 0.000 0.014 29. 4. 2013 М1 34.833 1.27 4.5 <0,01 0.111 М2 42.069 1.55 5.7 <0,01 <0,01 М3 51.762 1.54 6.1 0.015 0.018 М4 44.524 1.44 5.5 <0,01 0.024 М5 65.548 3.89 22.2 0.014 0.267 М6 41.199 1.46 5.3 <0,01 0.017 М7 39.409 1.38 5.6 <0,01 <0,01 М8 39.869 1.46 6.3 <0,01 0.039 М9 44.959 1.68 7.3 <0,01 0.083Water(mg/l) Ca K Na B P Mean 44.91 1.75 7.62 0.011 0.065 Med 42.07 1.46 5.70 0.010 0.024 Min 34.84 1.28 4.50 0.010 0.010 Max 65.55 3.89 22.20 0.015 0.267 SD 9.03 0.82 5.53 0.002 0.084 17. 5. 2013 М1 29.420 1.07 3.1 <0,01 <0,01 М2 28.110 1.16 3.0 <0,01 0.020 М3 37.297 1.42 4.7 <0,01 <0,01 М4 35.497 1.20 4.0 <0,01 0.016 М5 51.292 3.01 12.5 <0,01 0.229 М6 35.681 1.33 4.1 <0,01 0.047 М7 31.097 1.34 4.2 <0,01 0.045 М8 30.545 1.40 4.9 <0,01 0.108 М9 49.950 1.34 5.2 <0,01 1.167 Mean 36.55 1.48 5.08 0.010 0.184 Med 35.50 1.34 4.20 0.010 0.045 Min 28.12 1.07 3.04 0.010 0.010 Max 51.30 3.02 12.51 0.010 1.167 SD 8.57 0.589 2.89 0.000 0.376 MAC Mak I–V class 200▲ 12* 200* 0.2–0.75 0.004–
0.05
Dutch (TG–MAC) – – – – –
ANZECC – – 180 4 –
Average values for harmful and hazardous substances in the Vardar river and its tributaries on the territory of the city –Treska river and Lepenec river
[Source: Study on wastewater management 2007 – LEAP 2 Skopje City – 2011] Saraj – – – – – Vlae – – – – – Kamen – – – – – Saem – – – – – Ohis – – – – – Trubarevо – – – – – Treska – – – – – Lepenec – – – – –
▲MAC – Maksimum Allowable Concentration in drinking water in extraordinary
circumstances following Rules for water safety, Official Gazette RM, No.46 / 08
* MDK – Maximum Permissible Concentration by Rules on water safety, Official Gazette No.46 / 08
Heavy and toxic metals in water and sediments of the River Vardar in Skopje
33
Geologica Macedonica, 29 (1), 25–46 (2015)
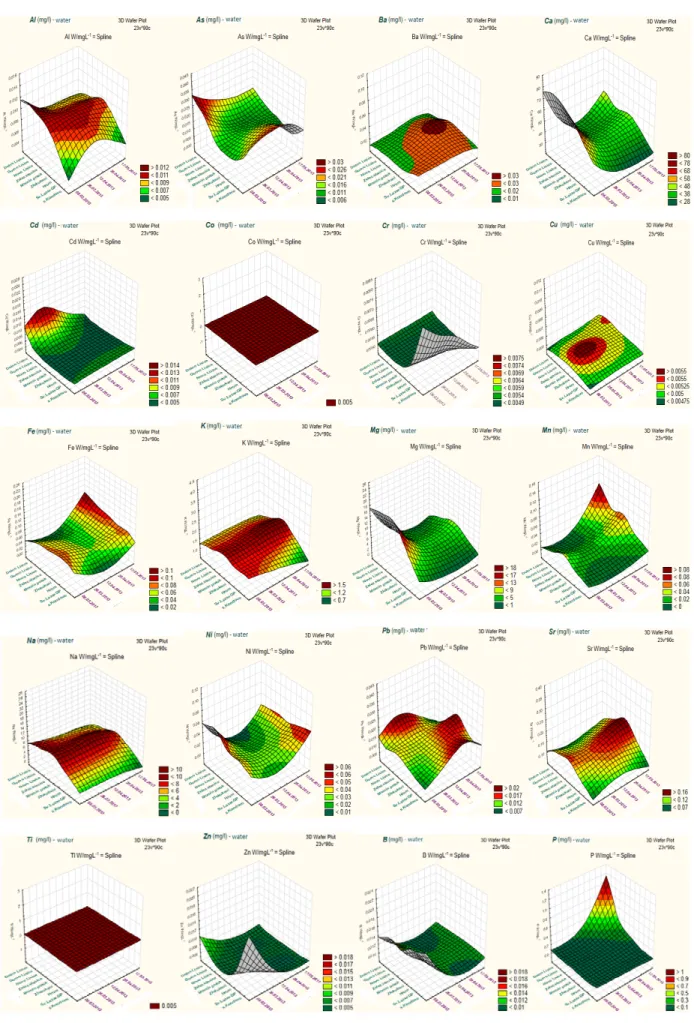
River sediments
The distribution of heavy metals is not equal
in sediments along the river (Table 3 and Figure 3).
Varying the concentration of heavy metals is due
to differences in the sources of heavy metals,
physic-chemical conditions and complex reactions,
such as absorption, precipitation and redox
condi-tions prevailing in the sediments. The results for
the measured concentrations of heavy metals and
some non-metals in river sediments of Vardar are
given in Table 3 and have been compared with
Macedonian recommended, maximum permissible
concentrations of heavy metals in soils and
sedi-ments (
Godišen izveštaj za obraboteni podatoci za
kvalitet na životna sredina vo RM za 2006 –
An-nual report on the processed data for Quality
En-vironment in Macedonia for 2006 – MZHSPRM),
the Dutch standards for soil and sediment (target –
TG values, and intervention – IntV values) and the
American Standards for sediments – EPA for
re-gion III and V (EPA).
Compared with Macedonian recommended
MAC for heavy metals in soil and sediments (
God-išen izveštaj za obraboteni podatoci za kvalitet na
životna sredina vo RM za 2006 – Annual report on
the processed data for Quality Environment in
Macedonia for 2006 – MZHSPRM
), in sediments
of the Vardar river within the allowed values are
the presence of Cd, Co, Cu, Mn and Pb.
Compar-ing these concentrations with the Study of
pollu-tion of the topsoil horizon in Skopje (Study on
waste water management 2007 – LEAP 2 Skopje
City – 2011) shows that in the sediments of the
Vardar river, Cd and Co are with slightly reduced
values and Pb with the much smaller values,
com-pared to 2007. There is variation in the content of
As, so the M6 and M9 is noted incidentally
ele-vated and on 26. 3. 2013, in all measurement
loca-tions there is contamination with As, but this
pollu-tion is smaller than the pollupollu-tion of soil, as it was
measured by the 2007 Study. Sediments in Vardar
suffer more intense pollution with Cr and Ni,
all
the way, for the entire period of study. In the 2007
study, there was higher pollution with Cr and Ni.
Heavy metals for which, there are no
recommen-ded MAC, are compared with Dutch standards for
soil and sediment and it was found that observed
value of Ba in the course of the river is higher. The
amount of Fe is analyzed relative to the reference
value for sediments in fresh water for the EPA
Re-gion III and V (USA). In all measurement
loca-tions in the period from 8. 3. 2013 to 17. 5. 2013,
Fe is with higher value. There is extremely
pollu-tion of Fe in the measuring locapollu-tion M9 (Dolno
Lisi
č
e) on 17. 5. 2013, where is a large source of
Fe-pollution, although in the water, at the same
period, in M9 is not observed contamination. This
only indicates that the sediments accumulate larger
concentrations of heavy metals. Mo, compared to
the Dutch list, is with low values in sediments and
V is with values that are below the intervention
value, but above optimal according to this list.
T a b l e 3
Concentrations of heavy metals and non-metals in river sediments of Vardar
Sediment mg/kg Al As Ba Cd Co Cr Cu Fe Mg MnМо
Ni Pb Sr
8. 3. 2013 М1 75427 42 187 <0.25 16 129 30 51991 27495 889 1.1 80 11 154 М2 72555 17 154 <0.25 20 330 29 71836 31162 1048 1.1 99 12 242 М3 65213 21 158 <0.25 15 143 24 51007 29855 853 1.0 80 12 179 М4 69314 18 228 <0.25 15 136 27 51620 30895 884 1.0 81 12 154 М5 79112 6.8 352 0.89 19 134 84 38826 30477 1014 1.4 107 39 168 М6 54274 31 171 0.35 15 128 33 34844 34930 778 0.9 89 21 173 М7 56795 17 174 0.24 16 128 30 36693 39548 784 0.9 106 15 190 М8 56195 7.2 195 <0.25 15 120 32 35058 46138 791 1.0 91 22 151 М9 59894 2.5 183 <0.25 13 98 34 36436 49202 754 1.0 84 21 138Heavy and toxic metals in water and sediments of the River Vardar in Skopje
35
Geologica Macedonica, 29 (1), 25–46 (2015) Sediment mg/kg Al As Ba Cd Co Cr Cu Fe Mg MnМо
Ni Pb Sr
Mean 65420 18.1 200.1 0.34 16.00 149.56 35.89 45368 35523 866 1.05 90.8 18.34 172.2 Med 65214 18.40 183 0.25 15 129 30 38826 31162 853 1.00 89 15 168 Min 54274 2.5 154 0.24 13 98 24 34844 27494 754 0.9 80 11 138 Max 79112 42 352 0.89 20 330 84 71836 49202 1048 1.4 107 39 242 SD 9138 12.47 61.01 0.21 2.32 68.84 18.30 12401 7737 106 0.16 10.84 8.95 30.69 26. 3. 2013 М1 77158 45 275 <0.25 18 123 32 59215 28710 928 1.1 83 17 171 М2 72340 51 212 <0.25 17 119 32 55667 27485 818 1.0 71 13 184 М3 65455 28 198 <0.25 17 140 38 50709 29335 778 0.9 86 9 173 М4 67686 49 205 <0.25 16 116 38 51285 28520 821 1.0 82 10 164 М5 65492 27 286 0.96 16 94 53 44796 31961 692 1.0 80 26 122 М6 60772 53 195 <0.25 19 147 51 57934 35366 935 0.8 89 17 141 М7 60623 32 193 <0.25 14 96 30 43452 39446 646 0.8 85 14 129 М8 49958 16 157 <0.25 13 99 23 37004 38739 591 0.7 67 15 118 М9 52016 41 153 <0.25 12 76 21 33573 53431 536 0.7 61 10 124 Mean 63500 37.91 208.2 0.33 15.78 112.23 35.34 48181.5 34777 749.4 0.89 78.23 14.56 147.34 Med 65455 40.75 198 0.25 16 116 32 50709 31961 778 0.9 82 14 141 Min 49958 16 153 0.25 12 76 21 33573 27485 536 0.7 61 9 118 Max 77158 53 286 0.96 19 147 53 59215 53431 935 1.1 89 26 184 SD 8811 12.91 45.65 0.24 2.34 23.03 11.07 9090 8310.35 142.14 0.15 9.61 5.23 25.66 12. 4. 2013 М1 56682 39 280 <0.25 18 131 34 54664 37069 1027 1.3 82 15 203 М2 54879 44 205 <0.25 19 176 30 55817 34786 1019 1.2 79 11 240 М3 47056 25 216 <0.25 18 188 23 52666 37290 971 1.0 84 20 220 М4 49302 14 227 <0.25 16 134 27 50271 35664 736 1.1 79 11 211 М5 50524 29 342 <0.25 18 164 39 43682 35524 893 1.2 116 26 156 М6 36927 8 186 <0.25 13 101 24 24940 38999 657 0.8 67 17 147 М7 41834 37 201 <0.25 15 112 23 32766 42796 754 0.9 85 14 165 М8 39753 26 185 <0.25 16 134 23 32119 41574 811 0.9 77 79 186 М9 38727 30 240 <0.25 13 96 26 24454 50995 674 0.9 75 18 170 Mean 46188 27.94 231.19 0.25 16.22 137.34 27.67 41265 39411 837.88 1.04 82.67 23.45 189 Med 47057 29.12 216 0.25 16 134 26 43682 37290 811 1.00 79 17 186 Min 36927 8 185 0.25 13 96 23 24454 34786 657 0.8 67 11 147 Max 56683 44 342 0.25 19 188 39 55817 50995 1027 1.3 116 79 240 SD 7218 11.50 50.93 0.00 2.23 32.61 5.66 12812 5136 144.45 0.18 13.62 21.35 31.70Sediment mg/kg Al As Ba Cd Co Cr Cu Fe Mg Mn
Мо
Ni Pb Sr
29. 4. 2013 М1 63312 32 213 <0.25 19 129 28 39971 18669 923 1.6 73 18 183 М2 65712 27 214 <0.25 16 130 34 42146 19424 1037 1.7 72 20 156 М3 53091 22 154 <0.25 17 127 17 37798 19950 774 1.3 71 33 175 М4 58858 20 183 <0.25 17 118 30 37211 20722 788 1.4 71 16 165 М5 59678 9.4 220 <0.25 18 145 31 39280 24090 803 1.5 95 21 140 М6 49820 11 229 <0.25 18 138 34 37220 24025 833 1.4 101 22 126 М7 48074 18 141 <0.25 14 109 21 38011 36698 622 1.2 73 11 141 М8 45223 6.96 175 <0.25 15 124 25 28677 24293 638 1.3 77 18 136 М9 58579 44 216 <0.25 15 117 26 38628 32248 717 1.4 83 19 125 Mean 55817 20.98 193.8 0.25 16.56 126.36 27.33 37661 24458 792.78 1.43 79.56 19.78 149.67 Med 58579 19.53 213 0.25 17 127 28 38011 24025 788 1.4 73 19 141 Min 45223 6.96 141 0.25 14 109 17 28677 18669 622 1.2 71 11 125 Max 65712 44 229 0.25 19 145 34 42146 36698 1037 1.7 101 33 183 SD 7084 11.72 31.78 0.00 1.67 11 5.75 3712 6165 131.14 0.16 11.22 5.92 21.08 17. 5. 2013 М1 – 18 289 <0.25 21 118 47 37582 32638 1196 1.2 90 19 144 М2 – 4.7 226 <0.25 20 140 46 – – 1001 1.1 103 13 177 М3 67886 33 172 <0.25 17 115 20 43305 39196 813 0.9 83 19 161 М4 51420 15 196 <0.25 19 140 30 33848 37816 843 1.0 97 12 164 М5 59989 12 215 <0.25 17 120 42 41262 41700 758 1.0 103 21 124 М6 54920 32 157 <0.25 15 161 28 15439 41471 648 0.6 79 20 121 М7 45153 10 175 <0.25 17 107 27 27062 44427 779 0.9 84 16 142 М8 51525 19 238 <0.25 21 161 31 34464 47905 923 1.1 112 28 187 М9 – 44 222 <0.25 21 132 30 2919404 – 899 1.1 99 19 165 Mean 55149 21.0 210 0.25 18.67 133 33.45 394046 40737 874 0.99 94.45 18.56 154 Med 53223 17.52 215 0.25 19 132 30 36023 41471 843 1.00 97 19 161 Min 45153 4.7 157 0.25 15 107 20 15439 32638 648 0.6 79 12 121 Max 67886 44 289 0.25 21 161 47 2919404 47905 1196 1.2 112 28 187 SD 7908 13 41 0.00 2.24 19.56 9.33 1020437 4882 158.54 0.18 11.07 4.72 23 MAC Mak – 30 – 1-3 50 100 100 – – 2300 – 70 100 – Dutch (TG-MAC) – 29-55 200-625 0.8-12 9-240 100-380 36-190 – – – 0.5-200 35-210 85-530 – EPA-III Vreg – 9.8 – 0.99 50 43.4 31.6 20000 – 460 – 22.7 35.8 –Contamination of the topsoil horizon with heavy metals in Skopje [Study on waste water management 2007 – LEAP 2 Skopje City – 2011]
Minimum – <3.0 – <0.4 4.26 42.0 7.28 – – – – 24.39 1.00 – Maximum – 70.1 – 1.3 22.53 345.8 592.1 – – – – 304.47 608.5 – Average – 15.24 – 0.57 12.71 108.7 57.26 – – – – 95.36 134.7 –
Heavy and toxic metals in water and sediments of the River Vardar in Skopje
37
Geologica Macedonica, 29 (1), 25–46 (2015)Continuation of Table 3.
Sediment mg/kgTi V Zn Ca K Na B P
8. 3. 2013 М1 4542 176 81 66082 14596 21152 229 1366 М2 6275 213 63 70013 13799 18628 311 1423 М3 4693 151 67 87493 13946 19715 537 1185 М4 4118 201 75 91390 15088 18724 253 1244 М5 4164 196 224 128690 17389 11930 862 2150 М6 4161 148 96 128409 11776 14119 486 1275 М7 4171 147 79 132388 10581 15404 440 1164 М8 3685 176 100 148314 14541 12626 467 1344 М9 3168 99 91 161467 14204 12753 595 1210 Mean 4331 167.4 97.34 112694 13991 16117 464.3 1374 Med 4164 176 81 128409 14204 15404 467 1275 Min 3168 99 63 66082 10581 11930 229 1164 Max 6275 213 224 161467 17389 21152 862 2150 SD 856 35.21 49.11 34680 1938 3481 195.27 303.93 26. 3. 2013 М1 4042 154 76 69917 14110 20628 61 1395 М2 4442 163 66 76822 11704 21698 50 1289 М3 4445 135 64 96674 10311 17430 142 1053 М4 4191 148 75 79566 10992 19624 67 1174 М5 3382 120 131 125906 12799 11564 131 1433 М6 5029 81 78 93762 10021 14435 73 976 М7 3389 97 59 132751 13161 15796 799 828 М8 3094 96 60 136088 10411 12716 41 806 М9 3673 187 51 165290 10709 13653 81 745 Mean 3966 131.3 73.34 108530.7 11579.8 16393.6 160.6 1077.67 Med 4042 135 66 96674 10992 15796 73 1053 Min 3094 81 51 69917 10021 11564 41 745 Max 5029 187 131 165290 14110 21698 799 1433 SD 628.75 35.35 23.40 32717.60 1454.03 3642.30 241.65 259.55 12. 4. 2013 М1 4002 184 88 45119 15210 18386 16 1541 М2 4354 172 80 43486 12773 18230 15 1475 М3 4762 167 73 52488 11382 15146 28 1338 М4 4496 157 77 50421 11868 15694 18 1364 М5 3923 165 108 56118 15120 12060 17 1276 М6 3306 133 67 80480 11013 10407 12 966 М7 3444 174 64 72306 11465 12663 18 1041 М8 4364 174 71 70796 10528 12543 20 1073 М9 3357 187 76 73422 11683 10512 16 1024Mean 4001 168.2 78.23 60515 12338 13961 17.78 1234 Med 4002 172 76 56118 11683 12663 17 1276 Min 3306 133 64 43486 10528 10407 12 966 Max 4762 187 108 80480 15210 18386 28 1541 SD 536 16.06 13.23 13796 1716 3043 4.44 213 29. 4. 2013 М1 4595 129 86 38634 15907 17189 13 1613 М2 4936 128 96 39675 14954 16558 31 1566 М3 5478 119 79 52463 12305 15230 47 1254 М4 4450 126 80 51550 13443 17183 11 1370 М5 4387 110 94 57773 15974 14046 44 1337 М6 4432 126 103 64793 15463 10933 12 1166 М7 3897 121 60 92408 12382 14373 9 990 М8 4092 108 79 51093 11492 10761 75 1149 М9 3878 102 86 74110 16200 12804 10 1101 Mean 4460.56 118.78 84.78 58056 14236 14342 28 1283 Med 4432 121 86 52463 14954 14373 13 1254 Min 3878 102 60 38634 11492 10761 9 990 Max 5478 129 103 92408 16200 17189 75 1613 SD 509.72 9.84 12.50 17031 1838 2470 23.16 209.45 17. 5. 2013 М1 4394 118 103 37350 15891 24242 144 1413 М2 4968 129 84 – – – 273 1393 М3 4883 106 76 44243 16862 25870 194 1183 М4 4790 130 80 54058 10705 22595 301 1163 М5 4064 106 99 56814 13769 26220 19 1159 М6 3138 46 89 63528 14276 19587 15 813 М7 4214 129 67 79114 10434 17374 17 1015 М8 4941 128 101 71657 13703 22243 397 1252 М9 4723 123 93 – – – 23 1167 Mean 4458 112.78 87.9 58110 13663 22591 154 1174 Med 4723 123 89 56814 13769 22595 144 1167 Min 3138 46 67 37350 10434 17374 15 813 Max 4968 130 103 79114 16862 26220 397 1413 SD 593.27 26.79 12.28 14694 2407.02 3241 145.8 183 MAC Mak
–
–
200
–
–
–
–
–
Dutch (TG–MAC)–
42–250
140–720
–
–
–
–
–
EPA–III I Vreg–
–
121
–
–
–
–
–
Contamination of the topsoil horizon with heavy metals in Skopje [Study on waste water management 2007 – LEAP 2 Skopje City – 2011]
Minimum
–
–
23.08–
–
–
–
–
Maximum
–
–
366.25–
–
–
–
–
Heavy and toxic metals in water and sediments of the River Vardar in Skopje
39
Geologica Macedonica, 29 (1), 25–46 (2015)
Correlation analysis for heavy metals in water
and sediments
In the following
Т
able 4 is given correlation
matrix for heavy metals and some non-metals in
sediments in relation to these elements in the
wa-ters of Vardar river.
It is notable, that there is a significant positive
correlation between the Cu in river water and Cd
of river sediment under that water, then between
the Mg from water and Cu, Zn, Ca and B of river
sediments, between Na from water and Ba, Ni and
Zn from sediments and between Ca from the
wa-ters and B of sediments and between Mn from the
water and Zn from sediment. If the observed
corre-lations are between the same metal contents in
wa-ter and sediments, we can observe positive and
significant correlation only between forms of Cu,
Ca, K and B in water and sediments, because of
their transformation and mobilization of water in
the solid phase and vice
versa.
T a b l e 4
Correlation between metals and some non-metals in water and sediments
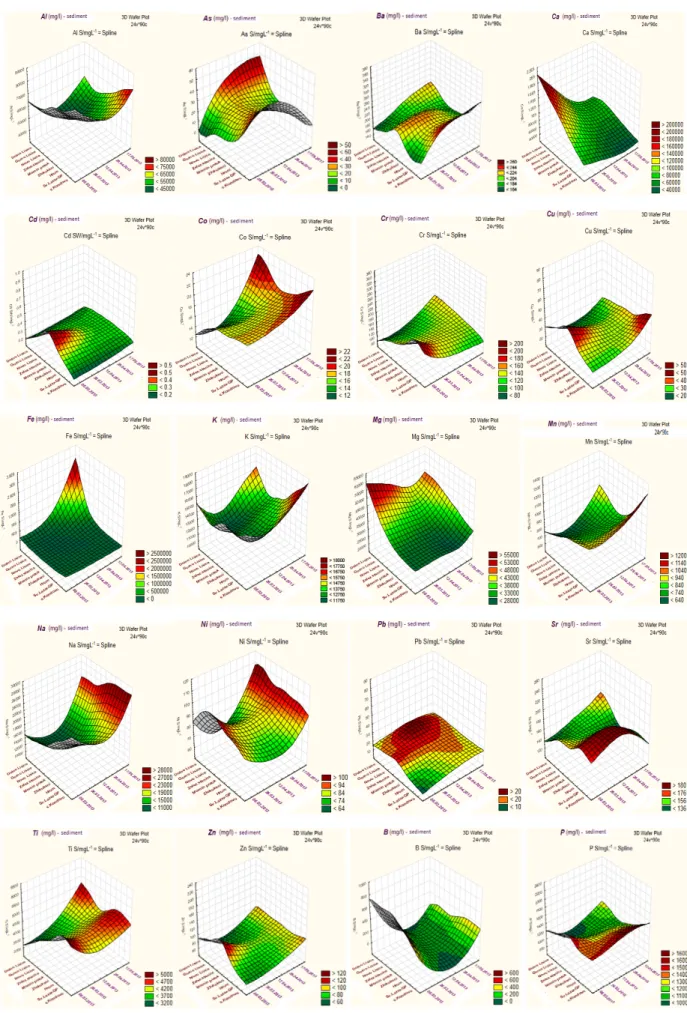
Other physico-chemical parameters
Apart from the content of heavy metals in
wa-ter and sediments of Vardar river, some other
para-meters, such as pH, temperature, turbidity, COD,
alkalinity and organic matter, were also
determi-ned,. The distribution of measured
physical-chemi-cal parameters of the tested waters and sediments
are presented with box&whisker plots for all 5
sampling (Figure 4). Then it is observed elevated
values for turbidity, COD and alkalinity over the
limit for Macedonian MAC values (
Uredba za
klasifikacija na vodite
– Sl. vesnik br.18/99 –
De-cree for classification of waters – Official Gazette
No.18/99), downstream, in the water of the Vardar
river. The content of organic matter in sediments is
in satisfactory frame, compared to a value of
Aus-tralian soil, after which it should be in the range
2.58 to 3.44%. These parameters are important
be-cause of their impact to the forms in which
differ-ent metals can be found in water and sedimdiffer-ents,
their balance and, on the other hand, toxicological
impact of metals depends on these parameters.
Heavy and toxic metals in water and sediments of the River Vardar in Skopje
41
Geologica Macedonica, 29 (1), 25–46 (2015)
Fig. 4. Box & Whisker plots for the distribution of the measured parameters in water and sediments of Vardar river, by the date of sampling
Correlation analysis for heavy metals in relation
to the other examined parameters
The influence of various physico-chemical
parameters on metals in water and sediments can
be analyzed using the correlation matrix for the
parameters and metals. As is evident from the
Ta-ble 5, there is a significant positive correlation
be-tween pH of water present and Mg and Ni-forms in
sediments. The presence of B-forms in water is
positively correlated with the river water turbidity,
in which they are located, and in this respect there
is a relationship between turbidity of river water
and Al in sediments, from the same sampling area,
which is also significantly positively correlated.
Significant, positive correlation exists in the
rela-tionship between the chemical oxygen demand in
river water and Ca, B, Fe and Al from sediments,
and the B, Ca and Mg in the water. There is a
strong link between oxygen and Ca and B, because
their positive correlation exists for forms, in the
waters and also in sediments. Unlike these
ele-ments, which are positively correlated with COD,
Ba from river waters has a significant negative
cor-relation with COD of water.
T a b l e 5
Correlations between parameters of water and metals and some non-metals
in water and sediments of Vardar
Heavy and toxic metals in water and sediments of the River Vardar in Skopje
43
Geologica Macedonica, 29 (1), 25–46 (2015)
Alkalinity of water has the most impact on
present heavy metals in river waters. Affect Al,
Mg,
Ѕ
r, K,
М
n and Na of water, but on the other
hand is significantly negatively correlated to Ti
and As from sediments. Organic matter present in
sediments binds especially
В
a,
С
d, Cu and Zn from
sediments and its presence is greatly influential on
the content of metals in sediments – a high positive
correlation. Organic matter of sediments is
posi-tively correlated to Cu and Mg of river waters. The
only significant negative correlation has organic
matter from the sediments with Ti.
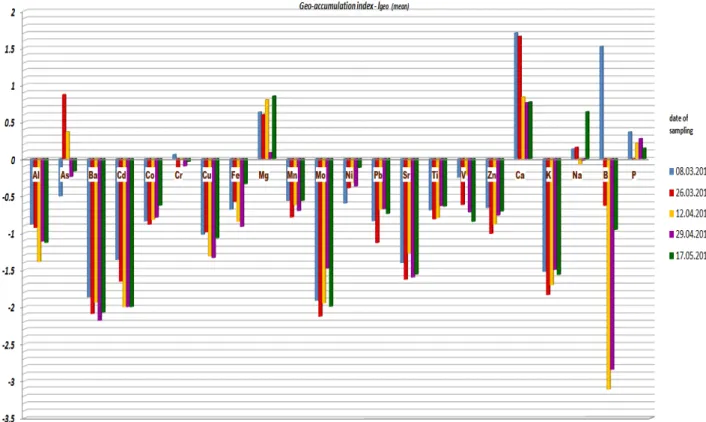
Geo-accumulation index (I
geo)
and enrichment factor (EF)
Geo-accumulation
index – I
geo, proposed by
Müller (1979; Müller & Forstner, 1981), were used
to compare the accumulation of each metal in
sediment fraction. He quantifies individual metals
pollution, and is calculated by formula:
I
geo= log
2[
C
n/ 1.5 ×
B
n],
where
C
n– measured concentration,
B
n– natural
concentration [concentration of geochemical
ori-gin, where, what is taken into account, is average
shale value (Turekian & Wedepohl, 1961) and 1.5
is correlation matrix factor. Depending on the
value of
I
geo(Müller. 1981), proposed several
lev-els of pollution,
I
geo≤
0 uncontaminated, 0 <
I
geo<
1 uncontaminated to moderately contaminated, 1 <
I
geo< 2 moderately contaminated, 2 <
I
geo< 3
mod-erately to heavily contaminated, 3 <
I
geo< 4 heavily
contaminated, 4 <
I
geo< 5 heavily to extremely
contaminated and 5 <
I
geoextremely contaminated.
In this study were considered maximum values
(maximum on all measurement locations) of
indi-vidual metals found in surface sediments of the
Vardar river for the class of
Igeo
Mean values for
Igeo
by date of sampling are presented in the graph
shown in Figure 5.
Fig. 5. Mean values of Geo-accumulation index (Igeo) for the cations in river sediments, by the date of sampling
From aspect of Geo-accumulation index, we
can consider river uncontaminated with: Al, Co,
М
n, Mo,
Ѕ
r, Ti and K, because within research,
through its whole course,
I
geofor these metals have
a value
≤
0. Small to moderate contamination in
terms of
В
a, Cu, Ni, V, Zn and Na, was found.
Contamination with As, Cr, Mg and P is higher,
but moderately. Pollutions with Ca and B are
strongly expressed in Vardar, all the way
down-stream in Skopje, but the most extreme pollution is
with Fe at only one measurement location M9
(Dolno Lisi
č
e), on 17. 5. 2013, which is the result
of incidentally anthropogenic pollution.
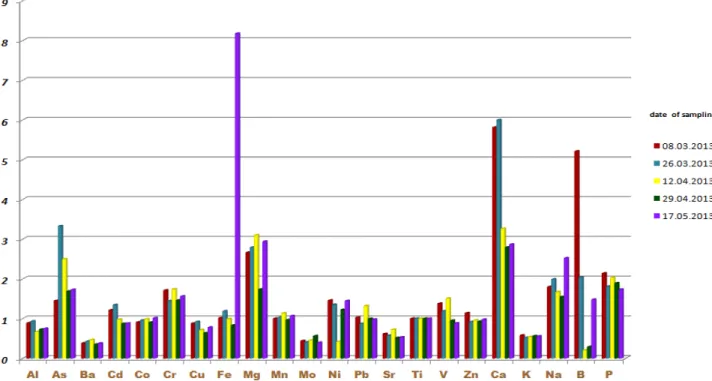
In natural systems, metals, and other
sub-stances appear in the relative proportions in
rela-tion to each other. These proporrela-tions depend on
many processes that make up geochemical cycle of
substances and can be modified as a result of the
input materials, from anthropogenic activities.
En-richment factor (EF) is index which considers the
input of metals – pollutants from anthropogenic
sources. Enrichment factor for each element is
cal-culated by the formula
EF
= [
C
n/
C
ref]
samp./ [
C
n/
C
ref]
backgr.where
C
n sampis the concentration of the element in
the sample, and
C
ref.sampis the concentration of the
reference element, which is taken as a standard for
normalization in the sample.
C
n.backgr.is the natural
concentration [concentration of geochemical
ori-gin, which is taken into account – average shale
value, Turekian & Wedepohl (1961)], of element,
while C
ref backgr.is the natural concentration of
geo-chemical origin – average shale value, Turekian &
Wedepohl (1961) of the reference element. As
ref-erence element can be Fe, Al (the most commonly
used for this purpose), then TI, Si, K, Sr and
oth-ers. The reference element is usually the element
which shows small variations in the presence and
quantity and because of this, in this study as the
reference element is taken Ti. The obtained values
are compared with the EF scale, which determines
the degree of pollution. On this scale if EF<
1,
there is no enrichment in terms of a metal from
anthropogenic sources. With EF< 3, there is minor
enrichment, EF at 3–5 appears moderate
enrich-ment, value of 5–10 has moderate to intense
en-richment and 10–25 intensive enen-richment. Very
intense enrichment EF shows with the values 25–
50, and over 50 extreme, intense enrichment (after
Chen – 2007). Enrichment of Vardar, in the urban
center, for most metals is minor to moderate with
few exceptions, where is no enrichment or where
enrichment is intense and extremely intensive.
Moderate enrichment there is with As, Cd and all
the way with Mg. Intensive enrichment is found
with Ca and B, but the most extreme enrichment
from anthropological source occurs with Fe, with a
value of 60.237 for EF in M9 (Dolno Lisi
č
e), on
17. 5. 2013. More intense enrichment of Vardar is
going on, till 12. 4. 2013, except for the
enrich-ment of Fe, on 17. 5. 2013. There is noticeable and
often greater enrichment with different metals from
anthropological sources in measurement point M5
(Momin Potok). Mean values for Enrichment
fac-tor, by date of sampling are presented in the graph
shown in Figure 6.
Heavy and toxic metals in water and sediments of the River Vardar in Skopje
45
Geologica Macedonica, 29 (1), 25–46 (2015)
CONCLUSIONS
Observing the overall condition of the Vardar
river, compared with the measured values for
heavy and toxic metals in water and sediments, we
can say that the pollution in the Vardar river
hap-pens, incidentally, mostly in small-scale except for
Pb, which throughout downstream and throughout
the duration of the study is somewhat elevated.
This situation is a result of urbanization,
increased
traffic, and untreated industrial water coming into
the Vardar river. Also on the entire course of the
river appears increased content of P and at some
measurement locations, over the content of the V
class waters, suggesting the alarming state with
eutrophication
in the river. The situation should be
greatly enhanced with the planned construction of
water treatment plants, main in v. Trubarevo and
others as they in Saraj and Kondovo. The pollution
of the Vardar river, is more visible in the river
sediments. During the research and measurement
in most locations is noticeably small pollution with
As, Cr, Ni and especially pollution with Fe, from
anthropogenic sources. Pollution of Fe is
particu-larly extreme in the last measurement location
Dolno Lisi
č
e. This pollution is not measured in the
river water, but due to the binding of metals to
sediments, they were found in new, surface
sedi-ments, leading to the conclusion that if only water
of the river is examined, that can not give a true
picture of the state of its pollution. Analysis of I
geoand EF indicate that all these pollution originating
from anthropogenic sources. It is noticeable that in
the Vardar river, the largest pollution coming from
the tributaries Lepenec and especially Serava, who
coming into the measuring locations in M4 and M5
and bring larger quantities of pollutants in Vardar,
as a result of industrial zones and major arable
ag-ricultural land through which they flow. Dilution
of pollution mainly happens with river of Treska`s
flows, because it brings cleaner water to Vardar
river.
REFERENCES
[1] Ahuja, S.& Jespersen, N. (Eds.): Modern Instrumental Analysis, Amsterdam: Elsevier, The Netherlands, 2006. [2] Alfredo K.: The Potential Regulatory Implications of
Strontium, American Water Work Association, 2014. [3] ANZECC (2000): АNZECC/ARMCANZ-2000, Достап
-нона: www.esdat.net.
[4] Boev, B., Lipitkova, S.: Geohemija na sredinata. Uni-verzitet “Goce Delčev”, Štip, 2002.
[5] Boss, C. B., Fredeen, K. J.: Concepts, Instrumentation and Techniques in Inductively Coupled Plasma Optical Emis-sion Spectrometry, The Perkin Elmer Corporation, USA, 1997.
[6] LEAP 2: Skopje Sity, Lokalen akcionen plan za zivotna sredina , Study 2007, Skopje, 2011.
[7] Harvey, D.: Modern Analytical Chemistry, The McGraw Hill Companies, Inc, USA, 2000.
[8] Imran, A., Aboul-Enein, H. Y.: Instrumental Methods in Metal Ion Speciation, Boca Raton: CRC Press-Taylor & Francis Group, USA, 2006.
[9] Mitra Somenath. Sample Preparation Techniques in Ana-lytical Chemistry. New Jersey: John Wiley & Sons,Inc. Hoboken, USA, 2003.
[10] Müller, G., Förstner, U.: Concentrations of Heavy Metals and Polycyclic Aromatic Hydrocarbons in River
Sedi-ments: Geochemical Background, Man's Influence and Environmental Impact.Geojournal, 5, 5, 417–432 (1981). [11] Müller, G.: Schwermetalle in den Sedimenten des Rheins
– Veränderungen seit 1971, In: Müller, G.: Schadstoffe in Sedimenten – Sedimente als Schadstoffe, 1979, Umwelt-geolo gie, Band, 79, S. 107–126 (1986).
[12] Skougstadt, M. W., Horr, C. A.: Occurrence of Strontium in Natural Water. Geological Survey, Circular 420, 1960. [13] MZSPRM. Godishen izveshtaj za obraboteni podatoci za
Kvalitet na zivotna sredina vo RM za 2006 (2006). [14] MZRM: Pravilnik za bezbednost na vodite.Sluzben
ves-nik br. бр. 46/08 (2008). [15] The New Dutchlist. Достапнона:
http://www.contaminatedland.co.uk std-guid/dutch-l.htm
[16] Turekian, K. K., & Wedepohl, D. H. Distribution of the elements in some major units of the earth`s crust. Bulletin
Geological Society of America, 72, 175–192 (1961).
[17] VRM: Uredba za klasifikacija na vodite. Sluzben vesnik br. бр.18/99 (1999).
[18] Van de Wiel, H. J. Determination of elements by ICP-AES and ICP-MS, Bilthoven: National Instutute of Public Health and the Environment (RIVM), The Netherlands (2003).