Robust Sensor Fusion in Real Maritime Surveillance
Scenarios
Jesús García
GIAA, University Carlos
III of Madrid
Madrid, Spain
jgherrer@inf.uc3m.es
José Luis Guerrero
GIAA, University Carlos
III of Madrid
Madrid, Spain
jguerrer@inf.uc3m.es
Alvaro Luis
GIAA, University Carlos
III of Madrid
Madrid, Spain
aluis@inf.uc3m.es
José M. Molina
GIAA, University Carlos
III of Madrid
Madrid, Spain
molina@ia.uc3m.es
Abstract – This paper presents the design and evaluation of a sensor fusion system for maritime surveillance. The system must exploit the complementary AIS-radar sensing technologies to synthesize a reliable surveillance picture using a highly efficient implementation to operate in dense scenarios. The paper highlights the realistic effects taken into account for robust data combination and system scalability.
Keywords: Maritime surveillance, AIS-radar sensor fusion, data association, real time performance
1
Introduction
Maritime traffic surveillance has become an important research area as the security requirements in ports and coastal navigation have received more attention, affecting to global maritime transport operations. This research is mainly promoted by state agencies, for instance we can mention NATO support to research on Maritime Surveillance [1], and national programs like Hawkeye [2] or Centurion [3] projects at United States to prevent threats in ports the CanCoastWatch [4] project in support of the Canadian Forces.etc.
In order to reach the required level of quality in maritime surveillance, it is necessary the use of a heterogeneous network of sensors and a global multi-sensor tracking and fusion infrastructure capable of processing the data. There are varied technologies for detection and location of objects (coastal radar, video cameras, IR, automatic identification system, etc), but none of them is usually able on its own to ensure reliable surveillance for handling complex scenarios (due to the specific effects of each technology as transitional loss of availability, errors, limits of coverage, etc.).
For example, high resolution coastal radar technology is effective with high accuracy and availability, but usually presents difficulties (occlusions, shadows, fragmentation, lack of identification) which make it necessary to supplement them with cooperative location technologies such as AIS. On the other hand, cooperative systems are insufficient on their own, because of potential anomalous data, losses in coverage or presence of hostile objects.
Research of appropriate architectures and algorithms for multi-sensor fusion in this environment is needed. The fusion problem manifests itself especially to cover large and heterogeneous areas such as high density spaces with presence of numerous objects in motion. The surveillance of such large volumes (both in terms of surface and simultaneous objects) requires the employment sensor networks. An important phase of analysis and adjustment of the system is usually necessary to refine the models and raise robust processes to ensure the reliability of the system in real conditions such as presence of measures inconsistent, malfunction of sensors, dynamic behaviors, variation of parameters, etc. Models adjustment process goes through studies of real effects on the sensor fusion algorithms.
This paper presents design aspects and some experimental analysis developed in an applied project intended to demonstrate fusion technologies in this environment through a operative prototype. Some real elements such as modeling the sensor errors present in the environment (including the presence of anomalous data), the lack of regular update rate of AIS, alignment errors between the measured speed and projected in the fusion system speed, etc., require specific solutions, and the appropriate architecture to deal with the specific problems of each technology. An important aspect is the efficiency, the algorithms with highest computation load were pointed and optimized to allow acceptable performance in real time. Finally, the use of contextual information enabled the adjustment and development of heuristics that maximize the ability to adapt the fusion techniques to operating conditions.
2
Maritime surveillance and performance
specifications
The sensor fusion system designed for maritime surveillance exploits the complementary AIS+radar sensing technologies to synthesize the surveillance picture. Both kind of sensors provide different information about the vessels detected, and have different update periods. The information used by our architecture for each sensor is
briefly described in this section, along with the expected system output.
The data provided by radar sensor consists in the polar coordinates of the detected vessel. Usually, coastal radars in this domain perform a circular scan with an update period that varies from 3 to 4 seconds.
The Automatic Identification System (AIS) [8]. AIS is a short range coastal tracking system used on ships and by Vessel Traffic Services (VTS) [9] for identifying and locating vessels by electronically exchanging data with other nearby ships and VTS stations.
AIS stations can provide more information about each vessel than radar sensors, such as unique identification, type of vessel, location, course, speed, name of the vessel, destination, etc. The input to our system regarding AIS measurements includes the following components: Maritime Mobile Service Identity (MMSI), a unique nine digit identification number, the timestamp, the location of the vessel in the WGS84 coordinate system, the location accuracy, the speed over ground (SOG), and the course over ground (COG) fields.
An AIS transceiver installed in a vessel sends this information depending on its speed, within 2 to 10 seconds in case it is underway, or every 3 minutes while vessel is anchored.
The architecture proposed must process both information sources to finally provide a single fused output for each
vessel. The system output consists in a set of non redundant tracks, called global tracks. Each global track is composed of the following information: Global track id, a unique identifier for each track; a flag that indicates if the track has been updated in the last fusion cycle; predict instant (timestamp); geodesic location of the vessel in WGS84 coordinates; speed over ground; and finally, the course over ground;
In order to facilitate debugging processes, additional information is attached to the systems output, such as sensor identifiers which have contributed to generate the global track; the MMSI, whether the track includes AIS information or not, etc.
In terms of performance, the system should be capable of manage at least 2000 targets (vessels and small boats) from 10 sensors (AIS and radar sensors). The refresh period of the information must be 1 second.
3
Sensor fusion design for critical specifications
3.1
Decentralized architecture
The processing algorithms can be organized in different fusion architectures. The solution proposed for this particular system consists in a decentralized architecture so that the fusion process can be divided in two separate levels.
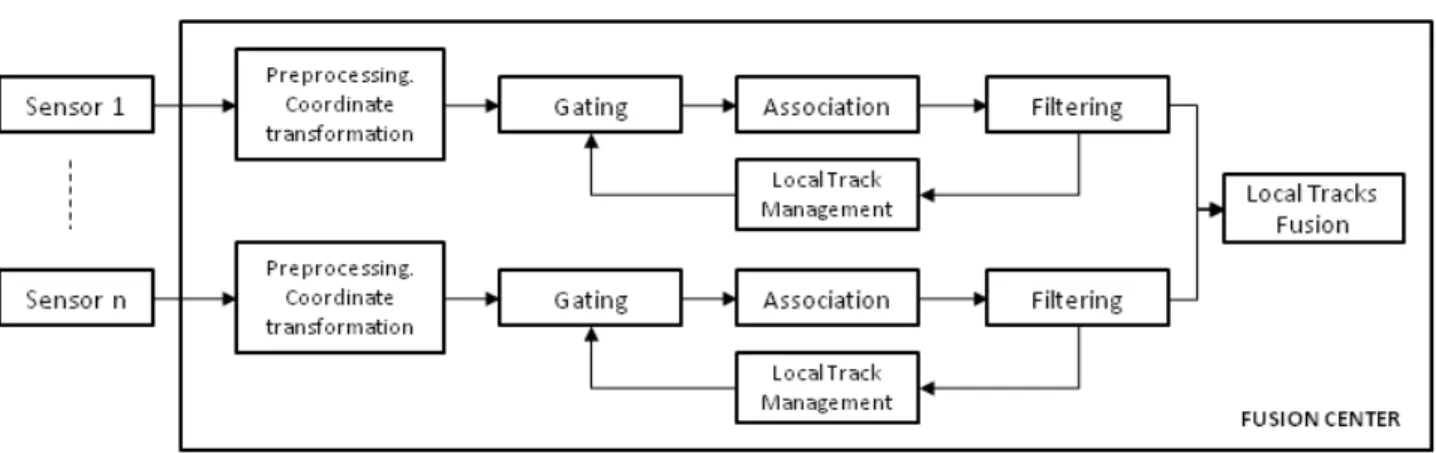
Figure 1: Local processing overview The first level is associated with the local sensor
processing, each sensor is the responsible of process it own plots and provide a list of local tracks. The second level fuses the local tracks and provides a set of non redundant global tracks, as the final output of the system. The proposed local processing architecture is outlined in figure 1. Once all the plots of one data acquisition cycle are pre-processed, gating, association and filtering processes over the existing local tracks in the system are applied. The local track management process is responsible of creating new tentative tracks, updating current tracks with new associated plots, and applying
deletion criterion for those local tracks which reach some threshold regarding their lack of updates.
The main advantage of this architecture resides in the distributed data processing which lets each processing adjusts to the particularities of each sensor. This advantage is highlighted in this particular system, where AIS and radar sensors are used. In this way can be defined particular processing algorithms for each sensor type. Another advantage of a decentralized architecture could be a distributed processing load, with one processor associated by sensor, avoiding the overload of a single main processor.
Further details of algorithms employed in the architecture are explained in the following sections, highlighting some efficiency aspects for real-time environments.
3.2
AIS-Radar common referencing
The selected global coordinate frame is the local tangent plane centered at fusion centre location (FUS) with axes oriented to East (X), North (Y) and Up (Z), known as ENU system. The two sensor sources considered are AIS, providing global positions and velocities, and coastal radar surveillance, with relative position measurements with respect to the radar station.
Figure 2. Global coordinates centered at fusion location In the case of AIS, it provides global position expressed in WGS-84 (geodetic latitude, longitude, height), and velocity expressed in the local Cartesian frame at vehicle position (different to the fusion frame, centered in other reference tangential point). Therefore, it is needed the set of coordinate transformation primitives to transform all measurements to the fusion frame, and also to express the navigation output in WGS-84 coordinates. Measurements provided by AIS are transformed to local plane to be fused with other available sensor data, using as intermediate system the ECEF frame. In the first place, the geodetic position is expressed in ECEF coordinates,
(xECEF, yECEF, zECEF) = geodetic2ecef(lat, lon, h) (1)
and then the ENU local coordinates computed, taking the reference position of fusion center, (latFUS, lonFUS, hFUS):
(xl, yl, zl) =
ecef2lcar((xECEF, yECEF, zECEF), (latFUS, lonFUS, hFUS)) (2)
The velocity, expressed in local Cartesian coordinates centered at ship position (v’x, v’y, 0), is translated to ENU
frame centered at the fusion origin:
G=cartRotation ((lat, lon, h), (latFUS, lonFUS, hFUS))
(vxl, vyl, vzl)t=G(v’x, v’y, 0)t (3)
Radar measurements are expressed first in its local plane centred at (latR, lonR, hR) and then aligned with fusion
coordinates. Assuming available measurements (r,θ), with associated standard deviations σr, σθ, and vessel located on
surface of geoid, the coordinates are obtained computing the equivalent earth radium considering the WGS-84 eccentricity, ecc:
.
Figure 3. Local radar coordinates
(
)
(
)
2 1 R 2 2 2 2 1 R 2 2 max G ) (lat sin ecc ) 2 ecc ( 1.0 ) (lat sin ecc -1.0 R R − + = (4) Then, horizontal distance and vertical height on local plane are obtained with geometric reasoning:(
)
) h 2(R h R 2 R h z h R 2 ) r R h 2 h ( r D R E R E 2 E 2 R loc 2 R 2 R 2 R 2 + + + − = ⎟⎟ ⎠ ⎞ ⎜⎜ ⎝ ⎛ + + + − = (5) So the cartesian coordinates are (Dsin(θ), Dcos(θ), zloc),with associated covariance
⎥ ⎥ ⎥ ⎦ ⎤ ⎢ ⎢ ⎢ ⎣ ⎡ σ σ = ⎥ ⎥ ⎥ ⎥ ⎥ ⎦ ⎤ ⎢ ⎢ ⎢ ⎢ ⎢ ⎣ ⎡ − = = θ 0 0 0 0 0 0 0 R ; 0 0 0 0 x D y 0 y D x G G R G R 2 2 R o LOC LOC LOC LOC t o LOC (6) And the appropriate inverse transformation to obtain its ECEF and then ENU coordinates at fusión center.
3.3
Contextual information
The contextual information is added as configuration information to increase system efficiency and robustness. It contains geographic areas, each defining dynamic constraints such as maximum speed, maneuvers, track
East xl hR r North yl -D RG RG Up zl
initialization and erase capability, etc. To do that, a map based on polygons is used to define the different areas using absolute coordinates (WGS84) with associated characteristics and parameters.
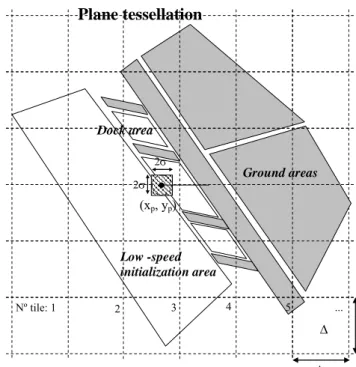
Then, the localization of any position in the scene is shared by all processes with geographical configuration for masks or parameters. Any location (xp, yp) is searched in the different elements in the map, using a tessellation for efficiency (see figure 4). Only the map elements linked to the position tile are used to check target belonging (considering its uncertainty as a circular area).
Δ Δ
Plane tessellation
Nº tile: 1 2 3 4 5 ... Dock area Low -speed initialization area Ground areas 2σ (xp, yp) 2σFigure 4. Representation of map elements and location Given a certain position to check, (xp,yp), the index of corresponding tile is determined, and then all elements linked with that tile are tried, to check if the position is within the polygon or if the uncertainty circle overlaps with it.
3.4
Data Association and track
management
The purpose of this section is to overview the different processes performed by the fusion system, both locally and at the global fusion center. This does not include a very detailed description of every process included, especially for those highly standardized, but specifications of those particular to the application domain and the highlight of the different approximations and efficiency modifications introduced. Regarding these issues, it is especially important to remark the local processing approximations, since their impact on the overall performance and scalability of the system is greater than those performed in the global fusion center.
3.4.1
Local processing
According to the decentralized architecture explained in previous sections, each sensor processes its own plots locally, previous to submitting them to the global fusion center in order to process the system’s final tracks. The overview of this local processing is shown in figure 5:
Figure 5: Local processing overview
The cycle plots acquisition requires a careful processing of the received plots, since the system is subject to net errors and/or delays (this treatment is especially important for the AIS plots). This process must deal with AIS’s repeated ID messages for the actual cycle (due to system broadcasted messages which may be received more than once) and plots with delayed timestamps (where the basic system behavior is their deletion, not being incorporated to the fuser usual cycle). As the reader can see in figure 5, the gating / association processes are carried out in different ways, depending on the particular sensor. AIS sensors perform a treatment based only on their ID, in order to release the computational load which the system is exposed to.
The general gating process is reported to be, in most of the available literature, numerically intensive and inherently time consuming [7]. The approach implemented in the system relies on simplifying ideas such as not calculating the full probability of the association and the application of successive gatings, in order to reduce the number of required calculations. The basic radar gating algorithm is based on two steps: first of all, a temporal gating is applied, imposing the plot timestamp to be within a certain user time range from the track’s own timestamp. This temporal gating allows gating for tentative tracks (which, not having initialized their filter, cannot be predicted to future plots’ timestamps). On the other hand, for confirmed tracks timestamp checks are computationally cheap compared to the spatial gating. The spatial gating for radar sensors is based on the application of the Euclidean distance between new sensor plots and the local tracks contained in the sensor, followed by thresholding with user defined K constants (which may be different on the different axis), determining whether the association between the given plot and track is possible
gating t t
t t (1)
Cycle plots
acquisition
Temporal Spatial Association
Unassociated plots Local track / plot associations Deletion checks Local tracks creation Local tracks update Gating Plot ttype ID Match radar AIS
If this gating test is passed, the Mahalanobis distance between the track and the plot is calculated and introduced in the distance matrix which the association algorithm (based on the Munkres algorithm [5]). If these gating conditions are not satisfied, an infinite values is introduce in the distance matrix
t T σ σ p t 2
The gating test applied in (1) required the prediction of the track’s estate to the plot’s timestamp. This is based on the track’s associated filter. Given the computational requirements of the system and the low speed, along with smooth transitions, which the objective domain exhibits, the chosen filter was a common Kalman Filter. The prediction step equations of this filter are:
| 1 1 (3)
| 1 1 (4)
With n previously confirmed tracks and m sensor plots to process, the complexity of the spatial gating would be (n*m*Kalmanpred). This complexity is reduced by the
temporal gating process, which reduces the number of plots which the tracks have to be predicted to, but is nevertheless an important boundary for the scalability of the system. To resolve this issue, the system introduced an approximated gating prediction: instead of predicting every track to every new plot timestamp, all the tracks are predicted to the middle timestamp value of the cycle, and compared to the different plots according to that position. This allows the reduced complexity order to be (n*Kalmanpred)
The deletion checks are based on different parameters for each plot type. Radar tracks are deleted after a certain number of system cycles have elapsed without updates. AIS plots are not received at constant rates, depending their receiving rate on a sort of different parameters, such as velocity or state. Thus, the deletion criterion cannot be based on a number of system cycles. Instead, the deletion criterion is fixed regarding the maximum rate which they exhibit (the one given by anchored targets), usually around three minutes. This introduces a high inertia in the system when an AIS track is deleted which must be handled carefully.
Being efficiency and scalability some of the design keys for the system, there are also deletion considerations regarding the actual implementation of the system (basically the handling of the different information associations in the system and the deletion order not to cause incongruities between the local sensors and the global fuser information). These processes involve low-level object-oriented and programming details, so, even given their importance, we will not focus on them.
3.4.2
Global processing
The system’s global fuser, along with the actual fusion of the local tracks and the generation of the system’s final output, has to deal with the possible issues created by the simple local processing. These issues include the possible needs for recombination of global tracks and/or the division of different local tracks previously included in a single global one (being these processes especially relevant during the system startup). Figure 6 shows the system’s global processing overview
Figure 6: Global processing overview
Some of the processes shown in figure 6 are not run at every fusion cycle. Particularly, the redundancy and inconsistency checks are only run at a given rate, being this rate different for each of them. These processes are important for the scalability of the system, since they introduce peaks in the computational load in the cycles when they are run.
The processing run at every cycle cover the detection of empty global tracks (due to the local deletion of their last local track), which are eliminated from the system, and the acquisition and processing of new and updated local tracks. Previously fused local tracks launch an update of their associated global tracks. This process implies the prediction of every local track contained by that global track to the highest timestamp value of its contained local ones, followed by a least squares fusion [4] of these states:
∑ ∑ (5)
These equations assume uncorrelated local tracks, but the system has overlapping AIS sensors, leading to an underestimation of the estimated error if the equation is applied directly. In fact, the different local tracks for a single AIS target have exactly the same information (this data is broadcasted from the ship to all the different local sensors) and thus, we are reprocessing it several times in the global track. To prevent this behavior, global tracks
Local processing Inconsistency check Redundancy check Empty global tracks check Splitting process Global tracks fusing process Global track deletion Updated local tracks acquisition Previously associated local tracks New local tracks Gating Association Global track creation Global track update Local to Global track fusion
associated with several AIS local ones will only consider one of them for this process.
After this fusion has taken place, the resultant and matrices are stored for the required global track’s predictions (for example, during the global gating process, which will be explained afterwards). This procedure is computationally less demanding than the prediction and fusion of all the contained local tracks performed when the global track is updated.
New local tracks go through similar gating and association processes to the ones shown in local sensors. In this case there are no tentative global tracks and no temporal gating can be performed, so the gating process relies on kinematic state checks. These checks would require all the global tracks to be predicted to every new local track, so a similar approximation to the local one presented in the previous section is performed: every global track is predicted to the middle timestamp of the cycle and the gating is performed according to those positions. For these gating we will resort to the Mahalanobis distance, setting individual thresholds for position and velocity distances (according, once again, to user’s requirements). New unassigned local tracks create new global tracks, initializing their associated filter with the one associated to the local track
A inconsistency check process determines whether all the local tracks contained in a global track are mutually consistent or not. In order to do this, for every possible pair combinations of the local tracks contained in a global one, the local track with the lowest timestamp is predicted to its paired one, and the Mahalanobis distance is calculated. If its value exceeds a certain user defined consistency error, both tracks add an inconsistency detection to their inconsistencies summation. After all the possible pairings have been processed, the track with the highest number of inconsistencies is expulsed from the global track, being introduced as a new local track the next time it is updated. Velocity and position, due to client’s requirements, are considered separately in order to set different integrity thresholds for both of them. If any of these thresholds is surpassed, the paired tracks add an inconsistency detection.
Redundancy checks are the complementary process to the inconsistency checking. The objective of this process is to determine whether two different global tracks are, in fact, the same one, and their respective local tracks should be fused into a single global track. This implies computing distances for every possible pair of global tracks and determining whether they should be fused based on a user defined recombination threshold. There are additional criteria which must be met in order to fuse two different global tracks, basically based on the compatibility of their local tracks, such that a fused global track will never have two different local tracks originated by the same local sensor. Another issue related to this fusion is that more than a global track may have more than one feasible candidate to fuse with, and all these fusions may take place in the same cycle, but the different candidates must
be compatible among themselves in order to fuse them all into the same global track. Finally, some of this checks can be avoided in order to reduce the computational complexity of this processing, by means of a distance threshold. If two global tracks (without the proper state prediction) are separated more than a certain user defined distance, they are considered incompatible automatically, preventing the required prediction and subsequent checks.
4
Experimental analysis
4.1
System demonstrator
A demonstration tool has been developed for analysis of system performance. It was used to test and set the parameters of the fusion system with a several representative situations, both simulated and with recorded real data. Besides, “mixed” scenarios were also tested making use of simulator capability to generate radar data synchronously superimposed with live-recorded AIS data. The simulation was done to evaluate system output in realistic operations with the dynamics and sensor characteristics. The simulation tool allows definition of target trajectories and sensor errors.
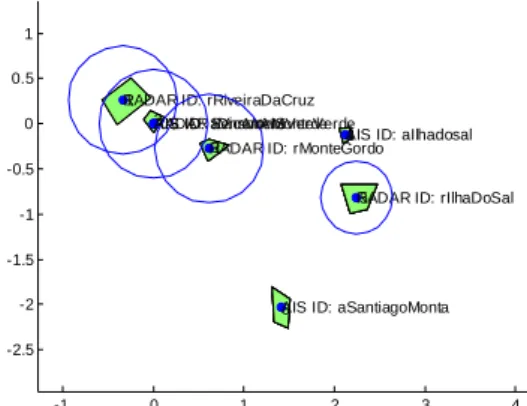
The main goal of evaluation was to test the stability and continuity of system output, coherence from different sensors and capacity to handle an important number of targets in real time. The system was evaluated in different representative scenarios to illustrate its properties. A simulation was done taking configuration values of a certain scenario, the Cape Verde islands, with seven available sensors (4 radars and 3 AIS stations). Next figure shows the simulated areas and sensor coverage, with green geographic areas for the main islands.
Figure 7. Simulated scenario and sensors
Next figure shows a simulated scenario with four targets moving in the border of coverage and developing Sharp maneuvers and crossing themselves, as the figure below shows, with a minimum distance of 300 meters.
-1 0 1 2 3 4 x 10⁵ -2.5 -2 -1.5 -1 -0.5 0 0.5 1 x 10⁵ 1 1 2 1 2 3 1234 1 2 3 4 5 1 2 3 4 5 6 RADAR ID: rRiveiraDaCruz
RADAR ID: rMonteVerde RADAR ID: rMonteGordo
RADAR ID: rIlhaDoSal AIS ID: aVicenteMonteVerde
AIS ID: aIlhadosal
AIS ID: aSantiagoMonta AIS ID: SensorAIS
Figure 8. Simulated scenario with four trajectories
4.2
Tracking accuracy and continuity
The system validation was performed at different levels, regarding the correct performance of the included mechanisms, the effect of the approximations included (both over the capacity of the system and over its accuracy) and typical scenarios (both real and simulated). This section cannot cover thoroughly all the different performed tests, especially those including situations where there are a high number of simultaneous targets (which, in the capacity tests, reached a number of over two thousand targets) due to space and visibility restrictions. We will show illustrative situations regarding some of the explained mechanisms introduced instead, in order to demonstrate the viability of them and the approximations introduced.
Figure 9 shows a typical example of different ships performing intersecting trajectories. This figure tries to show the continuity of the created global tracks, while the targets cross different radar range zones (thus causing local tracks to be created and deleted) and how these local tracks are correctly associated to their plots and fused into global tracks. The square markers determine the trajectory creation, while the triangles determine the trajectory deletion
Figure 10: Intersecting trajectories example
The following figures try to show a visual validation of unitary tests on the correction algorithms introduced in the global fuser. Figure 11 shows a verification for the inconsistency checks, where initially two sensors are following the same target (global track 1), followed by a simulated malfunction in one of them introducing a certain bias, which will cause its local track to be considered inconsistent, expulsed and create a new different global track (global track 2):
Figure 11: Inconsistency mechanism example Figure 12 shows five different initial global tracks which align their velocities as new plots are received and get their positions closer, determining the algorithm to fuse them into a single global track, which continues until the end of the scenario.
Figure 12: Redundancy mechanism example
4.3
Real-time performance
The real time performance tests were centered in the continuity and stability of the tracks, along with the determination of the limits in number of simultaneous targets (determined by the time threshold included in the specifications, one second for the whole local and global processing). The hardware used for these tests was considerably less powerful than the server where the system would work, in order to obtain some worst case situations of the possible performance over the real hardware. -4 -2 0 2 4 6 8 10 x 104 -6 -4 -2 0 2 4 x 10⁴ 1 1 2 1 2 3 RADAR ID: rRiveiraDaCruz
RADAR ID: rMonteVerde
RADAR ID: rMonteGordo AIS ID: aVicenteMonteVerde
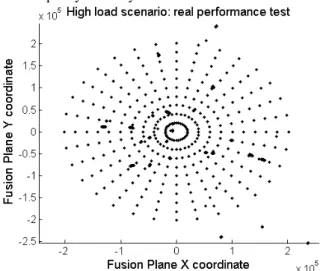
Figure 13 shows a performance test under high target density conditions. To perform this test, real data from the system sensors was recorded, adding afterwards a certain number of fixed targets, to validate the continuity of the obtained tracks (especially for the real targets) and the overall capacity of the system.
Figure 13: High density scenario performance test Figure 14 was recorded using a scenario where the number of simultaneous targets was sequentially increased, until the overall system time (presented in milliseconds) for the fusion processing exceeded the fixed restriction of one second. The purpose of this test was to determine the system scalability limits with the given hardware in terms of simultaneous local and global tracks. The distribution of the plots (according to their source sensor) affects these results (as the local processing is less computationally demanding for AIS sensor), but no detailed description is given, as this figure tries to give an overall orientation of the system boundaries.
Figure 14: System scalability test
5
Conclusion
An analysis and assessment of fusion architecture and algorithms for maritime surveillance domain have been carried out with simulated and recorded data. The main findings are: (i) the proposal has the ability to deliver tracks with continuity and precision acceptable in representative situations (sharp maneuvers with
trajectories crossing at short distances); (ii) the decentralized solution maintains local tracks with satisfactory performance, and the result is improved later in the process of fusion estimated global tracks, such as radar coverage transitions on the global tracks. (iii) the logic of global tracks management has the behavior expected to increase robustness, applying process initialization, recombination, de-fusion and removal as being expected. The fusion algorithms were implemented taking special concern of efficiency to carry out the processing of data in real time accordingly to requirements.
Acknowledgement
This work was supported in part by a national project with NUCLEO CC, and research projects CICYT TEC2008-06732-C02-02/TEC, CICYT TIN2008-06742-C02-02/TSI, SINPROB, CAM CONTEXTS S2009/TIC-1485 and DPS2008-07029-C02-02
References
[1] M. Guerriero, P. Willett, S. Coraluppi and C. Carthel, “Radar/AIS Data Fusion and SAR Tasking for Maritime Surveillance" Proceedings of FUSION 2008, Cologne Germany, July 2008.
[2] Michael Seibert*, Bradley J. Rhodes, Neil A. Bomberger, Patricia O. Beane, Jason J. Sroka, “SeeCoast port surveillance”. Proceedings of SPIE Vol. 6204: Photonics for Port and Harbor Security II. Orlando, FL, USA, 18–19 April, 2006.
[3] Bick, E.T. Barock, R.T. “CENTURION Harbor Surveillance Test Bed”. Proceedings of MTS/IEEE OCEANS, 2005. 17-23 Sept. 2005.
[4] Wehn, Y., Yates, R., Valin, P., Guitouni, A., Bossé E., Dlugan, A., and Zwick, H. “A Distributed Information Fusion Testbed for Coastal Surveillance”, Proceedings of 10th Annual Conference on Information Fusion, Quebec, Canada, 2007.
[5] Munkres, J. "Algorithms for the Assignment and Transportation Problems", Journal of the Society for Industrial and Applied Mathematics, 5(1):32–38, 1957 [6] Groves, P. D. “Principles of GNSS, Inertial, and Multisensor Integrated Navigation Systems”. Artech House, 2008
[7] Uhlmann, J.K. “Introduction to the Algorithms of Data Association in Multiple-Target Tracking” In Handbook of Multisensor Data Fusion. Second edition, CRC Press, 2009.
[8] Harre, I. “AIS adding new quality to VTS systems”, The Journal of Navigation. Cambridge Univ Press, 2000. Volume 03-53, Pages 527-539.
[9] Guard, C.C “Vessel Traffic Services (VTS) update study”, Ottawa, OM: Canadian Coast Guard, Marine Navigation Services”, 1991. Volume 159.
0 200 400 600 800 1000 1200 0 500 1000 1500 2000 2500 3000 3500 4000 Number of tracks