PROJECT MANAGEMENT SOFTWARE SYSTEMS
Requirements, Selection Process and Products (6
thedition)
Mey Mark Meyer, Frederik Ahlemann
ISBN-13: 978-3-942201-20-9 Release Version: 2010-12
Preface
In-depth analysis of project management software
This report is the complete guide to a successful project management (PM) software selection program. It provides an in-depth look at the current state of the market and technologies in the PM software sector. The authors have tested and evaluated the soft-ware solutions with a high degree of detail. The report was independently written and is in no way sponsored or influenced by software vendors: advisors from the vendors merely supported the authors to gain a basic understanding of the tools’ individual char-acteristics. Products were chosen and evaluated according to transparent criteria. This report also contains helpful hints on the selection and introduction of project man-agement software, as well as substantiated approaches to project manman-agement in gen-eral. The combination of an academic approach and practical hints based on the au-thors’ project experience make this report unique. And by providing the product assess-ments on-line, it is ensured that readers can get access to updates and new releases quickly and easily.
I strongly recommend this work to anyone seriously involved with project management software.
Dr. Thor M ¨oller
Member of the Executive Committee
GPM Deutsche Gesellschaft f ¨ur Projektmanagement e.V.
Contents
I.
An Introduction to Project Management Software
1
1. How to work with this report 3
2. The Product Selection Process 7
2.1. Structured Approach – A Process Model . . . 7
2.2. Defining the Situation and Formulating Requirements . . . 8
2.3. Selection of Appropriate Potential Products . . . 10
2.4. Deciding on a Product & Supplier . . . 11
2.5. Success Factors . . . 12
3. Implementing Project Management Software 15 3.1. Piloting the Software . . . 15
3.2. Roll-Out Concept . . . 16
3.3. Qualification and Training . . . 16
3.4. User Support and Specialized Coaching . . . 17
3.5. Integrating PM software into existing software systems . . . 18
3.6. Ongoing Improvement . . . 19
3.7. Management Support . . . 20
4. Architectures and Technologies 21 4.1. Software Architectures . . . 21
4.2. Configuration . . . 23
4.3. Enterprise Application Integration . . . 24
4.4. Security . . . 25
5. Project Management Software Maturity 27 5.1. Single-Project Management Systems . . . 29
5.2. Multi-Project Management Systems . . . 29
5.3. Enterprise Project Management Systems . . . 32
5.4. Performance-oriented Project Management Systems . . . 32
5.5. Knowledge-oriented Project Management Systems . . . 33
6. The M-Model as a Frame of Reference 35 6.1. The M-Model . . . 35
6.2. Areas of Interest . . . 37
7. Project Management Software Functionality 41 7.1. Idea Generation / Lead Mgmt. . . 41
7.1.1. Creativity Techniques . . . 41
7.1.2. Idea / Project Classification . . . 41
7.1.3. Lead Management . . . 42
7.1.4. Project Status/Project Process Management . . . 43
7.2. Idea Evaluation . . . 43
7.2.1. Estimation of Effort . . . 44
7.2.2. Resource Needs Specification . . . 45
7.2.3. Risk Estimation . . . 46
7.2.4. Profitability Analysis . . . 46
7.2.5. Project Budgeting . . . 47
7.2.6. Offer Management . . . 48
7.3. Portfolio Planning . . . 49
7.3.1. Organizational Budgeting . . . 49
7.3.2. Project Assessment . . . 50
7.3.3. Project Portfolio Optimization . . . 50
7.3.4. Project Portfolio Configuration . . . 51
7.4. Program Planning . . . 52
7.4.1. Project Templates . . . 52
7.4.2. Resource Master Data . . . 53
7.4.3. Resource Assignment Workflow . . . 54
7.4.4. Resource Allocation . . . 54
7.5. Project Planning . . . 54
7.5.1. Work Breakdown Structure Planning . . . 54
7.5.2. Scope / Product Planning . . . 55
7.5.3. Network Planning . . . 55 7.5.4. Scheduling . . . 56 7.5.5. Resource Leveling . . . 57 7.5.6. Risk Planning . . . 58 7.5.7. Cost Planning . . . 59 7.6. Project Controlling . . . 59
7.6.1. Change Request Management . . . 59
7.6.2. (Travel) Expense Management . . . 59
7.6.3. Timesheet . . . 60
7.6.4. Cost Controlling . . . 60
7.6.5. Meeting Support . . . 61
7.7. Program Controlling . . . 61
7.7.1. Status Reporting . . . 62
7.7.2. Deviation Analysis / Earned Value . . . 62
7.7.3. Quality Controlling . . . 63 7.7.4. Versioning . . . 63 7.7.5. Milestone Controlling . . . 64 7.8. Portfolio Controlling . . . 64 7.8.1. Performance Measurement . . . 64 7.8.2. Dashboard . . . 65
7.8.3. Organizational Budget Controlling . . . 66
7.9. Program Termination . . . 66
7.9.1. Knowledge Portal . . . 67
7.9.2. Competence Database/Yellow Pages . . . 67
7.9.3. Project Archiving . . . 67
7.9.4. Searching . . . 68
7.10.Project Termination . . . 69
7.10.1. Invoicing . . . 69
7.10.2. Document Management . . . 69
7.10.3. Supplier and Claim Management . . . 70
7.11.Administration / Configuration . . . 71
7.11.1. Workflow Management . . . 71
7.11.2. Access Control . . . 71
7.11.3. Report Development . . . 72
7.11.4. Form Development . . . 72
7.11.5. User-defined Data Structures . . . 72
7.11.6. Microsoft Office Project Interface . . . 73
7.11.7. Application Programming Interface . . . 73
7.11.8. Offline Usage . . . 74
II. Market Overview
75
8. Research Design 77 8.1. Selection of Systems and Research Process . . . 778.2. Derivation of Evaluation Criteria . . . 77
8.3. Evaluation of Systems . . . 78
8.4. Aggregation of the Assessment Results . . . 78
8.5. Structure of the Product Descriptions . . . 79
9. Product Assessments 81 9.1. 3pleP Project Suite . . . 82
9.2. ACOS PM Software . . . 92 9.3. aXcelerate . . . 102 9.4. Blue Ant . . . 112 9.5. CA PPM Clarity . . . 122 9.6. Cat4 . . . 132 9.7. Changepoint . . . 142
9.8. Deltek Project Suite . . . 152
9.9. HP Project and Portfolio Management (PPM) Center . . . 162
9.10.iPlan . . . 174
9.11.KLUSA . . . 184
9.12.Microsoft Project Server 2010 . . . 194
9.13.Oracle Primavera P6 Enterprise Project Portfolio Management . . . 204
9.14.PAVONE Project Management . . . 214
9.15.Planisware 5 . . . 224 9.16.PLANTA Project . . . 234 9.17.Planview Enterprise . . . 246 9.18.Projectile . . . 256 9.19.Projektron BCS . . . 266 9.20.PSNext . . . 276 9.21.resSolution . . . 286 9.22.RPlan . . . 296
9.23.SAP Business Suite 7 (ERP 6.0 Enhancement Package 4), SAP RPM 4.5, SAP cProjects 4.5 . . . 306
9.24.Top-Logic Project . . . 316
10. Product Comparison 327 10.1.Project Lifecycle Support . . . 328
10.2.Functional Focus Analyses . . . 330
10.3.Maturity Analyses . . . 331
III. Appendix
333
A. About the Authors 335 B. Assessment System 337 B.1. Project Lifecycle Support Weights (M-Model) . . . 337B.2. Functional Focus Analysis . . . 339
B.3. Maturity Profile Analysis . . . 343
C. Abbreviations 349
D. List of Figures 351
E. Index 355
F. Bibliography 359
1. How to work with this report
Software is widely used to supportmod-ern businesses project management. Surveys show that supporting software is employed in more than 75 percent of all implemented projects ([19], [28], [17, p. 196]). Originally these systems were designed for network plan-ning and scheduling only (cp. [11], [25, pp. 37]), but modern solutions cover almost all aspects of project management.
It is no longer only project managers who use project management software. It is in-creasingly used by all project stakeholders: project teams, customers, suppliers, steering committees, project offices and upper manage-ment. The systems have experienced a tech-nical development from monolithic desktop ap-plications to highly scalable enterprise solu-tions. These solutions are capable of single and multi project management but are also used for portfolio management and have evolved their collaborative capabilities: Due to the success of the internet project management software has transformed into a platform for computer-supported cooperative work (CSCW), enabling geographically-dispersed teams to minimize the problems associated with working in differ-ent locations at differdiffer-ent times (cp. [27]). Project management software systems are increasingly used for enterprise-wide project management. In these cases the software sup-ports the streamlined and standardized execu-tion of projects according to project manage-ment process models and methodologies. The systems are highly configurable, so they can be adapted to an organization’s individual needs.
Complex Implementation
Projects
As a consequence, the selection and imple-mentation of project management software has become remarkably complex. Organizations particularly have to consider the following as-pects:
• The number and functional diversity of the available systems complicate the pre-selection of software systems (currently,
more than 220 systems are available from 200 manufacturers).
• The organization using the software must take requirements from manifold user groupsinto consideration if the software is to be accepted.
• The organization’s project management methodology should serve as a basis for the configuration of the system. If neces-sary, the software must be extended by custom development.
• Interfaces to adjacent software systems have to be created. Financial and hu-man resource hu-management systems play a special role here.
In the early days of project management soft-ware, implementing it just involved procure-ment and installation. Today, impleprocure-mentation is first and foremost an organizational issue. In this book, theterm project management soft-ware (PMS) is used to refer to all software systems that carry out the initiation, planning, controlling and termination of projects, project programs and project portfolios. Project man-agement software can support one or more projects, programs or portfolio management methods. The software we refer to has been specifically designed and developed for the purposes of project management (project man-agement software in a narrow sense). Software systems that offer generic functionality, which can also be used to facilitate the management of projects (like Office software), are only re-garded as project management software in a wider sense (cp. [17, pp. 28]).
Introduction
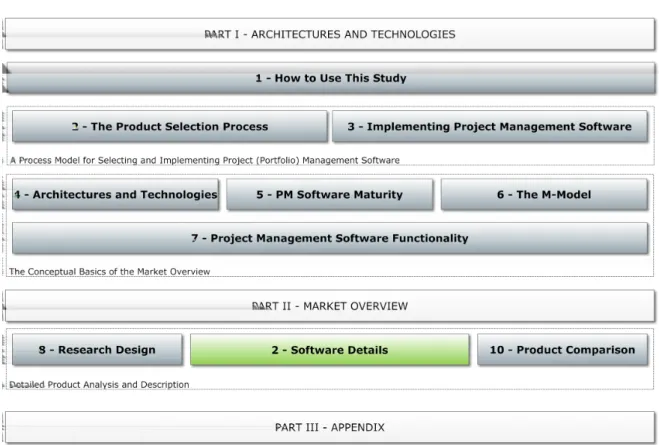
This report is divided into three parts (Fig. 1). Thefirst part is an introduction and describes the fundamental aspects that need to be con-sidered when selecting and introducing project management systems. We recommend that you the focus on these chapters if you are cur-rently involved in the selection and implementa-tion of PM software in your own company. The
1. How to work with this report
Figure 1.: Structure of the Project Management Software Systems Report
information in these chapters summarizes both current scientific findings and practical experi-ences from actual implementation projects, in which different products were utilized.
The chapter “Technical aspects of PM soft-ware” contains a brief outline of the techni-cal characteristics and distinguishing features of the project management software products available today. You will only require more pre-cise details if, for example, you are a represen-tative of the IT department and are responsible for the installation and maintenance of the ac-quired software. In this case you will already be acquainted with the technicalities and can skip this chapter. It is aimed at those who are ap-proaching PM software from the project man-agement viewpoint.
Each new version of a software brings with it new functions. The order in which manufactur-ers implement certain functions is frequently similar. It follows the various application sce-narios in the company over the course of an increasing degree of project management ma-turity (beginning with the planning of individual projects and progressing through to the plan-ning and controlling of complex project portfo-lios or multi-project environments). The matu-rity model for project management software de-scribes these areas of application and the typ-ical, sometimes compulsory, development that
many project management software products go through over the course of time.
This report weighs up the project management software available using theM-Model, a func-tional reference framework that places the fea-tures they offer in a process-orientated con-text. The chapter dealing with the “M-Model” describes how we evaluate software. It also il-lustrates the relationship between this process-orientated representation of project manage-ment and thematic arrangemanage-ments – for instance according to the ICB IPMA Competence Base-line.
The chapter on software functionality provides anoverview of the functionalityoffered by mod-ern software systems. It is based on the struc-ture of the M-Model. Taking over 50 topical groups with a total of more than 270 individual software features as a starting point, this chap-ter describes the crichap-teria we applied when ana-lyzing the products in this report. It is also suit-able for checking whether your own software requirements have taken everything into con-sideration. You can draw up your own requiment profile using the one contained in this re-port by using the enclosed check list.
Market Overview
The second part is concerned with specific software products and their functions. It forms the most extensive part of this report. Here you will find detailed descriptions of several prod-ucts from different manufacturers. Each prod-uct was evaluated using the 250 criteria of the M-Model described above. These criteria are additionally grouped by functional aspects as well as project management software maturity aspects. These evaluations, together with the screenshots, will give a good impression of the respective software products. The section also contains general information on each product and its manufacturer. If you are concerned with the selection of project management software, you should have clarified your requirement pro-file with the aid of the previous section’s check list before examining these assessment results. In the final chapter of the second section, we compare the assessments of all products ac-cording to the M-Model, the maturity model, and the functional analysis.
Appendix
The appendix forms the third section of this re-port. It contains lists of the illustrations,
abbre-viations and literature as well as the keyword index.
For an easier read, we sometimes dispense with a detailed illustration of the assessment system in the first two sections of the report. Nevertheless, the goal of this report is not only to supply information on project management software to help you make your decision, but to make the assessment process transparent. All rules, according to product, can therefore be found in the appendix.
How to Get Updates
The manufacturers of project management software are always developing their solutions. This report allows for that via the accompany-ing websiteat
www.pm-software-report.com
This gives you access to updated product infor-mation during your selection. Theaccess code
on the inside of the cover, which is valid for six months from the date of purchase of the re-port, allows you to log on to the website. Newly-published assessment results will be provided here in PDF format for downloading.
8. Research Design
8.1. Selection of Systems and
Research Process
For this report, we assessed stand-alone project management systems only. The re-port evaluates generic project management (not industry-specific) functionality. Systems that are primarily designed for the following purposes have been specifically excluded from the report: Procurement management, exec-utive reporting (unless project management-specific), strategy definition and budgeting. For the first edition of the report, we identified manufacturers and their software systems. We contacted approximately 200 software manu-facturers via email, of which 51 applied for participation. 34 products were selected from the 51 solutions, as each of these had more than 4,000 users. Owing to the increasing consolidation of the project management soft-ware market, the prerequisites for manufactur-ers and products that are new to the current edition of the report have been adapted. So,
today’s prerequisitesare as follows:
• The product must have been available for more than three years and have more than 5,000 users. An exception can be made if an established manufacturer of a product that fulfills these criteria pub-lishes a new product.
• The software must provide multi-project management functions, especially in re-gard to resource management, organiza-tional structures and IT architecture. • The software must be available with an
English user interface and at least one other language.
• The product must be able to actively plan and control a company’s project portfolio according to strategic objectives and/or support project services automation, for instance offering management and in-voicing.
Despite these criteria, new products can be in-cluded in the report if they seem to be challeng-ing for the market or offer especially
interest-ing features in some areas. In this case, these products will be marked aschallengers. Software products that are added to the re-port are first assessed in a one-day work-shop in which we apply the evaluation crite-ria. Products that have been included in pvious editions of the report are regularly re-evaluated, particularly after new releases have been published. The workshops are carried out by authors together with experienced consul-tants from the various manufacturers. Update assessments focus on the new features but, if the technological basis has been changed since the last assessment, we also re-check the criteria that have already been assessed. A sample of randomly-selected criteria that were assessed previously is always reviewed too. After the workshop, the data is analyzed, a product profile is compiled or updated, and this is sent to the manufacturer for verification and approval. The manufacturers are given a chance to suggest corrections, which we then verify and take into account. If necessary, addi-tional assessment sessions take place. This report was initiated in 2002, and new ma-jor editions have been published every 12 to 18 months in the intervening years.Updatesto the assessments are applied approximately every three months. They are available for download as PDFs via the report’s website and always included in the next reprint.
8.2. Derivation of Evaluation
Criteria
This report focuses on breadth and depth of functionality rather than on non-functional qual-ity criteria. For this reason, we use evaluation criteria that assess the products’ functionality for enterprise-wide project management. We divide the products into functionality groups. These functionality groups were created in two steps. First of all, we followed a top-down ap-proach and deduced the functionality of prod-ucts from a theoretical point of view, using the so-called M-Model [1].
8. Research Design
Next, we used a bottom-up approach to look at the functionality offered, validating the the-oretical findings and making them more real-istic. It also enabled us to ensure that the re-port reflects the functionality of state of the art project management systems. The results of this phase were mainly summarized in the form of an adapted M-Model, as described in chap-ter 6.
8.3. Evaluation of Systems
The software was evaluated in workshops with experienced consultants at the office of either the software manufacturer or the author. Typi-cally, these assessments lasted one day. Some evaluations were carried out at the manufac-turer’s site since the complexity of the software installation and the hardware and software re-quirements rendered an evaluation either at the University or at our offices infeasible.
Evaluation was undertaken within the frame-work of the adapted M-Model (chapter 6). We checked the extent to which the software sys-tems support the functionality, as expressed in the M-Model, by analyzing the software and its documentation. Each of the requirements pre-sented in sections 7.1.1 to 7.11.8 was used as a single assessment criterion.
In principle, the software systems were eval-uated using letters expressing the extent to which the software offers a certain kind of func-tionality. Four of these are used:
S — Standard functionality: The functional-ity is available “out of the box”. The soft-ware is designed for corresponding re-quirements.
C — Configurable functionality: The func-tionality is not available by default but it can be implemented by configuration or customization. Programming is not re-quired, or only to a very limited extent.
W — Workaround available: The software doesn’t offer corresponding standard functionality, and it cannot be configured to meet such requirements. Neverthe-less, the software can be used by apply-ing a workaround(a functionality that was not created for this purpose but might be a substitute). Applying workarounds very often means coping with reduced usabil-ity and comprehensibilusabil-ity.
Example: A software does not offer a budgeting functionality. A workaround for this might be the usage of special
(ma-terial) resources that represent the bud-gets.
I — Interface available: The software doesn’t offer corresponding standard functional-ity and it cannot be configured to meet such requirements. Instead, the software offers an interface to other software that can be employed. This software is spec-ified in the corresponding remarks col-umn.
Each of the assessment criteria (see chapter 7) has fivelevels of fulfillment. For each of these levels, an S, C, W, I is assigned, or no letter is given, signifying that no functionality is avail-able. As a result, each software system obtains a row of icons indicating the extent to which a specific requirement is met or functionality is available.
Example:
A software system has the following assess-ment result with respect to criteria Risk Estima-tion (p. 46): “SSW”
This means:
1. The software offers standard functionality for documenting risks textually.
2. The software offers standard functionality for implementing risk checklists.
3. A workaround is available for implement-ing risk indicators.
4. There is no functionality available for con-figuring custom risk indicators.
5. There is no functionality available for mul-tiple risk assessment with various risk ex-perts.
8.4. Aggregation of the
Assessment Results
In order to ease and accelerate the interpre-tation of the evaluation results, three different aggregations are available for each product:
• The project lifecycle support analysis • The functional focus analysis
• The maturity profile analysis
Details on how these aggregations are calcu-lated can be found in the Appendix (The As-sessment System).
8.5 Structure of the Product Descriptions
8.5. Structure of the Product
Descriptions
Each product description in this report is ar-ranged uniformly. They each begin on a left-hand page and summarize the essential prod-uct information on their first two pages.
The address on the first page of the descrip-tion always names the software manufacturer. If available, details of distribution partners are printed on the following pages of the product description. While most manufacturers publish the number of installations, the number of em-ployees appears to be a trade secret for some manufacturers. If stated, the number of employ-ees is subdivided into:
• the total number of employees
• the number of employees working in con-text with the product
• the number of developers working on the product.
Particularly for the larger manufacturers, the overall number of employees is not very sig-nificant. A smaller company that is dedicated to their product is not necessarily a worse in-vestment risk than large one. The latter might decide to close the “small project management division” in order to focus on other markets— though this doesn’t seem to be very likely at the moment. Nevertheless, the number of installa-tions does hint at the product’s establishment—
as long as the manufacturer wants to supply this information.
The product abstract describes the software briefly.
The version history lists the previous versions of the software—according to the manufac-turer’s data—and summarizes the main new features in each version. Here we rely on man-ufacturers’ data for old versions.
The functional focus analysis shows the total result of the assessment, arranged according to functional groups. The darker part of the bars shows the result achieved for the criteria eval-uated with “S”, which are covered by the stan-dard configuration of the software. The entire bar also includes the functions that require con-figuration and which were thus evaluated with a “C”. The same applies to the maturity analysis.
The M-Model summarizes the project life cy-cle assessment. As with the function analysis, a distinction is made here between functions that are available as standard (S) and those that can only be accessed by configuration (C). Evaluation results, which are attained only by the combination of C+S, are shown as gray stars. Conversely, if the stars are already at-tained with the functions available as standard, then they are yellow in color.
The distinction between the functions available as standard and those requiring certain adjust-ments to the software is frequently irrelevant in individual cases. We only assess a function with C if the required configuration is relatively simple. It must not require programming, and
8. Research Design
must be release-proof (for more detailed infor-mation see 8.3). Overall, however, the ratio of gray to yellow stars, or of the light portion of the bar to the entire bar, gives an idea of the areas in which more extensive configuration will be necessary if the corresponding functions are desired.
There is more to configuration work than the functional adaptations described here. Inter-faces with other software products, the individ-ual rights concept and, for example, the draft-ing of workflows or input forms in accordance with individual requirements usually generate a substantial portion of the total work.
Following the information on the first two pages of each assessment report, the detailed as-sessment resultson the individual criteria from Chapter 7 are listed on the next two pages. As in the M-Model, the overall results per group are shown as yellow or gray stars.
The assessment report continues with details on the manufacturer as well as the product.
Finally, the assessment summary text gives a brief overview of the software.
Some software vendors provide pricing infor-mation, while others do not. License fees cer-tainly are just one part of the overall software implementation cost, and they strongly depend on the customer’s particular situation and the vendor’s licensing model. Even so, they can give a sense of a product’s pricing level. There-fore, we ask vendors to provide pricing informa-tion for four scenarios, which are based on four role types:
Normal users just report progress on their tasks and track project and working time. They may also submit project ideas to the portfolio process and can be involved in workflows.
Project managers have full access to project planning and controlling functions.
Management users will use multi-project dashboards and perhaps plan resources for their sphere of responsibility.
Administrators will need a license that grants full access to all features of the software. Actual licensing models are likely to differ from this model. Many are much more detailed. Therefore, pricing information given in this re-port must be considered approximate.