Course Evaluation Matters: Improving Students’ Learning Experiences
with a Peer Assisted Teaching Program (PATS)
Angela Carbone
a, Belinda Ross
b*, Liam Phelan
c, Katherine Lindsay
d, Steve
Drew
e, Sue Stoney
f, Caroline Cottman
gOffice of the Pro Vice-Chancellor (Learning and Teaching), Monash University, Australia, b
Office of the Pro Vice-Chancellor (Learning and Teaching), Monash University, Australia, c
GradSchool, The University of Newcastle, Australia, dNewcastle Law School, Faculty of Business and Law, The University of Newcastle, Australia, eInstitute for Higher Education, Griffith University, Australia, fCentre for Learning and Development, Edith Cowan
University, Australia, gCentre for Support and Advancement for Learning and Teaching, University of the Sunshine Coast, Australia
Course Evaluation Matters: Improving Students’ Learning Experiences
with the Peer Assisted Teaching Scheme
In the rapidly changing global higher education sector, greater attention is being paid to the quality of university teaching. However, academics have traditionally not received formal teacher training. The peer assisted teaching program reported on in this paper provides a structured yet flexible approach for peers to assist each other in
reinvigorating and refining their teaching practice. Academics participated in this national, multi-institutional trial for varied reasons: the majority voluntarily, others to increase low student evaluation of course scores, and some as part of a graduate certificate teaching qualification. Here we report on how academics used the scheme, and the teaching areas they focussed on. Student evaluation of course scores increased in a large majority of courses, suggesting the changes made had a positive effect on students’ learning experiences. The experiences of the multi-institutional trial reported here may benefit others considering such a scheme to reinvigorate and refine teaching practice and improve course evaluation scores.
Keywords: peer assisted learning; student evaluation; professional development; teaching evaluation; PATS
Introduction
In the higher education sector internationally, academic teachers are typically not required to have formal teaching qualifications. For example, the 2010 Browne Review of Higher
Education Funding and Student Finance in the United Kingdom called for ‘all new academics with teaching responsibilities to undertake a teaching qualification… and that the option to gain such a qualification [be] made available to all staff… with teaching responsibilities’ (Browne 2010, 48). Four years later, however, that recommendation remains to implemented (Boffey 2012).
A recent study from Australia suggests that 37 per cent of academics have never undertaken any form of training in university teaching (Bexley, James, and Arkoudis 2011). As a result many academics learn to teach as they go (McInnis 1999). However, teaching quality is attracting increasing attention from universities worldwide. Many universities are now looking for ways to professionalise the academic workforce and ensure the quality of university teaching and learning, particularly at a time of massive and ongoing change in the higher education sector, with increasing sessional staff and increasing numbers of students from low socio-economic backgrounds (Devlin and Samarawickrema 2010). Academic teachers can be pressured to perform well in their teaching, as measured by student
evaluations of courses, yet not always be well supported by their institution to ensure high quality teaching. Studies show that many academics perceive teaching to be undervalued, largely unrecognised and unrewarded (Stenfors-Hayes et al. 2010, Brownwell and Tanner 2012) and furthermore feel unsupported by their institution to further develop their teaching practice (Bexley, James, and Arkoudis 2011).
This paper reports on a 2012 multi-institutional trial of a peer assisted teaching scheme (PATS) where teaching academic peers support each other to improve and reinvigorate their courses. The term course is also called a unit, a subject, or (in New
Zealand) a paper. The term course will generally be used in the remainder of this paper. The participants in this scheme achieved positive results through reflecting on their practice as they worked in pairs through a series of structured exercises, scheduled prior, during and after semester. These exercises allowed academics to focus on areas they identify as most needing improvement. By reinvigorating their courses in their chosen focus areas, student course evaluation scores improved as a result. This paper reports on changes in student course
evaluation scores across the five institutions that participated in the trial and proceeds as follows. Section two provides context for student evaluations of courses. Section three
introduces PATS as a way to improve course evaluation scores, and section four describes the approach undertaken for this research. Results are in section five, and the discussion, section six, concludes the article.
Course evaluation in context
In this section we contextualise efforts to improve students’ learning experiences, as measured through institutional course evaluation surveys. We provide a discussion of the relationship between student learning outcomes and experiences and student course
evaluations. We then discuss how higher education institutions recognise the value of quality teaching reflected in student course evaluation scores as evidenced through examples of internal targets and policies.
Student Learning Experiences and Learning Outcomes
The correlation between student evaluations of courses and their learning outcomes is
somewhat open. Some studies suggest that student satisfaction and student learning outcomes do not necessarily correlate positively (Sitzmann et al. 2008, Clark 2010, Galbraith, Merrill, and Kline 2012, Dowell and Neal 1982). One review of 136 studies of student satisfaction and learning outcomes (Sitzmann et al. 2008) found just a very small positive relationship between student evaluations and learning outcomes, concluding that this relationship is not strong enough for student evaluations to be used as an indicator of learning. A second study of 116 courses in a US School of Business (Galbraith, Merrill, and Kline 2012) likewise
found that student evaluations of teaching effectiveness had a weak or small relationship with student learning outcomes. Such findings have prompted some researchers to conclude that ‘student ratings are inaccurate indicators of student learning and they are best regarded as indices of ‘consumer satisfaction’ rather than teaching effectiveness’ (Dowell and Neal 1983: 462). Abrami, Rosenfield and Dedic (2007) similarly conclude that studies such as these on the relationship between ratings and achievement suggest that there is much yet to be learned of how instructors teach and how this affects student learning and other results of instruction.
Other studies, however, have found a positive relationship among student learning outcomes, student motivation and student experiences of teaching (e.g. Trigwell and Prosser 1991). One study of university students’ perceptions of their learning environment found these to be a stronger predictor of learning outcomes than prior achievement at school
(Lizzio, Wilson, and Simons 2002). Student learning is found to be ‘unambiguously linked to effective teaching’ in a second study, an analysis of over 2,600 empirical studies of the impact of higher education on student learning and development (Pascarella and Terenzini 1991: 619). This review found that the factors that contribute to effective teaching include the instructor’s ability to establish rapport with students, interpersonal accessibility, feedback to students, active learning strategies, opportunities for students to interact with their peers, as well as ‘a curricular experience in which students are required to integrate learning from separate courses around a central theme’ (Pascarella and Terenzini 1991: 619). These findings suggest that there is a role for teaching in learning, that good teaching is worth investing in, and that students may rate good teaching highly in course evaluations. As such, our view is that student evaluations of courses provide an at least intuitive indication of students’ learning experiences.
Institutional Targets
Setting and maintaining teaching standards is a policy goal at many Australian universities, and within universities there are pressures to perform well on teaching as measured through quantitative student evaluation scores. These pressures may be expressed at the university, faculty and school level. Many schools and faculties have their own goals of acceptable student evaluation scores. At the University of Newcastle for example, the Strategic Plan for 2011-2015 (The University of Newcastle 2013) prioritised student satisfaction with teaching quality measured using the 5-point Likert scale on student evaluation scores (where 1=low and 5=high). The policy goal of the University of Newcastle is to achieve an increase of 70% of courses scoring at least 4 and no courses scoring less than 3. Likewise, the Faculty of Information Technology at Monash University has targets with respect to student course evaluation scores (Monash University 2013). In 2010 for example, the Academic Staff Performance Metrics and Standards for the faculty gave the target that 90% of all courses within the faculty should achieve a score of 3.5 or above.
These internal institution policies and targets for teaching quality are examples of universities’ internal goals regarding teaching performance. Using quantitative measures such as student evaluation scores is a common way to measure teaching quality. PATS is a way of assisting academics to improve their teaching practice, which may in turn result in improved student course evaluation scores.
The PATS Scheme: A Method to Improve Course Evaluation Scores
The scheme has been demonstrated to deliver improvements in course evaluation scores across several faculties at one institution (Monash University). In this article we report on the
deployment of the scheme across five diverse Australian higher education institutions and the improvements in student course evaluation scores across all five of these institutions.
PATS is a new form of academic professional development for academic teaching staff to enhance teaching quality. The scheme provides a structured framework to
reinvigorate courses through collegial input and guidance via a process that incorporates goal-setting exercises, peer observation of teaching and analysis of informal student feedback. In addition, workshops covering various aspects related to teaching are offered during the scheme.
PATS was initially designed to address low student satisfaction with the quality of Information and Communication Technology courses in the Faculty of Information
Technology at Monash University in Victoria, Australia. The scheme was primarily designed to: (i) improve the level of student satisfaction with courses identified as in need of
improvement; and (ii) build leadership capacity by engaging teachers recognized as
outstanding. Demonstrated improvements in the level of student satisfaction with courses in the 2009 pilot scheme (Carbone, Ceddia, and Wong 2011) led to a trial of the scheme in other disciplines at Monash University in 2010, supported by an Australian Learning and Teaching Council Teaching Fellowship grant. In 2012, the Council of Australian Directors of
Academic Development funded a trial expanding the scheme across several other Australian universities: The University of Newcastle (New South Wales), Griffith University, University of the Sunshine Coast (Queensland), and Edith Cowan University (Western Australia). In 2013 the scheme has been rolled out at fourteen universities including two private higher education institutions nationwide as part of an Office for Learning and Teaching funded National Senior Teaching Fellowship.
PATS follows a structured reflective-practice process for improving and
reinvigorating teaching practice. Through peer partnerships, participants are provided with the input, support, assistance and guidance to assist in reinvigorating their teaching and course. The two main partnership types are the mentee/mentor and the reciprocal co-mentor partnership. Using the framework provided in the PATS workbook, participants are asked to complete seven tasks with their partners beginning with ‘Meet and Greet’, as shown in Figure 1.
Figure 1. The PATS process (from PATS 2013).
Three of these tasks occur before semester starts, two during semester, and two after the semester is completed. Tasks 1 ‘Meet and Greet’ and 2 ‘Break down the Barriers’ are used to establish the partnership and focus on the barriers participants perceive are standing in the way of making improvements. In Task 3 ‘Goals for Improvement’, participants are asked to set goals and strategies to reinvigorate their teaching practice. Participants are asked to gather informal student feedback in Task 4 ‘Informal Student Feedback’ and complete a peer
observation of teaching in Task 5 ‘Peer Review’. Task 6 –‘Critical Reflection’ asks that mentees critically reflect on their teaching and course. In the final task, Task 7 –
‘Performance Planning’ participants are required to capture both the qualitative and
quantitative changes in their performance as it relates to teaching improvement, educational leadership and education standing.
Research Approach
Participating Institutions
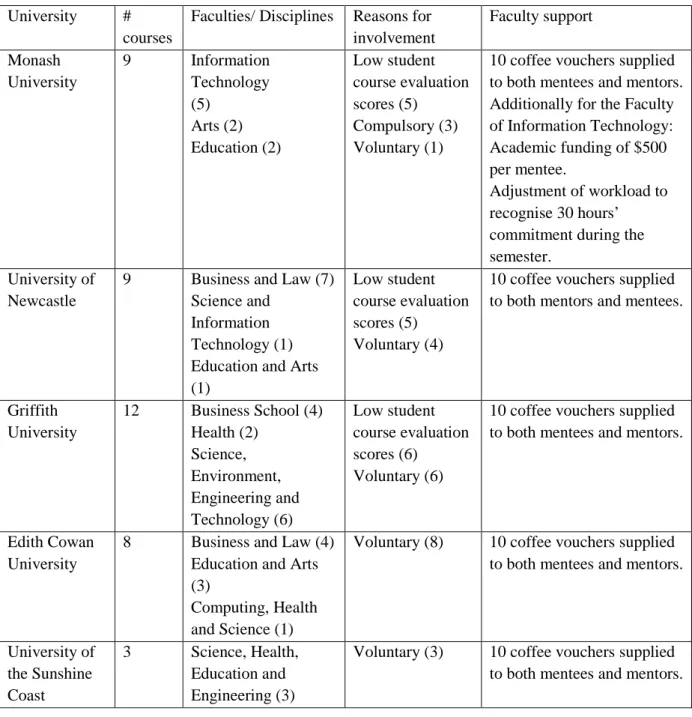
Five diverse institutions across four states participated in this study. Table 1 below outlines the contexts for each participating university, providing the reasons for involvement, the support offered to participants by faculties and the way in which participants were recruited to take part. The trial involved 41 courses, and the participants teaching those courses participated in the trial on one of three bases. Of those 41, twenty-two (54 per cent) participated voluntarily. The next largest group, 16 (39 per cent), were invited by their institution because of previously recording low student course evaluation scores. The remaining three (seven per cent) participated as part of requirements for a formal graduate certificate level qualification in academic practice, and this has been labelled compulsory.
Table 1. Context of the five universities involved in PATS.
Interpreting Course Evaluation Scores
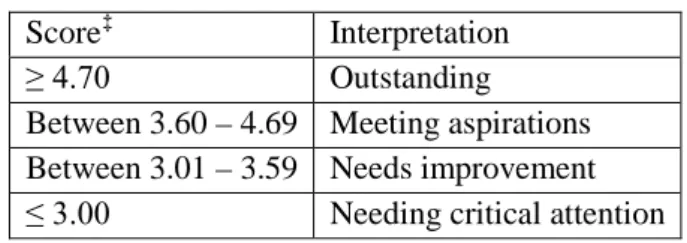
The student course evaluation scores reported in this article are all responses to questions asking students at each of the five universities about their overall satisfaction with courses included in this trial. Monash, Newcastle, Griffith and University of the Sunshine Coast all use 5-point Likert scale ranging from Strongly Agree (5) to Strongly Disagree (1) with 3 representing Neutral. Options for Not Applicable (6) and Don’t Know (7) are not counted in the means for questions. Edith Cowan University uses a 100 point scale, but for purposes of comparison and consistency, these have been converted into a 5-point scale. Each institution interprets scores similarly, albeit with minor differences. The approach at Monash University
is broadly representative and is described here. The Monash University course coding categories, given in Table 2, provide a means of categorising courses according to their student course evaluation scores. Any course with a value below 3.0 is flagged as needing critical attention, and any course scoring above 4.7 is categorised as outstanding.
Table 2. Coding categories for overall satisfaction scores at Monash University.
Data Collection
The two data collections used in this study were:
• Student course evaluation scores from 2012 and 2011 – the year of the trial and the year preceding. The two years were used to provide ‘before and after’ data, to identify changes in results after participation in the scheme.
• Task 3 data from the PATS workbook, which describes the goals and strategies set by participants to reinvigorate and refine their teaching and course, and Task 6 data from the PATS workbook, which reflects on participants’ achievement of their goals.
The project was approved by the Monash University Standing Committee on Ethics in Research involving Humans.
Results
The results are de-identified (i.e. course codes and academics’ names are removed), presented by institution and provide student course evaluation scores for each of the courses involved in the trial. We have provided comparative data from before and after using the scheme (i.e. for
the 2011 and 2012 offerings) for 26 of the 41 courses that were part of the trial. These 26 courses had been taught in both the trial year and preceding year by the same person, and so were amenable to comparison.† Following the results of the student course evaluations, we provide brief case studies from high-scoring courses to show the diversity of approaches that participants employed in reinvigorating and refining their teaching. This diversity of
approaches is not discernible in the quantitative student course evaluation data, and these case studies which outline the educational areas participants chose to focus on are drawn from the Task 3 data provided by participants.
†
A total of 26 courses were taught by the same person before and after. However, for one course (at the University of Newcastle), a low number of student responses meant quantitative data were not produced for the 2012 (i.e. trial) offering of the course.
Changes in Course Evaluation Scores
Monash University
Table 3 shows the 2011/12 student course evaluation scores for overall course satisfaction for participants in the 2012 scheme for Monash University. The nine courses spanned three faculties: Information Technology (5), Arts (2) and Education (2), and involved eight partnerships. Five teaching participants were approached by Heads of Schools due to low student course evaluation scores (all in mentee/mentor partnerships), one was voluntary (a mentee/mentor partnership), and two participated as part of the Early Career Development Fellowship (one of these was in a reciprocal partnership and one was mentee/mentor), labelled compulsory.
Table 3. Results for Monash University courses: Information for the course, partnership type, recruitment method, median scores for student satisfaction, enrolment and response numbers, and changes in student course evaluation scores.
Of the suite of courses at Monash University involved in the trial, seven had before and after data. In all but two instances, increases were recorded ranging from +0.3 through +1.9, with an average change in student course evaluation scores of +0.7. In one instance a slight decrease was recorded (-0.1), and in one other instance no change was registered.
Overall, seven of the nine courses finished in Monash University’s ‘meeting aspirations’ zone (median above 3.6). These quantitative results suggest that the
implementation of the scheme has had a considerable effect on student satisfaction levels and student evaluations of courses.
The University of Newcastle
Table 4 shows the 2011/12 student course evaluation scores for overall course satisfaction for the nine courses spanning three faculties: Business and Law (7), Science and Information Technology (1), and Education and Arts (1). Five courses took part due to low student course evaluation scores (all mentee/mentor partnerships) and four took part voluntarily (all
mentee/mentor partnerships).
Table 4. Results for the University of Newcastle courses: Information for the course, partnership type, recruitment method, mean scores for student satisfaction, enrolment and response numbers, and changes in student evaluations of courses.
The average increase in student satisfaction scores at the University of Newcastle was +0.6 points. Of the five courses involved due to low student course evaluation scores, all increased by between +0.4 and +1.0 points. Of the four courses for whose lecturers volunteered for the trial, one recorded an increase in overall satisfaction scores (+1.2), one recorded a decrease (-0.3). For this course, the mentee/mentor pair attributed the difficulty of teaching the course to a number of reasons: it was compulsory in the first semester; and it fell within the semester where all students exclusively study law courses for the first time. In this instance, the process was very helpful towards identifying structural issues in the program of which the course was part. In brief, the mentor and mentee reflected on their experience and concluded that the course (6-BL) ideally needs to be scheduled earlier in the program. For the third course (8-EA), there were too few student responses to receive a quantitative score, however qualitative student feedback was provided and is noted in the table. For the remaining course (9-SIT) previous year data were not available because this was the lecturer’s first time teaching the course.
Griffith University
Table 5 shows the 2011/12 student course evaluation scores for overall course satisfaction for participants in the 2012 scheme at Griffith University. The 12 courses spanned three
disciplinary groups: the Griffith Business School (4), Griffith Health (2), and the Science, Environment, Engineering and Technology Group (6). There were 10 partnerships: six took part due to low student course evaluation scores (all mentee/mentor partnerships) and four through voluntary means (three were mentee/mentor and one reciprocal).
Table 5. Results for Griffith University courses: Information for the course, partnership type, recruitment method, mean scores for student satisfaction, enrolment and response numbers, and changes in student course evaluation scores.
Of the 7 courses with before and after data to compare, the average increase was +0.5, with a high of +1.0 and a low of +0.1. There were increases in all courses whose lecturers were invited to participate because of previously recording low student course evaluation scores. Of the six courses whose lecturers participated voluntarily, only 1 had previous data to compare with and this showed an increase of +0.1.
Edith Cowan University
Table 6 shows the 2011/12 student course evaluation scores for overall course satisfaction for the eight courses participating in the scheme at Edith Cowan University. These were spread over three faculties: Business and Law (4), Education and Arts (3), and Computing, Health and Science (1). All six partnerships took part voluntarily: there were four reciprocal and two mentee/mentor partnerships. The discrepancy in these numbers is due to some of the
Table 6. Results for Edith Cowan University courses: Information for the course, partnership type, recruitment method, mean scores for student satisfaction, enrolment and response numbers, and changes in student course evaluation scores.
The data shows an average increase of +0.3, with a high of +0.7 and a low of +0.1 across courses with before and after data. Note the very high scores (4.8, 4.8) for two of the three courses without previous data to compare with.
University of the Sunshine Coast
Table 7 shows the 2011/12 student course evaluation scores for overall course satisfaction for the three courses participating at the University of the Sunshine Coast. All belonged to the Faculty of Science, Health, Education and Engineering and took part through voluntary means. None of the courses had previously been taught by the participants.
Table 7. Results for the University of the Sunshine Coast courses: Information for the course, partnership type, recruitment method, mean scores for student satisfaction, enrolment and response numbers, and changes in student course evaluation scores.
As none of these courses had previously been taught by the teaching participant, there is no comparison data. The overall scores range from respectable (+3.3) to very high (+4.3).
Educational Focus Areas of High Performing Courses
To illustrate how positive changes in teaching may come about, we will now look at some of the areas that academics with positive student course evaluation scores focussed on in their teaching improvement. Of the 41 courses and 66 different participants (some participants were involved in more than one partnership) involved in the trial, and for which we have student course evaluation data, 28 PATS workbooks were collected: Monash University (4
participants), Griffith University (10 participants), Edith Cowan University (8 participants), The University of Newcastle (3 participants), and University of the Sunshine Coast (3 participants). Of the 28 workbooks collected, 28 participants completed Task 3 and 17 participants completed Task 6.
Task 3 involves setting achievable and measurable goals for quality improvement and is conducted prior to the beginning of semester. Participants set two to three goals for
improvement and list strategies to achieve those goals. With goals in mind, existing course or teaching evaluation data from prior offerings are evaluated to inform revision of curriculum and pedagogy in order to achieve them. After semester finishes, colleagues reflect on their achievements and how well they managed to reach their stated goals for improvement for Task 6.
A thematic analysis of the goals for improvement listed by participants was completed by three of the researchers. Raw data of 77 written comments on goals and strategies from the task data was coded first independently by the researchers before a consensus was reached. The researchers used a set of seven educational focus areas derived by Carbone and Ceddia (2012) to assist in the analysis, and the frequency with which each area was cited is noted below (the cumulative total of incidences is greater (82) than the number of written
comments (77) because some comments addressed dual or multiple focus areas). The analysis reveals the seven educational focus areas listed below in order of frequency. For further discussion of how academics approach goal setting and the educational focus areas of their goals see Ross et al. (Under review).
2. Course focussed (13) 3. Assessment focussed (13) 4. Learning activity focussed (12) 5. Administrative focussed (10) 6. Resource focussed (9)
7. Student focussed (engagement, attitudes) (8)
In order to understand how improvements in quantitative student course evaluation scores result from participants’ efforts, some specific examples of changes in teaching practices are provided below. These examples illustrate the types of goals and strategies set by participants who improved their student course evaluation scores or received a high overall score.
Participants’ reflections on the success of their efforts were also discussed.
One partnership from Griffith University (course 12-SEET in Table 5 above) had as their student focussed goal and strategy:
“Increase student satisfaction with the course. Combine parts of course 1 with course 2 so that the small cohort in course 1 does not feel so isolated and benefit from discussion in large group. Cater better for needs of students with very different education levels and English language competence.”
The participant’s reflection of how well the goal was achieved reveals the positive effects:
“Student course evaluation scores were the best ever for the course, both in terms of student comments and overall scores (which ranged between 4.8 and 5.0 out of a possible 5.0).”
following goal for their teaching:
“Articulate clearer outcomes for each lecture. This will not only help students but also give me confidence that I’m providing what they need, aside from content alone. As I revamp each lecture for the semester, I will critically overview what I am trying to ensure they take away. I will include a slide articulating this to make sure we are all on the same page.”
After completing the semester, the participant reflected that:
“This seems to help students and me to have a clear idea of the important points to take away from each lecture. As such I think it’s helpful and I would continue to include this.”
The reflection reveals that the goal was achieved and that its implementation helped both the students and the participants.
Another partnership at the University of the Sunshine Coast (course 1-SHEE in Table 7 above) listed as a goal for course improvement the following:
“Learn more about blended learning, both as a pedagogy and process. Research and investigate blended learning and the university blended learning statement and consider how this concept can be introduced to my course.”
After completion of semester, the participant reflected on the goal, stating:
“I have embraced blended learning and now seek opportunities to appeal to many
different learning styles. Additional materials provide opportunities for enrichment. I will continue to explore this concept and develop additional resources such as video artefacts to support learning.”
focussed on improving their knowledge and use of blended learning.
The examples provided above of the goals set by participants illustrate how improvements in the various educational focus areas can be achieved. The student course evaluation scores reported on in Section 5.1 above as well as the participants’ reflections on their goals’ achievement suggest that these improvements contribute positively to student experiences.
Discussion
Many Australian universities have adopted goals for improvements in students’ evaluations of courses, as has the Commonwealth government. The Peer Assisted Teaching Scheme offers an innovative and collegial framework to assist academics in improving their teaching practice and achieving these goals. This trial shows how the scheme was effective in raising overall satisfaction scores on student course evaluation scores across multiple diverse
Australian higher education institutions. The student evaluation scores for the courses taking part in the 2012 multi-institutional trial of the scheme demonstrate widespread and sometimes considerable improvements after the scheme had been in place during a semester. Of all 26 courses with comparable before and after data, 23 (88%) showed an increase in scores, with an average increase of +0.6 (and an average increase of +0.6 for all 26 courses). Two courses showed small drops in overall satisfaction scores and one course registered no change. One further course (8-EA) did not receive a score due to too few student responses, but
overwhelmingly positive student feedback was collected.
The results presented in this trial then suggest an alignment between a teacher’s efforts to reinvigorate a course and the resulting increased student satisfaction with courses
and increased student course evaluation scores. The improvements recorded for this peer assisted teaching trial will be of interest to academic teaching staff and academic developers more broadly as a way of fostering staff and student engagement in their courses and
increasing student course evaluation scores. An investigation into the goals set by academic teaching staff whose courses showed either a considerable improvement in final scores or high final scores, reveals that carefully articulated goals which have been reflected upon prior to and after the semester contribute to positive student experiences and improved course evaluation scores.
This trial has been developed with careful consideration of ongoing discussion surrounding the relationships between student evaluations of courses, students’ learning experiences, and students’ learning outcomes. Although the connection between student learning outcomes and student satisfaction with courses is not a straightforward one, it is clear that a positive learning experience for students and teachers alike create a learning environment that increases student satisfaction and as a result, evaluation scores. Although each offering of a course is unique and has its own story, the results presented in this multi-institutional trial clearly reveal considerable improvements in student course evaluation scores and positive results after using the scheme.
We note also that even significant improvements in students’ evaluations of courses, whether achieved through the peer assisted teaching scheme or other means, will contribute marginally or not at all to institutions’ national and international reputation rankings. This raises several key issues in relation to setting goals around high quality teaching at tertiary institutions. First, measuring quality is challenging. Second, academics, and their institutions, receive messages that are mixed to greater or lesser extents: they are encouraged to improve
the quality of their teaching, but are rewarded primarily for their research performance. Third, significant improvements in student course evaluation scores, such as those achieved across five universities through this trial, are not reflected in national and global measures of esteem for higher education institutions. Our hope is that academics’ concerted efforts to raise the quality of students’ learning experiences, such as reported here, will come to be valued appropriately.
Funding
This Australian multi-institutional trial in 2012 was funded by the Council of Australian Directors of Academic Development.
References
Abrami, P., S. Rosenfield, and H. Dedic. 2007. "Commentary: The dimensionality of student ratings of
instruction: What we know and what we do not." In The scholarship of teaching and learning in higher education: An evidence-based perspective, edited by R. Perry and J. Smart, 385-456. Dordrecht, The Netherlands: Springer.
Bexley, E., R. James, and S. Arkoudis. 2011. The Australian Academic Profession in Transition: Addressing the Challenge of Reconceptualising Academic Work and Regenerating the Academic Workforce. Melbourne: Department of Education, Employment and Workplace Relations.
Boffey, D. 2012. "Lecturers should need a teaching qualification, says NUS president." The Guardian, 22 April. Browne, J. 2010. Securing a sustainable future for higher education funding and student finance: An
independent review of higher education funding and student finance.
Brownwell, S., and K. Tanner. 2012. "Barriers to Faculty Pedagogical Change: Lack of Training, Time, Incentives, and Tensions with Professional Identity?" CBE—Life Sciences Education no. 11 (Winter):339-346. Carbone, A., and J. Ceddia. 2012. Common Areas for Improvement in ICT Units that have Critically Low Student
Satisfaction. Paper read at Fourteenth Australasian Computing Education Conference (ACE2012), 31 January - 3 February, 2012, at Melbourne, Australia.
Carbone, A., J. Ceddia, and J. Wong. 2011. A Scheme for Improving ICT Units with Critically Low Student Satisfaction. In Innovation and Technology in Computer Science Education (ITiCSE). Darmstadt, Germany.
Clark, R. C. 2010. Evidence-based training methods: a guide for training professionals Alexandria, Va.: ASTD Press.
Devlin, M., and G. Samarawickrema. 2010. "The criteria of effective teaching in a changing higher education context." Higher Education Research & Development no. 29 (2):111-124.
Dowell, D. A., and J. Neal, A. 1982. "A selective review of the validity of student ratings of teachings." The Journal of Higher Education no. 53 (1):51-62.
Dowell, D. A., and J. Neal, A. 1983. "The validity and accuracy of student ratings of instruction: A reply to Peter A. Cohen." The Journal of Higher Education no. 54 (4):459-463.
Galbraith, C., G. Merrill, and D. Kline. 2012. "Are student evaluations of teaching effectiveness valid for measuring student learning outcomes in business related classes? A neural network and bayesian analyses." Research in Higher Education no. 53 (3):353-374.
Lizzio, A., K. Wilson, and R. Simons. 2002. "University Students’ Perceptions of the Learning Environment and Academic Outcomes: implications for theory and practice." Studies in Higher Education no. 27 (1):27-52.
McInnis, C. 1999. The Work Roles of Academics in Australian Universities. Canberra: The Australian Government Publishing Service.
Monash University. Academic staff performance metrics and standards. Faculty of Information Technology 2013. Available from http://intranet.monash.edu.au/infotech/resources/staff/.
Pascarella, E. T., and P. T. Terenzini. 1991. How college affects students: Findings and insights from twenty years of research. San Francisco: Jossey-Bass.
Ross, B., A. Carbone, K. Lindsay, S. Drew, L. Phelan, C. Cottman, and S. Stoney. Under review. "Kicking Goals with PATS: Setting Academic Development Goals Effectively." Studies in Higher Education.
Sitzmann, T., K. G. Brown, W. J. Casper, K. Ely, and R. D. Zimmerman. 2008. "A review and meta-analysis of the nomological network of trainee reactions." Journal of Applied Psychology no. 93 (2):280-295.
Stenfors-Hayes, T., M. Weurlander, L. O. Dahlgren, and H. Hult. 2010. "Medical teachers' professional development – perceived barriers and opportunities." Teaching in Higher Education no. 15 (4):399-408.
The University of Newcastle. Building Distinction: Strategic Plan 2011-2015 2013. Available from
http://www.newcastle.edu.au/Resources/Divisions/Academic/Planning%20Quality%20and%20Report
ing/Planning/2011-2015%20Council%20Approved%20Strategic%20Plan.pdf.
Trigwell, K., and M. Prosser. 1991. "Improving the quality of student learning: the influence of learning context and student approaches to learning on learning outcomes." Higher Education no. 22:251-266.
Tables
Table 8. Context of the five universities involved in the Peer Assisted Teaching Scheme. University #
courses
Faculties/ Disciplines Reasons for involvement Faculty support Monash University 9 Information Technology (5) Arts (2) Education (2) Low student course evaluation scores (5) Compulsory (3) Voluntary (1)
10 coffee vouchers supplied to both mentees and mentors. Additionally for the Faculty of Information Technology: Academic funding of $500 per mentee.
Adjustment of workload to recognise 30 hours’ commitment during the semester.
University of Newcastle
9 Business and Law (7) Science and
Information Technology (1) Education and Arts (1)
Low student course evaluation scores (5) Voluntary (4)
10 coffee vouchers supplied to both mentors and mentees.
Griffith University 12 Business School (4) Health (2) Science, Environment, Engineering and Technology (6) Low student course evaluation scores (6) Voluntary (6)
10 coffee vouchers supplied to both mentees and mentors.
Edith Cowan University
8 Business and Law (4) Education and Arts (3)
Computing, Health and Science (1)
Voluntary (8) 10 coffee vouchers supplied to both mentees and mentors.
University of the Sunshine Coast 3 Science, Health, Education and Engineering (3)
Voluntary (3) 10 coffee vouchers supplied to both mentees and mentors.
Table 9. Coding categories for overall satisfaction scores at Monash University. Score‡ Interpretation
≥ 4.70 Outstanding Between 3.60 – 4.69 Meeting aspirations Between 3.01 – 3.59 Needs improvement ≤ 3.00 Needing critical attention
‡
Note that Monash University uses a median value, while all other universities in the trial use mean values.
Table 10. Results for Monash University courses: Information for the course, partnership type, recruitment method, median scores for student satisfaction, enrolment and response numbers, and changes in student evaluation of courses.
Course Semester Year Partnership Type Recruitment method Q5* Median # Enr % Rsps Change 1-IT# S1, 2012 Mentee/mentor Low student course evaluation scores 4.0 37 67.6 - - - - - 2-IT S1, 2012 Mentee/mentor Low student course evaluation scores 3.9 108 50 +1.9 S2, 2011 2.0 43 55.8 3-IT S1, 2012 Mentee/mentor Low student course evaluation scores 3.9 52 65.4 +0.9 S1, 2011 3.0 135 62.2 4-IT S2, 2012 Mentee/mentor Low student course evaluation scores 3.5 32 43.8 +0.5 S2, 2011 3.0 142 40.1 5-IT S2, 2012 Mentee/mentor Low student course evaluation scores 3.6 353 31.4 +0.3 S2, 2011 3.3 289 38.1
6-ED## S2, 2012 Mentee/mentor Voluntary 2.9 51 41 +1.4
S2, 2011 1.5 57 40
7-ED S1, 2012 Mentee/mentor Compulsory 3.7 35 31 -
- - - - 8-ART** S2, 2012 Reciprocal Compulsory 3.9 102 34 -0.1 S2, 2011 4.0 103 45 9-ART S2, 2012 4.0 226 44 0 S2, 2011 4.0 120 38 *
Q5=Question Five on the student evaluation of courses: ‘Overall I was satisfied with the quality of this unit’.
**
IT=Information Technology
# ED=Education ## ART=Arts
Table 11. Results for the University of Newcastle courses: Information for the course, partnership type, recruitment method, mean scores for student satisfaction, enrolment and response numbers, and changes in student evaluation of courses.
Course Semester/ Trimester Year Partnership Type Recruitment method Q14* Mean # Enr % Rsps Change 1-BL** T1, 2012 Mentee/mentor Low student evaluation of courses 4.3 111 41.8 +1.0 S2, 2011 3.3 - - 2-BL S2, 2012 Mentee/mentor Low student course evaluation scores 3.7 92 18.5 +0.4 S1, 2011 3.3 65 26.2 3-BL S1, 2012 Mentee/mentor Low student course evaluation scores 3.9 64 20.3 +0.5 S1, 2011 3.4 61 23.0 4-BL S1, 2012 Mentee/mentor Low student course evaluation scores 3.3 63 14.3 +0.5 S1, 2011 2.8 61 13.1 5-BL S2, 2012 Mentee/mentor Low student course evaluation scores 3.4 143 12.6 +0.6 S2, 2011 2.8 146 24.7 6-BL S1, 2012 Mentee/mentor Voluntary 3.9 102 34.3 -0.3 S1, 2011 4.2 104 37.5 7-BL S2, 2012 Mentee/mentor Voluntary 4.3 56 14.3 +1.2 S2, 2011 3.1 52 42
8-EA# S2, 2012 Mentee/mentor Voluntary
≠ 20 20 - S1, 2012 4.1 44 25 9-SIT## S2, 2012 Mentee/mentor Voluntary 4.1 40 40 - - - - - *
Q14=Question 14 on the student evaluation of courses: ‘Overall, I am satisfied with the quality of this course’.
**
BL= Business and Law
#
EA= Education and Arts
##
SIT= Science and Information Technology
≠ Too few responses for quantitative results. Qualitative comments were provided, all of which were
my degree’; ‘Thought this course was exactly what maths teachers should be doing’, and; ‘Everything was clear and well organised’.
Table 12. Results for Griffith University courses: Information for the course, partnership type, recruitment method, mean scores for student satisfaction, enrolment and response numbers, and changes in student course evaluation scores.
Course Semester Year Partnership Type Recruitment method Q6* Mean # Enr % Rsps Change 1-BS** S2, 2012 Mentee/mentor Low student course
evaluation scores
3.9 133 37.6
+0.6
S2, 2011 3.3 242 38.4
2-BS S2, 2012 Mentee/mentor Low student course evaluation scores 3.3 124 47.6 +0.4 S2, 2011 2.9 146 45.9 3-HLTH# S2, 2012
Mentee/mentor Low student course evaluation scores 3.1 175 46.9 +0.6 S2, 2011 2.5 206 34.0 4-HLTH S2, 2012
Mentee/mentor Low student course evaluation scores 3.8 110 42.7 +0.3 S1, 2012 3.5 112 48.2 5-SEET## S2, 2012
Mentee/mentor Low student course evaluation scores 3 165 49.1 +0.6 S2, 2011 2.4 177 33.9 6-SEET S2, 2012
Mentee/mentor Low student course evaluation scores 2.8 115 58.3 +1.0 S2, 2011 1.8 130 45.4 7-BS S2, 2012 Mentee/mentor Voluntary 1.8 63 19.0 - - - - - 8-BS S2, 2012 Mentee/mentor Voluntary 4.1 89 42.7 +0.1 S1, 2012 4 68 47.1 9-SEET S2, 2012 Reciprocal Voluntary 3.8 82 43.9 - - - - - 10-SEET S2, 2012 3.5 79 19.0 - - - - - 11-SEET S2, 2012 Mentee/mentor Voluntary 4.6 37 56.8 - - - - - 12-SEET S2, 2012 4.8 42 45.2 - - - - - *
Q6=question six on the student evaluation of courses: Overall I am satisfied with the quality of this course.
**
BS= Business School # HLTH= Health
##
Table 13. Results for Edith Cowan courses: Information for the course, partnership type, recruitment method, mean scores for student satisfaction, enrolment and response numbers, and changes in student evaluation of courses.
Course Semester Year Partnership Type Recruitment method Q8* Mean # Enr % Rsps Change 1-EA 2012 Reciprocal Voluntary 4.8 9 55.6 -
- - - -
2-EA S2, 2012 Mentee/mentor Voluntary 4.1 35 25.7 +0.7
S1, 2012 3.4 48 31.3
3-EA 2012 Mentee/mentor Voluntary 4.8 16 80 -
- - - - 4-CHS** S2, 2012 Reciprocal Voluntary 4.4 138 44.2 +0.5 S1, 2012 3.9 290 42.1 5-BL S2, 2012 3.3 33 33.3 - - - - - 6-BL S2, 2012 Reciprocal Voluntary 3.9 39 33.3 +0.1 S1, 2012 3.8 37 40.5 7-BL S2, 2012 4.5 26 65.4 +0.2 S2, 2012 4.3 36 36.1 8-BL S2, 2012 Reciprocal Voluntary 4.7 27 55.6 +0.2 S1, 2012 4.5 10 20 *
Q8=question eight on the student evaluation of courses: I am satisfied with this unit (The unit met my expectations in most ways). These scores are given out of 100, but for purposes of
comparison, they have been transformed into scores out of 5.
**
Table 14. Results for the University of the Sunshine Coast courses: Information for the course, partnership type, recruitment method, mean scores for student satisfaction, enrolment and response numbers, and changes in student evaluation of courses.
Course Semester Year Partnership Type Recruitment method Q10* Mean # Enr % Rsps Change 1-SHEE** S2, 2012 Mentee/mentor Voluntary 4.0 245 28.2 - - - - - 2-SHEE S2, 2012 Mentee/mentor Voluntary 4.3 101 33.7 - - - - - 3-SHEE S2, 2012 Mentee/mentor Voluntary 3.7 260 34.7 - - - - - *
Q10=question ten on the student evaluation of courses: Overall, I was satisfied with the quality of this course.
**
Figure