Toward utilization of data for program management and
evaluation: quality assessment of five years of health
management information system data in Rwanda
(Article begins on next page)
The Harvard community has made this article openly available.
Please share how this access benefits you. Your story matters.
Citation
Nisingizwe, M. P., H. S. Iyer, M. Gashayija, L. R. Hirschhorn,
C. Amoroso, R. Wilson, E. Rubyutsa, et al. 2014. “Toward
utilization of data for program management and evaluation:
quality assessment of five years of health management
information system data in Rwanda.” Global Health Action 7
(1): 10.3402/gha.v7.25829. doi:10.3402/gha.v7.25829.
http://dx.doi.org/10.3402/gha.v7.25829.
Published Version
doi:10.3402/gha.v7.25829
Accessed
February 17, 2015 9:20:06 AM EST
Citable Link
http://nrs.harvard.edu/urn-3:HUL.InstRepos:13581263
Terms of Use
This article was downloaded from Harvard University's DASH
repository, and is made available under the terms and conditions
applicable to Other Posted Material, as set forth at
http://nrs.harvard.edu/urn-3:HUL.InstRepos:dash.current.terms-of-use#LAA
SHORT COMMUNICATION
Toward utilization of data for program management and
evaluation: quality assessment of five years of health
management information system data in Rwanda
Marie Paul Nisingizwe
1*, Hari S. Iyer
1,2, Modeste Gashayija
3,
Lisa R. Hirschhorn
2,4,5, Cheryl Amoroso
1, Randy Wilson
3,6, Eric Rubyutsa
3,
Eric Gaju
3, Paulin Basinga
7, Andrew Muhire
3, Agne`s Binagwaho
3,5,8and
Bethany Hedt-Gauthier
1,5,91
Research Department, Partners In Health/Inshuti Mu Buzima, Kigali, Rwanda;2Division of Global Health
Equity, Brigham and Women’s Hospital, Boston, MA, USA;3HMIS Department, Ministry of Health, Kigali,
Rwanda;4Partners In Health, Boston, MA, USA;5Department of Global Health and Social Medicine, Harvard
Medical School, Boston, MA, USA;6Integrated Health Systems Support Project, Management Sciences for
Health, Kigali, Rwanda;7Integrated Delivery, Bill and Melinda Gates Foundation, Seattle, WA, USA;8Geisel
School of Medicine, Dartmouth College, Hanover, NH, USA;9School of Public Health, College of Medicine
and Health Sciences, University of Rwanda, Kigali, Rwanda
Background: Health data can be useful for effective service delivery, decision making, and evaluating existing programs in order to maintain high quality of healthcare. Studies have shown variability in data quality from national health management information systems (HMISs) in sub-Saharan Africa which threatens utility of these data as a tool to improve health systems. The purpose of this study is to assess the quality of Rwanda’s HMIS data over a 5-year period.
Methods: The World Health Organization (WHO) data quality report card framework was used to assess the quality of HMIS data captured from 2008 to 2012 and is a census of all 495 publicly funded health facilities in Rwanda. Factors assessed included completeness and internal consistency of 10 indicators selected based on WHO recommendations and priority areas for the Rwanda national health sector. Completeness was measured as percentage of non-missing reports. Consistency was measured as the absence of extreme outliers, internal consistency between related indicators, and consistency of indicators over time. These assessments were done at the district and national level.
Results: Nationally, the average monthly district reporting completeness rate was 98% across 10 key indicators from 2008 to 2012. Completeness of indicator data increased over time: 2008, 88%; 2009, 91%; 2010, 89%; 2011, 90%; and 2012, 95% (pB0.0001). Comparing 2011 and 2012 health events to the mean of the three preceding years, service output increased from 3% (2011) to 9% (2012). Eighty-three percent of districts reported ratios between related indicators (ANC/DTP1, DTP1/DTP3) consistent with HMIS national ratios.
Conclusion and policy implications: Our findings suggest that HMIS data quality in Rwanda has been improving over time. We recommend maintaining these assessments to identify remaining gaps in data quality and that results are shared publicly to support increased use of HMIS data.
Keywords: health management information system;global health;data quality;quality improvement;data use;Rwanda
Responsible Editor: Peter Byass, Umea˚ University, Sweden.
*Correspondence to: Marie Paul Nisingizwe, Partners In Health, P.O. BOX 3432 Kigali, Rwanda, Email: [email protected]
Received: 25 August 2014; Revised: 19 October 2014; Accepted: 22 October 2014; Published: 19 November 2014
N
ational health data are required for planning and evaluation of service delivery (13). This planning and evaluation is critical in developing countries where the majority of health services are pro-vided through national programs and the limited fundsmust be used efficiently and effectively (14). In these settings, high data quality is important to ensure that decisions reflect program needs and direct health profes-sional education priorities (26). Poor data quality not only contributes to poor decisions and loss of confidence
Global Health Action 2014.#2014 Marie Paul Nisingizwe et al. This is an Open Access article distributed under the terms of the Creative Commons CC-BY
4.0 License (http://creativecommons.org/licenses/by/4.0/), allowing third parties to copy and redistribute the material in any medium or format and to remix,
in the systems, but also threatens the validity of impact evaluation studies (7).
In most countries, health management information systems (HMISs) serve as the primary data source for national health planning and evaluation (2, 4). However, existing evidence suggests variable and often poor quality of this data (715). In 2009, the World Health Organiza-tion (WHO) shared a framework for assessing data quality of HMIS through checks of completeness, internal con-sistency and external concon-sistency (16), offering countries a way to measure data quality and identify gaps.
The Rwanda Ministry of Health (MoH) introduced an electronic-based HMIS in 2008. Given an established elec-tronic system, there is an opportunity to use HMIS data for evaluation purposes and policy making in Rwanda. It can also provide national-level estimates as representa-tive surveys are expensive and can only be done after 35 years, and they do not necessarily provide estimates at the lowest catchment area of service delivery (17). While examples exist of interventions conducted in Rwanda to improve HMIS data quality (1820), no formal assess-ment of quality of Rwanda HMIS data exists. The purpose of this study is to assess the quality of the Rwanda HMIS data from 2008 to 2012.
Methods
Rwanda National HMIS
Prior to 2008, the Rwanda HMIS existed almost entirely in paper form. Rwanda began using an electronic HMIS in 2008 to capture facility healthcare data. Indicators col-lected include service uptake data for key programs (e.g. immunization, family planning, and antenatal care) and general health systems data (e.g. drug availability and financial information). Patient-level data are recorded in paper-based registers by care providers. Data are aggre-gated at the facility-level and monthly reports are sub-mitted to the district team. Prior to 2012, reports were then forwarded to the central MoH office and imported into an electronic system. Since 2012, MoH introduced a web-based system (DHIS2) allowing data entry to be done at the facility. This system allows data to be stored centrally, and the facility to maintain and view their data from a local database. In 2012, there were 922 health facilities in Rwanda, 748 (81%) of which were public. The remaining 174 (19%) were private.
WHO data quality report card
Noting the importance of HMIS data with regards to national and sub-national health sector planning, the WHO introduced the data quality report card framework (16). This framework provides standardized methods for assessing data quality in different low-income settings around the world, and outlines a series of checks that
can be conducted quickly to identify inconsistencies in national HMIS systems.
Data and analysis
Data were extracted from Rwanda’s national HMIS data-base covering all facility reports from January 2008 through December 2012. Using the WHO report card framework (16), we assessed the data quality of the 495 publicly funded health facilities that were open for the duration of the reporting period. The assessment focused on two dimensions of quality: completeness and internal consis-tency of reported data. Ten indicators were included in the assessment, selected based on WHO recommendations and priority areas for the national health sector (Table 1).
Completeness of reported data
Completeness of reporting at health facility and com-pleteness of indicator data in a report were measured on indicators 110 (Table 1).
Completeness of facility reporting
At the national level, completeness of facility reporting was measured as the number of monthly reports received divided by the expected number of reports in a given year (12number of health facilities reporting that year). At district level, the proportion of districts that have facility reporting rates below 80% was calculated. These districts are considered to have poor reporting.
Completeness of indicator data
Completeness of indicator data was measured as percen-tage of values that are not missing values for key indicators. At the national level, this percentage is calculated by summing all the non-missing values across key indicators for a specified period of time and dividing by the expec-ted number (12 months30 districts10 indicators). A district was considered to have incomplete indicator
Table 1. List of indicators included in the HMIS data quality
Indicators I1 ANC1 New ANC registration
I2 ANC4 Women who completed four ANC standard visits I3 OPD Outpatient visits
I4 Deliveries Total deliveries
I5 FP Women who used family planning at the end of the month
I6 Riskrefer Number of patients referred to hospitals I7 DTP1 Children who received diphtheriapertussis
tetanus first dose
I8 DTP2 Children who received diphtheriapertussis
tetanus second dose
I9 DTP3 Children who received diphtheriapertussis
tetanus third dose
I10 U5visit Number of under the age of five children visits
Marie Paul Nisingizwe et al.
2
reporting if it reported more than 20% of missing values across 10 indicators.
Internal consistency of reported data
Extreme and moderate outliers for indicators 110, trends over time for indicators 1, 3, 4, and 9, and internal consistency of I7 (compared to I1) and I9 (compared to I7) were examined.
Moderate and extreme outliers
Moderate outliers were defined as monthly values that were at least 92 standard deviations from the average value of the indicator for a given district for a specified period of time. Extreme outliers were at least 93 stan-dard deviations.
Internal consistency between indicators
Consistency between new Antenatal Care registration (ANC1) and DiphtheriaPertussisTetanus first dose (DTP1) was measured by calculating a DTP1/ANC1 ratio for each district. These ratios were recommended by the WHO framework because the indicators in each ratio are expected to track one another. If the district ratio was 33% different from the national ratio, it was con-sidered to be inconsistent. Consistency between DTP1 and DiphtheriaPertussisTetanus third dose (DTP3) was calculated by dividing total number of DTP3 by the total number of DTP1 for each district. Percentage of districts that have DTP3 immunizations number that are 2% or higher than DTP1 which is a marker of inconsistent were reported.
Consistency over time
The check for consistency over time calculated the ratio of the reported values in 2011 and 2012 for a specific indicator to the mean value of the same indicator for the previous 3 years combined. At the subnational level, this indicator looks at the percentage of districts with at least 33% difference between their ratio and the national ratio, a marker of inconsistency.
Results
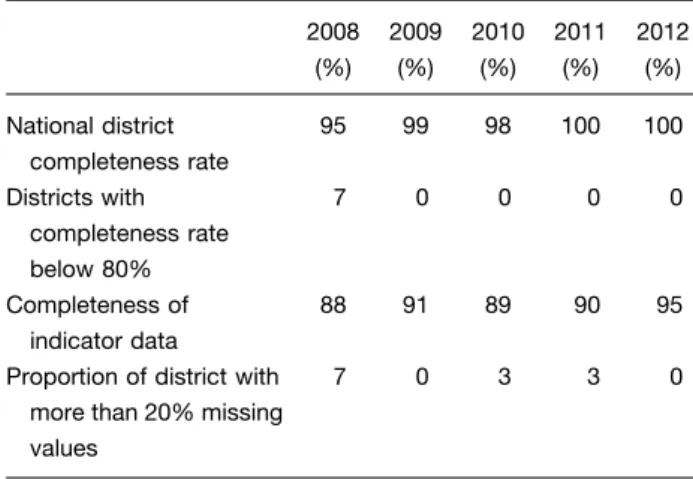
Completeness of facility reporting increased from 2008 to 2012 (Table 2). Seven percent of districts in 2008 reported a completeness rate below 80%, which decreased to 0% in 2012. Completeness of indicator data increased over time from 88% in 2008 to 95% in 2012 (pB0.0001). The proportion of districts with 20% missing values decreased from 7% in 2008 to 0% in 2012.
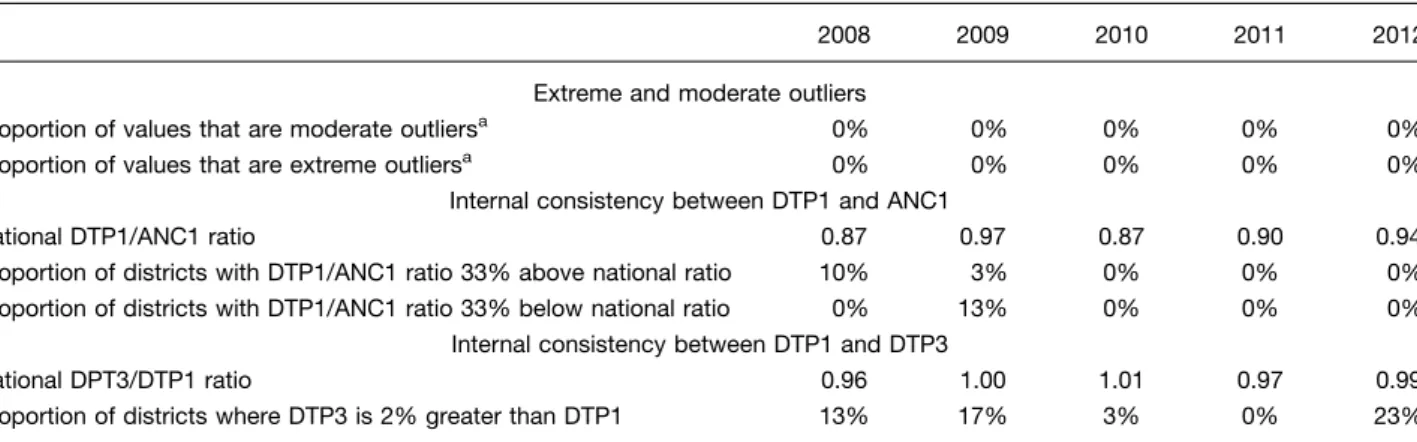
At the national level, the percentage of moderate and extreme outliers was 0% across all years (Table 3). At the sub-national level, no districts reported 5% monthly values that were extreme or moderate outliers. At the facility level, the mean percent of outliers was 4% (2008, 2009, 2010 and 2011) and 3% in 2012. Extreme outliers were found only in 2012 (3%). In 2008, 10% of
districts had DTP1/ANC1 ratios above the national ratio. This percentage decreased to 0% in 2012. In 2009, 13% of districts had DTP1/ANC1 ratio below the national ratio, which decreased to 0% in 2012. The percentage of dis-tricts where the DTP3/DTP1 ratio was 2% was high in 2009 (17%) and 2012 (23%).
Table 4 shows the consistency over time ratios for 2011 and 2012. There was a 21% increase in reported deliveries in 2011 compared to the mean of three preceding years, with a 14% increase in 2012. For the outpatient depart-ment visit ratio, there was a 10% decrease in 2011 and a 13% increase in 2012. For all other indicators, the change was minimal.
Discussion
Overall, our data quality assessment suggests high and increasing completeness of reporting and internal consis-tency of the Rwanda HMIS data. The improvement is likely attributable to interventions implemented in the country by the Rwandan government and non-government orga-nizations to strengthen health systems and improve data quality. Performance Based Financing (PBF) (21), intro-duced in 2010, is one such intervention that may have contributed to improved data quality Since HMIS reports provide data that guided incentives payments for PBF, the MoH established rigorous quality checks of the HMIS data by district supervisors as part of their formative monthly supervision (19, 20, 22). Change in technology from locally based system to a web based system, and trainings on how to use the system and data cleaning done at health facility have also highly contributed to this improvement. This is important because Rwanda’s HMIS data is a data source for local, national and international policy-makers and demonstrating high data quality may encourage the use of this data more broadly (17).
While we found improvement in completeness, other metrics identified potential data challenges. We found devi-ations in the consistency over time measures for deliveries
Table 2. Completeness of facility reporting and indicator data (20082012) 2008 (%) 2009 (%) 2010 (%) 2011 (%) 2012 (%) National district completeness rate 95 99 98 100 100 Districts with completeness rate below 80% 7 0 0 0 0 Completeness of indicator data 88 91 89 90 95 Proportion of district with
more than 20% missing values
and OPD visits. While these findings may indicate poor data quality, they could be explained by increased uptake of services (2123). An increased DPT3/DPT1 ratio could result from migration within a district where the number of children eligible for DPT3 increases or decreases or if more vaccines were given at the beginning or end of a year. Our results contrast with the other published assess-ment of HMIS using the WHO report card framework in sub-Saharan Africa, where they found poor data qual-ity (24). They also differ with most results of different assesments of facility data quality, which also found gaps in data quality pointing to a need for improvement (715). Another study from Mozambique, using a Global Fund methodology, also found high quality for assessed indicators (3).
Our analysis has limitations. First, private health faci-lities were excluded. In 2012, private facifaci-lities accounted for 19% of all facilities in Rwanda and accounted for an estimated 1115% of health service delivery (A. Muhire, personal communication, October 16, 2014). Private faci-lities only started reporting to HMIS in 2012, and due to the difference in implementation time between public and private facilities, we felt they should be analyzed sepa-rately. Second, although chosena prioribased on WHO recommendations and priority areas for the health sector,
we only assessed the quality of 10 indicators captured in the HMIS, limiting our ability to comment on representa-tiveness of quality for the whole system. Finally, we did not assess reliability (consistency between paper registers at facilities) and accuracy (consistency between actual healthcare utilization at facilities and electronic reports) of Rwanda’s HMIS data. Previous studies in Rwanda have looked at data reliability of the HMIS reports from community health workers as compared to register data. These studies found poor reliability of aggregated reports as compared to individual patient data (6). However, the bias was not systematically over- or under-reported and suggested that in aggregate, the errors might cancel out.
Our analysis demonstrates the feasibility of conducting a national assessment of HMIS data quality using the WHO data quality report card framework in a developing country. Since all of the indicators we studied are reported on a monthly basis to an electronic system, these methods can be replicated to provide routine monthly evaluations of HMIS completeness and internal consistency. We rec-ommend maintaining and expanding these assessments for timely identification of HMIS data quality gaps and that all sub-Saharan African countries, including Rwanda, integrate these assessments into routine practice. We believe that routine assessments will lead to overall quality improvement of HMIS data and that this will encourage data use of this valuable system for program management and evaluation. We also hope these findings will allow other researchers to have more confidence in using these data for effective health sector decision-making.
Acknowledgements
The authors thank the HMIS Ministry of Health team, and the Partners In Health monitoring and evaluation team for their enthusiasm and engagement in this research study. The study was conducted as part of the Rwanda Population Health Implementation and Training (PHIT) Partnership, and funded by the Doris Duke Charitable Foundation’s African Health Initiative. BHG received Table 4. Consistency over time: national ratio of total
number of events in the current year to mean number of events in preceding 3 years
2011 2012
ANC1 ratio 1.02 1.02
Deliveries ratio 1.21 1.14
DTP3 ratio 1.00 1.05
OPD ratio 0.90 1.13
Proportion of district with 33% difference between their ratio and national ratio
0% 10%
Table 3. Outliers and internal consistency between indicators (20082012)
2008 2009 2010 2011 2012 Extreme and moderate outliers
Proportion of values that are moderate outliersa 0% 0% 0% 0% 0% Proportion of values that are extreme outliersa 0% 0% 0% 0% 0%
Internal consistency between DTP1 and ANC1
National DTP1/ANC1 ratio 0.87 0.97 0.87 0.90 0.94 Proportion of districts with DTP1/ANC1 ratio 33% above national ratio 10% 3% 0% 0% 0% Proportion of districts with DTP1/ANC1 ratio 33% below national ratio 0% 13% 0% 0% 0%
Internal consistency between DTP1 and DTP3
National DPT3/DTP1 ratio 0.96 1.00 1.01 0.97 0.99 Proportion of districts where DTP3 is 2% greater than DTP1 13% 17% 3% 0% 23%
a
Numeratorsum of occurrences of outliers [92 (3) SD] over the 12 months for the 10 indicators; Denominator120 (number of health facilities12 months10 indicators).
Marie Paul Nisingizwe et al.
4
support from the Department of Global Health and Social Medicine Research Core at Harvard Medical School.
Conflict of interest and funding
The authors have not received any funding or benefits from industry or elsewhere to conduct this study.
References
1. World Health Organization (2003). Improving data quality: a guide for developing countries. Available from: http://www. wpro.who.int/publications/docs/Improving_Data_Quality.pdf [cited 27 July 2014].
2. Kerr K, Norris T, Stockdale R. Data quality information and decision making: a healthcare case study. Proceedings of 18th Australasian Conference on Information Systems. Toowoomba; 2007 Dec 57; pp. 101726.
3. Gimbel S, Micek M, Lambdin B, Lara J, Karagianis M, Cuembelo F, et al. An assessment of routine primary care health information system data quality in Sofala Province, Mozambique. Popul Health Metr 2011; 9: 12.
4. Archangel N. The critical issues affecting the introduction of health management information systems in developing coun-tries in Africa. iicd 2007. Available from: http://www.iicd.org/ about/publications/the-critical-issues-affecting-the-introduction-of-health-management-information-systems-in-developing-coun tries-in-africa [cited 6 August 2014].
5. Chaulagai CN, Moyo CM, Koot J, Moyo HBM, Sambakunsi TC, Khunga FM, et al. Design and implementation of a health management information system in Malawi: issues, innovations and results. Health Policy Plan 2005; 20: 37584.
6. Mitsunaga T, Hedt-Gauthier B, Ngizwenayo E, Farmer DB, Karamaga A, Drobac P, et al. Utilizing community health worker data for program management and evaluation: systems for data quality assessments and baseline results from Rwanda. Soc Sci Med 2013; 85: 8792.
7. Mavimbe JC, Braa J, Bjune G. Assessing immunization data quality from routine reports in Mozambique. BMC Public Health 2005; 5: 108.
8. Mathieu F, Christopher B, Brinkhof MW, Graber C, Boulle A, Spohr M, et al. Electronic medical record systems, data quality and loss to follow-up: survey of antiretroviral therapy pro-grammes in resource-limited settings. Bull World Health Organ 2008; 86: 93947.
9. Makombe S. Assessing the quality of data aggregated by antiretroviral treatment clinics in Malawi. Bull World Health Organ 2008; 86: 31014.
10. Maokola W, Willey BA, Shirima K, Chemba M, Armstrong Schellenberg JRM, Mshinda H, et al. Enhancing the routine health information system in rural southern Tanzania: suc-cesses, challenges and lessons learned. Trop Med Int Health 2011; 16: 72130.
11. Mphatswe W, Mate KS, Bennett B, Ngidi H, Reddy J, Barker PM, et al. Improving public health information: a data quality
intervention in KwaZulu-Natal, South Africa. Bull World Health Organ 2012; 90: 17682.
12. Chahed MK, Bellali H, Alaya NB, Ali M, Mahmoudi B. Auditing the quality of immunization data in Tunisia. Asian Pacific J Trop Dis 2013; 3: 6570.
13. Ndira S, Rosenberger KD, Wetter T. Assessment of data quality of and staff satisfaction with an electronic health record system in a developing country (Uganda): a qualitative and quantita-tive comparaquantita-tive study. Methods Inf Med 2008; 47: 48998. 14. Mate KS, Bennett B, Mphatswe W, Barker P, Rollins N.
Challenges for routine health system data management in a large public programme to prevent mother-to-child HIV trans-mission in South Africa. PLoS One 2009; 4: e5483.
15. Admon AJ, Bazile J, Makungwa H, Chingoli MA, Hirschhorn LR, Peckarsky M, et al. Assessing and improving data quality from community health workers: a successful intervention in Neno, Malawi. Public Health Action 2013; 3: 569.
16. World Health Organization (2014). Guide to the health facility data quality report card. pp. 756. Available from: http://www. who.int/healthinfo/topics_standards_tools_data_quality_analysis/ en/index.html [cited 10 July 2014].
17. Mugeni C, Levine AC, Munyaneza RM, Mulindahabi E, Cockrell HC, Glavis-Bloom J, et al. Nationwide implementation of integrated community case management of childhood illness in Rwanda. Glob Health Sci Pract 2014; 2: 32841.
18. Drobac PC, Basinga P, Condo J, Farmer PE, Finnegan KE, Hamon JK, et al. Comprehensive and integrated district health systems strengthening: the Rwanda Population Health Imple-mentation and Training (PHIT) partnership. BMC Health Services Research 2013; 13: S5.
19. Basinga P, Gertler PJ, Binagwaho A, Soucat ALB, Sturdy JR, Vermeersch CMJ. Paying primary health care centers for per-formance in Rwanda. Policy Working Paper 5190. Washington, DC: The World Bank; 2010.
20. HDP Rwanda (2008). Report on community counter verification in Nyamasheke, Nyanza, Nyaruguru and Rulindo districts. Kigali; 2008. Available from: http://siteresources.worldbank.org/EX TPBFTOOLKIT/Resources/7364043-1386179756147/Round1_ Dec08.pdf [cited 16 October 2014].
21. Logie DE, Rowson M, Ndagije F. Innovations in Rwanda’s health system: looking to the future. Lancet 2008; 372: 25661. 22. Rwanda Ministry of Health (2012). Rwanda health statistics booklet 2011. Available from: http://www.moh.gov.rw/fileadmin/ templates/HMIS_Docs/MOH_Annual_booklet-2011.pdf [cited 5 August 2014].
23. Joharifard S, Rulisa S, Niyonkuru F, Weinhold A, Sayinzoga F, Wilkinson J, et al. Prevalence and predictors of giving birth in health facilities in Bugesera District, Rwanda. BMC Public Health 2012; 12: 1049.
24. World Health Organization (2011). Assessment of health facility data quality report card. Available from: http://www. who.int/entity/healthinfo/country_monitoring_evaluation/UG_ DataQualityReport_final_20120123.pdf ?ua1 [cited 10 July 2014].