Andréanne Léger
Intellectual Property Rights and Innovation around the
World:
Evidence from Panel Data
Discussion Papers
Opinions expressed in this paper are those of the author and do not necessarily reflect views of the institute.
IMPRESSUM © DIW Berlin, 2007 DIW Berlin
German Institute for Economic Research Königin-Luise-Str. 5
14195 Berlin
Tel. +49 (30) 897 89-0 Fax +49 (30) 897 89-200 http://www.diw.de
ISSN print edition 1433-0210 ISSN electronic edition 1619-4535
Discussion Papers 696
Andréanne Léger*
Intellectual Property Rights and Innovation around the
World: Evidence from Panel Data
Berlin, June 2007
* DIW Berlin, Dept. International Economics and Humboldt University, Berlin, Chair for International Trade and Development, aleger@diw.de
Abstract
This article contributes to the literature on innovation and development by identifying the determinants of innovation, and the role of intellectual property rights, in industrialized and developing countries. Controlling for sample selection, I find that, in general, the level of intellectual property protection and a country’s technological capital stock are positively re-lated to research and development investments, while openness to trade has a negative effect. I also find the determinants of innovation to be different for industrialized and developing countries. This is supported by endogeneity tests showing that intellectual property protection is endogenous in industrialized countries, but not in developing countries. However, in both sub-samples, research and development investments Granger-cause intellectual property pro-tection levels, whereas surprisingly, intellectual property propro-tection does not Granger-cause research and development investments.
Keywords: Innovation; intellectual property rights; developing countries; panel data; selec-tion model.
JEL Classification: O30; O34; C23
Acknowledgements
I would like to thank Walter Park for kindly making his dataset available, and Maximilian Auffhammer, Tilman Brück, Peter Haan, Rodney Smith, Spyro Stefanou, Harald von Witzke and Brian Wright for their comments on previous versions of this paper. All remaining errors are mine.
Table of Contents
1 Introduction ... 1
2 Innovation ... 2
2.1 Nature and determinants ... 2
2.2 Empirical Evidence ... 4 2.3 Hypotheses ... 5 3 Data ... 5 4 Estimations ... 8 4.1 Basic Estimations... 8 4.2 Missing Observations... 13 5 Discussion ... 18 5.1 Determinants of Innovation ... 18 5.2 Estimation Issues ... 19
5.3 Innovation and IPR: Specific Issues ... 22
6 Conclusion ... 23
References... 25
List of Tables and Figures
Figure 1 Traditional models of innovation... 3
Table 1 Description of variables... 6
Table 2 Countries... 9
Table 3 Summary Statistics... 10
Table 4 Basic Estimations... 12
Table 5 Percentage of missing values, by sub-sample... 14
Table 6 Heckman Selection Model... 17
Table 7 Correlations... 20
Table 8 Durban-Wu-Hausman Tests of Endogeneity... 21
Table 9 Tests for Granger Causality... 22
1Introduction
1 Introduction
In industrialized countries, intellectual property rights (IPRs) are part of the infrastructure supporting investments in research and development (R&D) leading to innovation. Theoreti-cally, the temporary exclusive rights on inventions granted to inventors allow them to price their products above marginal cost, and hence recoup their initial research investment. Such exclusive right creates incentives for the conduct of R&D. However, by granting monopoly rights on an invention, IPRs impede its dissemination. The resulting underprovision of pro-tected goods and monopoly distortions are considered acceptable costs for the creation of new knowledge and the increase in social welfare that it entails.
However, growing numbers of experts question these affirmations for developing countries (LDCs) and argue that IPRs “do little to stimulate innovation in developing countries” (CIPR, 2002, p. 1). In practice, the standards of education and innovative ability vary among coun-tries, thus making some countries not only more capable of innovating but also facilitating absorption from transfers and spillovers. The development of innovative capacity is based on past performance of R&D, which enhances the firm’s ability to assimilate and exploit existing information (Cohen and Levinthal, 1989). Many LDCs have low innovative capabilities and are dependent on industrialized countries for the provision of new technology and knowledge (Aubert, 2005). Hence IPRs may provide incentives for innovation but there is limited local technological capacity to react to these incentives.
The institutional environment in LDCs is often characterized by the presence of high transac-tion costs, which often include corruptransac-tion (Collier, 1998), and by weak institutransac-tions (Stiglitz, 1989). In some countries, the importance of transaction costs might be high enough to hamper the incentive effect (Léger, 2005), and the quality of the institutions, especially the legal sys-tem, directly affects the effectiveness of IPRs.
Still, IPRs are an important issue in bilateral, regional and multilateral trade negotiations. Pressure is put on LDCs to sign up for stronger standards of IP protection without having a clear picture of the impacts IPRs have on innovation in these economies (Fink and Maskus, 2005).
This study hence investigates the role of IPRs for innovation and contributes to the literature on innovation and development by identifying the determinants of innovation, and the role of
2Innovation
IPRs, in industrialized and developing countries. I use previous static models (Kanwar and Evenson, 2003) as a basis and then extend these estimations to control for the quality of the institutional environment and past R&D activities.
Controlling for sample selection, I find that in the full sample, the level of intellectual prop-erty protection and a country’s technological capital stock are positive and significant regres-sors explaining R&D investments, while openness to trade has a negative effect. I also find the determinants of innovation to be different for industrialized and developing countries. This is supported by the endogeneity tests that show that intellectual property protection is endogenous in industrialized countries, but not in developing countries. However, in both sub-samples, research and development investments Granger-cause IP protection levels but surprisingly, IP protection does not Granger-cause research and development investments.
The rest of the paper is organized as follows. Section 2 reviews the theoretical and empirical literature on IPRs and innovation. Section 3 presents the data used, section 4 discusses the estimation procedures and their results, that are analyzed in section 5. Section 6 concludes.
2 Innovation
2.1 Nature and determinants
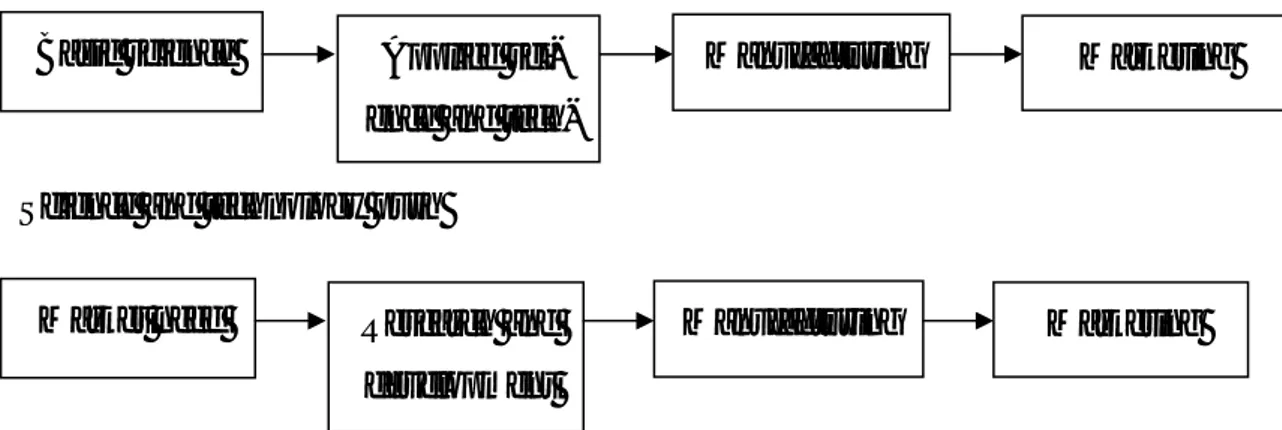
Past models of innovation presented innovation as a linear phenomenon (see figure 1). How-ever, such models, in which innovation is either seen as exogenous and driven solely by sci-entific advances, or conversely as responding only to demand for new products and processes, did not survive empirical scrutiny.
Both demand-pull and technology-push factors play a role for innovation but they are interre-lated (Kline and Rosenberg, 1986). Innovation can be motivated by increased profits or mar-ket share, secured by IPRs or other mechanisms (e.g., first-mover advantage, secrecy) which motivates investments in innovative activity, or react to “demand-pull” factors (Schmookler, 1972), i.e., the perceived demand for new products and processes. Conversely, “technology-push” factors, where advancements in technology and science allow for the development of new products and processes also play an important role (Cohen and Klepper, 1996).
The environment in which a firm operates affects its innovative performance. At the macro-economic level, macro-economic and political stability (Lall, 1992) provides an environment
2Innovation
tive of innovation. International competition and openness to trade also affect incentives to innovate, however these impacts can vary (Grossman and Helpman, 1991). At the firm level, given that R&D is an expensive endeavor, cost of, and access to capital are important aspects. Finally, qualified scientists and workers are essential inputs into the innovation process, there-fore the level of human capital in a country is another important factor (Crespo et al., 2004).
Figure 1 Traditional models of innovation
Science and technology push
Basic science Applied
sci-ence and
tech-Manufacturing Marketing
Market need Research and
development
Manufacturing Marketing
Demand-pull
Source: Granstrand (1999)
Though innovation could theoretically play a crucial role for economic development in LDCs (Commission for Africa, 2005; UN Millennium Project, 2005), most of the literature so far has focused on industrialized countries – except for North-South models, where the differ-ences are explicitly taken into account.1 However, a different treatment could be warranted given that LDC characteristics differ from common assumptions. Demand-pull factors could have a limited impact in LDCs: given the low level of economic development and the unequal distribution of income, the effective domestic demand is usually small2 (Foellmi and Zweimüller, 2006). The demand side is often neglected but the expansion of domestic de-mand is critical for economic growth, and for the performance of innovation addressing local needs (UNCTAD, 2006). As was already mentioned, markets are often incomplete, weak or non-existent (Lall, 1995) which has important implications for the conduct of innovative activities, especially in areas such as capital (financial and human) and information. The
1 See among others Chin and Grossman (1990), Deardorff (1992), Helpman (1993), Zigic (1998).
2Innovation
tutional environment is characterized by the presence of high transaction costs and by weak institutions, which affect the functioning of the market. Finally, the performance of IPRs, a market-based tool, in malfunctioning markets, is still underresearched.
2.2 Empirical Evidence
A few studies examine the link between IP protection and innovation for panels of countries. Alfranca and Huffman (2003) use a panel of European countries to estimate the effects of economic incentives and institutions on private innovation in agriculture, and find the level of IP protection, institutional quality, economic openness and the lagged value of agricultural production to be positive and significant factors. Conversely, the cost of capital and the lagged value of crop production have (significant) negative impacts.
Kanwar and Evenson (2003) investigate the determinants of innovation and technological change, proxied by total R&D investments as a proportion of GNP, in a sample of industrial-ized and developing countries. They obtain similar results: IP protection, credit availability, demand-pull factors, trade openness and human capital positively affect innovation, while political instability and interest rate have a negative effect. Varsakelis (2001) also concludes that IP strength is an important determinant of R&D intensity but neither him nor Kanwar and Evenson consider the impact of past innovative activity.
This is done by Lederman and Maloney (2003), who use a dynamic GMM system estimator. They find that interest rate and risk negatively affect aggregate private and public R&D in-vestments, while past R&D inin-vestments, credit market depth, IP protection, and the quality of research institutions are positive and significant explanatory factors. However, GMM estima-tors rely on asymptotic properties, hence estimates can be biased for small samples like theirs.3 They also do not control for the quality of institutions, which could be captured by the IP index, nor for the level of development of the countries. Finally, they choose to esti-mate certain variables and not others in logarithmic form, violating the assumptions on the distribution of their regressors (e.g., estimating most variables in levels but the IP index in logarithmic form).
2 Obvious exceptions are large countries such as India, China and Brazil.
3 It is not clear from the paper if the authors use the correction for small samples developed by Windmeijer (2005).
3Data
A recent article (Higino Schneider, 2005) investigates the role of trade, FDI and IPRs in ex-plaining innovation. It finds that the coefficient of the IP index is significant and positive for the whole sample and the sub-sample of industrialized countries, while it is negative and not significant for the LDC sub-sample. Contrary to the other studies, the number of patent appli-cations in the US is used as a proxy for innovation. Patenting activity might be closely related to the export structure of the economy (Blind et al., 2006), which is not controlled for. Fi-nally, past innovative activity is not taken into account. Another study, looking at innovation in five East Asian countries (Hu and Mathews, 2005) also finds the role of IPRs on innovation to be negative and rather to be linked to the existing stock of patents, the levels of R&D man-power, of R&D expenditures by the private sector, and to industrial specialization.
2.3 Hypotheses
The impact of IPRs on innovation in LDCs is theoretically not clear, and the empirical evi-dence available indicates that it might be different for industrialized and developing countries. This paper hence tests the propositions that:
- IP protection is a significant factor affecting innovation;
- The determinants of innovation are different for developing and industrialized
coun-tries.
The estimations tackle issues that have been either ignored or inadequately addressed in pre-vious empirical studies, namely the impact of the quality of institutions and the importance of past innovative activity, and missing observations. These aspects are discussed in the next sections.
3 Data
I built a panel dataset comprising 22 industrialized and 76 developing countries. The data have been obtained from several sources (UNESCO, World Development Indicators, etc., see table 1) as well as from local statistical offices. The availability of data is problematic, espe-cially for LDCs: several countries are altogether absent from the sample, and data points are also missing. This issue is discussed in more detail in the next section.
3Data
The dataset uses average annual data for seven 5-year sub-periods (1965-1995). Table 1 pre-sents the variables considered in the estimations, along with the expected signs of the parame-ters, and their sources.
Table 1 Description of variables
Expected
Sign Variable Source
Dependent variable
Innovation RDGDP: Total R&D expenditures as a
proportion of GDP (5-year average) UNESCO statistical yearbooks (various years), RICYT
Explanatory variables
Technology-push factors
+ RDSTOCK: R&D stock UNESCO statistical
year-books, RICYT Demand-pull
factors +
+
ΔGDPPC: ratio (GDPt/GDPt-1) of gross
domestic product per capita (constant 2000 US$)
POP: Population (latest year)
World Development Indicators (WDI) (World Bank, 2005) IP protection +/- IP: Index of IP protection Park and Ginarte (1997), Park
(2002) Access to capital + LAG_SAV: Saving as a proportion of
GDP (lagged one period) WDI (2005)
Cost of capital
Human capital + - INTRATE: Real interest rate EDU: Years of schooling, above 15 WDI (2005) Barro-Lee data set (2000) Macroeconomic
instability - INF: Inflation WDI 2005
Political instability - POL: State failure events dummy Constructed from State failure task force (2007)
Competition
Institutional quality +/- + OPEN: Openness to trade INS: Index of the quality of institutions Penn World Table 6.1(2002) Fraser Institute (2005)
Innovative effort is proxied by total R&D expenditures as a proportion of GDP. IPRs are expected to provide incentives for private R&D, but the classification of R&D tends to be between productive and non-productive sectors, and these series are not stable over time. Data on private R&D are in general not available for LDCs, hence working with aggregate R&D expenditures allows including more LDCs in the sample4. This could cause the coefficient of the IP protection index to be biased. Furthermore, errors in measurement could also bias the estimation coefficients, it is hence difficult to determine the direction of the bias.
The importance of past innovative activity is represented by the capital stocks of past R&D investments. The capital stock variable is built using a depreciation rate of 15%, which is
4 One must also acknowledge that a high proportion of R&D taking place in LDCs is conducted by the public sector.
3Data
consistent with other empirical studies in the literature.5 The demand-pull factors are ac-counted for by the ratio of current to lagged GDP per capita,6 to capture the change in de-mand. Another possibility would be to include the lagged dependent variable as a regressor to estimate a dynamic model. However, past R&D investments over several periods are poten-tially important to explain current innovative activity, and not only investments that occurred in the last period, hence using the technological capital stock appears more sensible. More-over, the results of dynamic estimations with missing observations are not reliable; hence this model is not used here.
Intellectual property protection is proxied by a time-varying index that covers 5 categories of patent law: extent of coverage, membership in international agreements, provisions for loss of protection, enforcement mechanisms and the duration of protection7 (see Park and Ginarte, 1997).
Important inputs in the innovation process are financial and human capital, that are accounted for by savings as a proportion of GDP (lagged one period) and the average years of schooling in the adult population, respectively. The cost of capital (deposit interest rate) is also used as a regressor. I use inflation and a state failure dummy to account for macroeconomic and politi-cal instability, as these are likely to negatively affect the conduct of innovation. Finally, other control variables are the level of openness to trade, whose theoretical effect is unclear, and the quality of the institutions, as represented by the index of economic freedom (Area 2: legal structure and security of property rights) of the Fraser Institute.
Estimations are performed on three sub-samples: industrialized countries, developing coun-tries and the whole sample (see table 2). Least-developed councoun-tries are underrepresented in this dataset: data are not available for the periods covered, which could affect the representa-tivity of the sample – these issues are discussed in more detail in the next section. Table 3 presents the summary statistics.
From this table, it is clear that industrialized and developing countries are different: the means are significantly different for the two sub-samples for most variables. The exception is the variable interest rate, where the standard deviation for LDCs is so large that the mean of the
5 Recent articles (Bitzer, 2005; Bitzer and Stephan, 2007) develop a Schumpeter-inspired approach to the con-struction of R&D capital stocks but it seems more appropriate when working with industry-level data.
6 All variables are estimates in natural logs, hence this variable represents the difference in logs. 7 I would like to thank Walter Park for kindly making his dataset available.
4Estimations
industrialized country sub-sample is included in it. This supports the need to consider these two sub-samples separately in the estimations.
4 Estimations
4.1 Basic Estimations
I start by estimating a static model similar to that of Kanwar and Evenson (2003), which does not take prior innovative activity into account. Based on the review of the theoretical and empirical evidence (see section 2) I derive the following estimation model
RD = f(ΔGDPPCt, POPt, IPt, SAVt-1, INTRATEt, EDUt, INFt, POLt, OPENt) (1)
Country panel datasets usually use fixed effects models, in which country individual effects, often unobservable and assumed constant over time, are estimated. The unobserved country characteristics are assumed to be correlated with the error term, which, if ignored, leads to biased estimates. However, results of Hausman specification tests8 for the full sample do not
lead to the rejection of the null hypothesis (coefficients estimated by the efficient random effects estimator are the same as the ones estimated by the consistent fixed effects estimator). Hence, the equations are estimated using random effects, since this estimator is more effi-cient.
8 The Hausman test assumes homoskedasticity and no autocorrelation in the residuals. The Wooldridge test for autocorrelation in panel data found no first-order correlation, while performing the Breusch-Pagan test leads to the rejection of the null hypothesis of constant variance in the sample. I hence perform robust estimations.
4Estimations GDP per capita < 600$ (23) 600$ < GDP per capita <1 000$ (12) 1 000$ < GDP per capita < 1 600$ (8) 1 600$ < GDP per capita < 3 000$ (12) 3 000$ < GDP per capita < 5 000$ (10) 5 000$ < GDP per capita (11) Industrialized Countries (22) Benin, Burundi, Central African Republic, Ghana, Haiti, India, Kenya, Liberia, Madagascar, Malawi, Mali,
Mauritania, Nepal, Niger, Pakistan, Rwanda, Senegal, Sierra Leone, Sudan, Tanzania, Togo, Uganda, Zambia. Angola, Bolivia, Cameroun, Cote d'Ivoire, Guyana, Honduras, Indonesia, Nicaragua, Papua New Guinea, Philippines, Sri Lanka, Zimbabwe. Ecuador, Egypt, Guatemala, Iran, Morocco, Para-guay, Swaziland, Syrian Arab Re-public. Algeria, Bot-swana, Colom-bia, Dominican Republic, El Salvador, Fiji, Jordan, Peru, South Africa, Thailand, Tuni-sia, Turkey. Brazil, Chile, Costa Rica, Gabon, Grenada, Jamaica, Malaysia, Mauritius, Mexico, Panama. Argentina, Cyprus, Hong Kong, Israel, Korea, Malta, Saudi Arabia, Singapore, Trinidad and Tobago, Uruguay, Venezuela. Australia, Austria, Belgium, Canada, Denmark, Finland, France, Germany, Greece, Iceland, Ireland, Italy, Japan, Netherlands, New Zealand, Norway, Portugal, Spain, Sweden, Switzerland, United Kingdom, USA . Table 2 Countries
Note: GDP per capita in 2000 constant US dollars, ranking based on 1995 figures.
4Estimations Variables Developing Countries (76) Industrialized Countries (22) Total Sample (98)
Mean Std. Dev. Mean Std. Dev. Mean Std. Dev. R&D investments as a proportion of
GDP (%) **
0.093 0.326 1.450 0.749 0.696 0.874 GDP per capita (constant 2000 US$) ** 1 841 2 727 15 291 6 865 4 814 6 882
IP protection index ** (0<IP<7) 2.259 0.617 3.201 0.659 2.462 0.736
Saving as proportion of GDP (%) ** 17.334 10.730 24.259 5.253 18.749 10,246
Real interest rate 169.45 2 105 7.848 5.072 127.09 1809
Years of schooling, adult population ** 3.608 2.058 7.897 2.104 4.690 2.784
Inflation rate ** 48.50 293.35 7.612 6.631 38.771 256.635
Openness to trade (%GDP) ** Institutional quality (0<INS<7) ** Population (millions) ** 65.571 5.048 3 235.6 50.364 1.158 232.18 44.338 6.529 33.338 24.165 0.864 50.611 60.864 5.453 2 515.8 46.693 1.271 5 210.3 Table 3 Summary Statistics
Note: ** means of developing and industrialized countries significantly different at the 5% level
The econometric model estimated is
, i = 1, …, N; t = 1, …, T (2)
with and . The are assumed independent of and , which
are also independent of each other for all i and all t. refers to R&D investments as a pro-portion of GDP for country i at time t, and is a vector of k regressors for the country i at time t. All variables are taken in logs, except for the dummy variable of political failure, and the equations are estimated using Stata 9. Table 4 presents the results of these estimations.
The results of the static estimations (Model (1)) using the full sample are similar to those obtained by Kanwar and Evenson: IP protection and the level of education are positive and significant, however in their estimations the availability of financial capital in the previous period (LAG_SAV) is positive and significant, which is not the case here. Kanwar and Even-son however use a dummy variable to account for the openness of the economy (the black market premium) which is not significant in their estimations, while the openness of the economy is here negative and significant at the 1% level. Results of the Ramsey regression specification error test (RESET) reject the null hypothesis that the model has no omitted vari-ables.
4Estimations
Conducting these estimations on the two sub-samples shows different patterns: while IP pro-tection and the level of education are positive and significant in both sub-samples, in industri-alized countries the availability of financial capital is positive and inflation is negative, and significant. In LDCs, the change in demand is positive and significant9 but openness to trade
is negative and significant. The variable accounting for political instability has not been in-cluded in the regressions with the industrialized countries sub-sample since though political failures do occur in these countries, their extent is most of the time limited and does not affect the functioning of the state as is more often the case in LDCs. However, though not signifi-cant, some coefficients do not present the expected sign, for example the ratio of change in GDP is negative for the industrialized country sub-sample, whereas the interest rate presents a positive coefficient in the LDC sub –sample.
Alfranca and Huffman (2003) have found institutional quality to be an important determinant of innovation, and the quality of institutions is significantly lower in the LDCs (see table 3). Model (2) hence controls for the quality of institutions: the effect of institutional quality could otherwise be captured by another variable. Interestingly, the coefficient is positive but not significant in all the samples and leaves the other coefficients more or less unchanged.
Exceptions are the coefficient of inflation in the industrialized country sub-sample, and the level of education in the LDC sub-sample, that are now not significantly different from zero. The level of human of human capital is highly correlated with the index of institutional qual-ity (0.5818 correlation for the full sample, 0.5919 for the industrialized country sub-sample, and 0.2708 for the LDC sub-sample), hence multicollinearity could explain the lack of sig-nificance of the coefficients.
9 The other regressor accounting for demand-pull factors, the size of the population, was not found to be signifi-cant in any of the regressions and sub-samples, these estimations are hence not presented here.
4Estimations
Table 4 Basic Estimations
Full sample IC LDC (1) (2) (3) (1) (2) (3) (1) (2) (3) ΔGDPPC 0.278 (0.210) 0.299 (0.212) 0.121 (0.235) -0.168 (0.133) -0.154 (0.132) -0.149 (0.117) 0.987** (0.440) 0.988** (0.439) (0.283) 1.036* IP 2.056*** (0.651) 2.026*** (0.655) 1.092** (0.554) 0.656** (0.280) 0.563** (0.254) (0.134) -0.079 1.375*** (0.488) 1.493*** (0.491) 1.408*** (0.332) LAG_SAV 0.236 (0.150) (0.159) 0.226 (0.259) 0.099 0.580*** (0.180) 0.556*** (0.185) (0.144) 0.070 (0.282) 0.314 (0.287) 0.233 (0.283) 0.145 INTRATE 0.204 (0.316) 0.118 (0.309) 0.202 (0.264) -0.040 (0.105) -0.059 (0.108) -0.309*** (0.141) 0.479 (0.379) 0.357 (0.390) 0.375 (0.335) EDU 2.011*** (0.398) 1.608*** (0.396) 0.948** (0.463) 0.717** (0.302) 0.646** (0.320) 0.520*** (0.171) 0.926** (0.470) (0.489) 0.590 (0.567) 0.952 INF -0.246 (0.236) -0.094** (0.281) (0.296) -0.045 -0.153** (0.071) (0.084) -0.113 (0.083) 0.109 (0.356) -0.388 (0.411) -0.306 (0.477) -0.353 POL -0.794 (0.507) -0.851* (0.511) (0.558) -0.093 - - - (0.583) -0.473 (0.586) -0.652 (0.581) -0.217 OPEN -1.370*** (0.443) -1.637*** (0.420) -1.000*** (0.373) (0.154) 0.103 (0.161) 0.081 (0.056) -0.005 -1.674*** (0.558) -2.120*** (0.515) -2.070** (0.759) INS - 1.657 (1.230) 1.011 (1.160) - 0.379 (0.417) -0.690 (0.545) - 1.630 (1.555) 1.887 (1.480) RDSTOCK - 0.486*** (0.130) - - 0.664*** (0.064) - - (0.213) 0.185 Constant -3.148 (2.121) (2.885) -4.334 (2.291) -2.465 -3.925*** (1.127) -4.257*** (1.197) (0.993) 0.262 (2.674) -1.399 (3.805) -1.474 (3.964) -1.619 R2 0.6189 0.5796 0.7937 0.6204 0.6193 0.9018 0.5385 0.5471 0.6390 F test 159.54 (0.0000) (0.0000) 154.62 (0.0000) 438.21 (0.0000) 104.76 (0.0000) 110.32 (0.0000) 58.37 (0.0000) 65.16 (0.0000) 64.62 (0.0000) 31,53 Number of groups Number of observations 52 133 51 131 47 117 20 67 20 67 20 62 32 66 31 64 27 55 Note: standard errors in parenthesis. *, **, ***: significant at the 10, 5 and 1% level, respectively. (1): basic estimations; (2): estimations with institutional qual-ity; (3) estimations with technological capital stock. The list of countries included in each estimation is presented in table 2 in appendix.
4Estimations
Finally, the importance of past scientific and technological activities is taken into account in model (3). The coefficient in the full sample and for industrialized countries is positive and highly significant, as expected, but is not significant in the LDC sub-sample. Given the magnitude of investments in R&D, and the level of technological capabilities, past R&D investments might play a more important role in industrialized countries than in LDCs. The introduction of this regressor has few impacts on the other regressors: for the full sample, the political instability dummy is not significant anymore, though still nega-tive, and the magnitude of the coefficients in the LDC sub-sample is affected, but the significance levels are not. For the industrialized countries, the coefficient of the interest rate is now significantly different from zero (and still negative) while surprisingly, the coefficient on IP protection is now negative, though not significant. Again, the correla-tion between these two variables is high (0.7086 for industrialized countries), which could explain this result. For all three samples, the RESET test does not reject the hy-pothesis that there is no missing variable in model (3).
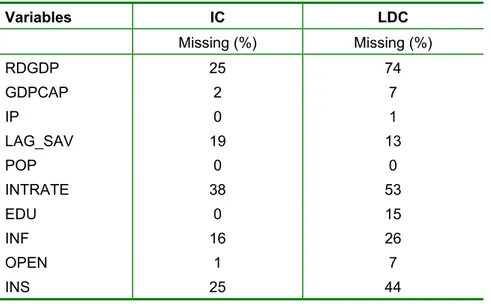
4.2 Missing Observations
An important issue is obviously the one of missing observations. For some countries (especially LDCs) data points are missing, which reduces the number of countries in-cluded in the estimations and hence affects their quality. The prevalence of missingness is shown in table 5. The total number of countries in the sample could be as high as 98 but missing observations bring this figure down to a maximum of 52 countries in the estima-tions presented in table 4. A complete case analysis, as performed by Kanwar and Even-son, can lead to substantial efficiency losses (Little and Rubin, 2002), even if the estima-tor is unbiased when the data is missing completely at random (MCAR).10 One way to correct for this problem, under the assumption of MCAR, is multiple imputation. In the first step, plausible values for missing observations are created based on the relationship observed between the non-missing covariates. These values are then used to complete the
10 The missing completely at random assumption implies that missingness is not related to any factor, known or unknown, in the study.
4Estimations
dataset by drawing the missing observations and create m “completed” datasets. The data are then analyzed using normal, complete data methods, and the results are combined to take the uncertainty of the imputation into account (Horton and Kleinman, 2007).
Table 5 Percentage of missing values, by sub-sample
Variables IC LDC Missing (%) Missing (%) RDGDP 25 74 GDPCAP 2 7 IP 0 1 LAG_SAV 19 13 POP 0 0 INTRATE 38 53 EDU 0 15 INF 16 26 OPEN 1 7 INS 25 44
In the present case, the data are more likely to be “missing not at random” (MNAR), which means that the missingness depends on unobserved quantities (of outcomes or covariates). For example, more observations are missing for LDCs, so the missingness pattern could be related to the level of economic or institutional development. In such a case, the missingness pattern is nonignorable and cannot be solved with imputation of the missing data points; hence a model to address this issue must be developed.
The situation could be modeled as one in which an incompletely observed variable (Y1 or
in this case RDGDP) with a linear regression on covariates, is observed if and only if the value of another completely unobserved variable (Y2, a country’s reporting capacity in
this case) exceeds a threshold, for example zero. The model can be formulated as follows (Puhani, 2000):
(3a)
4Estimations
if >0 (3c)
if 0 (3d)
where and are unobserved, whereas is observed. It is commonly assumed that
and have a bivariate normal distribution:
(4)
Heckman (1979) proposed a method to estimate the inverse of Mill’s ratio ( )
(5)
where is a monotone decreasing function of the probability that an observation is
se-lected into the sample. It is estimated by way of a probit model and is then included into equation (6):
(6)
which is the second stage. The sample selection problem is hence treated as a special case of the omitted variable problem, with being the omitted variable if OLS were used on
the subsample for which > 0.
Given that the Hausman tests on the previous estimations always favored random effects over fixed effects, I estimate the first step using a probit model with random effects, and then use these results to calculate . I then include as an explanatory variable in the
selec-4Estimations
tivity bias. If is significantly different from zero, there is evidence of a sample selection
problem.
Table 6 presents the results. For the selection equation, I hypothesize that the “capacity to report” depends on political stability (state failure dummy, POL) and the level of devel-opment, proxied by GDP per capita. Indeed, both variables are significantly different from zero. In the second-stage equation, is significantly different from zero at the 5%
level, which confirms that there is a sample selection problem. Hence taking into account the fact that some countries have a low capacity to report data on innovation, IPRs and past R&D investments positively affect R&D investments, while openness to trade nega-tively affects the performance of innovation.
However, the Heckman procedure has been criticized, since although it is consistent, it is inefficient, and the procedure also introduces a measurement error problem in the second stage estimation since an estimate of the expected value of the error term is used. The collinearity between the regressors in the first and second stages is especially problem-atic, which is the reason why the variable accounting for political instability (POL) is not used as a regressor in the second stage. Finally, it is not recommended for small samples, hence has not been performed on the two sub-samples. Overall, while these are important qualifications that should be kept in mind, the evidence provided here of sample selection sheds a different light on the importance of the missing data problem, and the need to take it into account.
4Estimations
Table 6 Heckman Selection Model 1st Stage GDPCAP 0.534*** (0.107) POL 0.489*** (0.159) Constant -4.301*** (1.005) F-Test Number of observations 37.75 (0.0000) 738
2nd Stage Robust estimation (RE)
MILLS -2.040** (1.037) ΔGDPPC 0.074 (0.250) IP 1.047** (0.529) LAG_SAV 0.027 (0.274) INTRATE 0.377 (0.268) EDU 0.135 (0.538) INF -0.175 (0.321) OPEN -0,989*** (0.332) INS 1.171 (1.098) RDSTOCK 0.359** (0.162) Constant -0.058 (2.870) F Test Number of observations Number of countries 372.51 (0.0000) 117 47
5Discussion
5 Discussion
5.1 Determinants of Innovation
Taking into account the sample selection bias does not really affect the results for the whole sample. In the original estimations, the strength of IP protection, the level of edu-cation in the population and past R&D investments were positive and significant factors affecting innovation, and openness to trade was significant but negative. These stay un-changed, except for the level of human capital that is not significant anymore, but the magnitude of the significant coefficients has decreased. In the original estimations, a 1% increase in IP strength would increase R&D investments by 1.09%, while taking the selection bias into account, a 1% increase in IP protection would increase R&D invest-ments by 1.04%. Therefore, the results obtained with the original estimations – including the technological capital stock variable – seem to be reliable.
Across sub-samples, it is interesting to see that while the technological capital stock is an important determinant of innovation in the full sample and in industrialized countries, it is not in the LDC sub-sample. This could be explained by the duality of LDC economies, or more generally due to the transaction costs hampering the transfer of information among firms or from the public to the private sector. However, it could also be due to errors in the data, that could either introduce a bias or increase standard errors. Indeed, supplementary regressions (not shown here) including an interaction term between the institutional quality index and the technological capital stock do not yield different results and the interaction term is not significantly different from zero. Similarly, including also the squared technological capital stock as a regressor does not affect other coefficients, and its own coefficient is not significantly different from zero.
The demand-pull factors, i.e., the ratio of change in GDP, are only significant in the LDC estimations, in all models. Though these estimations are not presented here, the use of the size of the population as another measure of demand-pull factors is not significantly
dif-5Discussion
ferent from zero and does not affect the other coefficients in the different models. How-ever, the IP protection index is consistently positive and strongly significant, except for model (3) for the industrialized country sub-sample. From these results, it is clear that, for industrialized countries, once controlling for the quality of institutions and past R&D investments, the strength of IP protection is not significant anymore.
The level of human capital is also positive and significant for the full sample and the industrialized country sample, but not for LDCs. Another difference between industrial-ized and developing countries is exemplified by the coefficient on openness to trade: it is negative and consistently significant for LDC estimations, which seems to drive the re-sults for the whole sample, but it is not significant for the industrialized country regres-sions. Openness to trade might be supporting innovation in industrialized countries, whose technological capacities allow them to take advantage of technology spillovers from trade partners. Conversely, the level of technological capabilities amongst firms and research institutes in LDCs is in general lower (and more heterogeneous), and they might not benefit from spillovers to the same extent. This is supported by empirical evidence that R&D spillovers are especially important when countries are trading with trade part-ners with higher technological capabilities (Coe et al., 1997).
Overall, my results support the hypothesis that IP protection is a significant and positive factor affecting innovation, which is consistent with results from other empirical studies. They also lend strong support to the hypothesis that the determinants of innovation are different among industrialized and developing countries, which is in line with the find-ings of recent articles (Higino Schneider, 2005; Hu and Mathews, 2005), even if these use different data. However, these results also raise several estimation issues that are discussed in the next section.
5.2 Estimation Issues
Several estimation issues need to be taken into account. An important difficulty in identi-fying the determinants of innovation and, more precisely, attempting to assess the role of IP protection, is the correlation among regressors, and more specifically between IP pro-tection and other regressors. Table 7 presents the pairwise correlations.
5Discussion
For the full sample, the correlations between the main regressors are consistently high (above 0.40), the exception being the openness variable: it is only correlated with the institutional quality index. Not surprisingly, the STATUS variable (dummy indicating a developing country) is negatively correlated with most regressors.
Table 7 Correlations
Full Sample RDGDP IP EDU GDPCAP INS OPEN
RDGDP 1 IP 0.7230* 1 EDU 0.6954* 0.5934* 1 GDPCAP 0.8400* 0.6548* 0.7713* 1 INS 0.5978* 0.4820* 0.5818* 0.6278* 1 OPEN -0.1556 0.0223 -0.0346 -0.0715 0.2592* 1 STATUS -0.7612* -0.5784* -0.6412* -0.7962* -0.5482* 0.2048* Industrialized Countries
RDGDP IP EDU GDPCAP INS OPEN
RDGDP 1 IP 0.6401* 1 EDU 0.4667* 0.4080* 1 GDPCAP 0.6763* 0.5473* 0.6072* 1 INS 0.5427* 0.5381* 0.5967* 0.5141* 1 OPEN -0.0220 0.1390 0.1631* 0.2463* 0.2758* 1 Developing Countries
RDGDP IP EDU GDPCAP INS OPEN
RDGDP 1 IP 0.2978* 1 EDU 0.3722* 0.3263* 1 GDPCAP 0.2233* 0.3161* 0.6447* 1 INS 0.1144 0.0817 0.2708* 0.3374* 1 OPEN -0.1420 0.2010* 0.1247 0.1878* 0.4566* 1 Note: * significant at the 1% level
For the sub-samples, the picture is different: in industrialized countries, openness is posi-tively correlated with the level of education, GDP per capita and institutional quality, and all other regressors are highly correlated with another. For LDCs, the correlations are a lot weaker. Interestingly, IP protection is positively and significantly correlated with openness to trade for LDCs, but not for industrialized countries, which could be due to the fact that, for most LDCs, IP strengthening is a result of trade negotiations (Jaffe and van Wijk, 1995). This however raises the question of the possible endogeneity of the IPRs variable.
5Discussion
This is tested using the Durban-Wu-Hausman test of endogeneity, a test of the signifi-cance of the residual variable in the augmented regression, following Davidson and MacKinnon (1993). The results, presented in table 8, show that the IP protection index is indeed endogenous for the full sample, as well as for industrialized countries, but not for LDCs.
The parameter estimates are therefore biased. However, addressing the endogeneity prob-lem requires instrumental variable techniques and the search for appropriate instruments – highly correlated with IP protection but not with the error term. Given the high multi-collinearity among regressors, and the difference in the countries in the sample, finding appropriate instruments is very difficult, and weak instruments can lead to misleading estimates (Stock et al., 2002). Furthermore, IV estimations tend to increase the variance of the estimates. Since the potential gains from IV estimations do not seem to outweigh the potential costs, especially given the difficulty in finding appropriate instruments, this issue is not addressed.
Table 8 Durban-Wu-Hausman Tests of Endogeneity
Full sample Industrialized countries Developing countries Test results
(p-value) (0.066) -1.88* -4.89*** (0.000) (0.124) -1.58 Note: ***, ** and * respectively significant at the 1%, 5% and 10% level.
Since the goal of this paper is to identify the determinants of innovation, it makes sense to look at the direction of the relationship. I perform tests of Granger causality which, though they do not test for the “real” causality relationship between two variables, do give an indication of the existing temporal relationship.11 The results are presented in
Table 9.
Contrary to expectations, past IP strength is not a significant determinant of current R&D investments, for the full sample as well as for both sub-samples. On the other hand, past R&D investments are highly significant in explaining both current IP strength level and current R&D investments, for the full sample and for both sub-samples. This result is
5Discussion
consistent with the results of Ginarte and Park (1997) who identify R&D investments as an important explanatory factor of the strength of IP protection.
That past values of R&D investments explain current values of R&D investments (and the same for IP protection) is not surprising. However, the fact that past IP protection is consistently insignificant in explaining current R&D investments is surprising and should be further investigated.
Table 9 Tests for Granger Causality Dependent variable RD IP Full sam-ple Industrialized countries Developing countries Full sam-ple Industrialized countries Developing countries IPt-1 0.548 (0.386) (0.091) 0.081 (0.368) 0.568 0.956*** (0.027) 0.848*** (0.057) 0.980*** (0.020) R&Dt-1 0.870*** (0.067) 0.865*** (0.020) 0.706*** (0.172) 0.011*** (0.003) 0.039** (0.013) 0.024** (0.009) IPt-2 0.583 (0.442) (0.162) 0.118 (0.501) 0.684 0.913*** (0.073) 0.704*** (0.142) 0.957*** (0.065) R&Dt-2 0.770*** (0.089) 0.804*** (0.055) 0.635*** (0.149) 0.022** (0.009) 0.085** (0.030) 0.044** (0.019) Note: standard errors in parenthesis. ***, ** and * respectively significant at the 1%, 5% and 10% level.
5.3 Innovation and IPR: Specific Issues
Beside estimation issues, specific aspects related to innovation and IPRs also need to be taken into account. First, innovation is inherently difficult to define and to measure. Defi-nitions vary among sources: the systems of innovation literature stays close to Schum-peter’s “new combinations” by defining innovation as “a new use of pre-existing possi-bilities and components” (Lundvall, 1992, p. 8) while the OECD (1997) defines it as all the scientific, technological, organizational, financial, and commercial activities neces-sary to create, implement, and market new or improved products or processes. Measuring innovation implies focusing on its more technical aspects, and though this issue has been discussed in the literature (see for example Griliches, 1994; Stern et al., 2000) the conclu-sion is that no perfect measure is available. This problem might be even more relevant for the case of LDCs, where innovation often consists more of learning, adaptation and imi-tation, which again would call for a different treatment.
6Conclusion
A related issue concerns the quality and availability of data on innovation, especially for LDCs. As was mentioned, aggregated data on R&D investments were used as a proxy for innovation, which, for LDCs, might represent mainly public investments in R&D. This could help explain the different determinants of innovation among industrialized and developing countries. Though no perfect data source exists for past innovative activities, efforts and resources should be allocated to the collection of reliable data in the future. Commendable initiatives exist such as RICYT for Latin-American Countries, the Agri-cultural Science and Technology Indicators of the International Food Policy Research Institute, but more such initiatives should be taken, for different sectors. The evidence of sample selection confirms the importance of taking the issue of missing observations seriously, especially in the perspective of providing reliable analyses for policy-making.
Furthermore, the role of IPRs varies among industries: IPRs are typically important for industries where imitation costs are low compared to R&D costs, such as pharmaceuticals and chemicals (see for example Mansfield, 1995a; Mansfield, 1995b).12 For several
in-dustries, patents do not seem to directly support innovation (Cohen et al., 2000; Levin et al., 1987). Hence, aggregating data at the country level does not take this heterogeneity into account and estimates an average effect, which can produce misleading inferences on which to develop policy recommendations. However, given the importance of these is-sues for economic theory and policy, these qualifications should not discourage research in this area but rather support the allocation of more efforts and resources to the collec-tion and analysis of more reliable data.
6 Conclusion
This article contributes to the literature on innovation and development by identifying the determinants of innovation, and the role of IPRs, in industrialized and developing
12 Mansfield addresses specifically the role IPRs play in deciding whether or not to transfer technology abroad. Foreign direct investments and technology spillovers are not addressed here since they usually do not play an important role for local innovation in LDCs (see Aitken and Harrison, 1999 and Hanson, 2001).
6Conclusion
tries. Using a new dataset, I control for the quality of institutions, past R&D activities, and address the issue of missing observations.
I find that past R&D investments are positive and significant, and that the data are not missing at random: there is a sample selection problem. Controlling for this selection bias, I find that the level of IP protection and past R&D investments are positive and significant regressors explaining R&D investments, while openness to trade has a nega-tive effect on the full sample. The picture is different when looking at the sub-samples: in industrialized countries, past R&D investments and human capital are positive and sig-nificant factors affecting R&D investments while the cost of capital is negative. Con-versely, in LDCs past R&D investments do not play a role: IP strength and demand-pull factors are positive and significant while openness to trade is negative and significant. Hence the determinants of innovation seem to be different for industrialized and develop-ing countries. This is supported by the endogeneity tests that show that IP protection is endogenous in industrialized countries, but not in LDCs. However, in both sub-samples, past R&D investments Granger-cause current IP protection levels, but IP protection does not Granger-cause R&D investments.
Therefore, the hypothesis that IP protection supports innovation is not supported by my results: while IP protection and R&D investments are obviously correlated, the causal relationship would actually go in the other direction (i.e., from R&D to IP protection). However, the second hypothesis is supported by the results: the determinants of innova-tion do differ between industrialized and developing countries.
These results have important implications, in several respects. First, more attention needs to be given to missing data and their analysis. Policy-making based on complete case analysis actually included a small sub-set of countries, from industrialized countries and the more advanced LDCs – not necessarily a representative sample.
Additionally more efforts and resources should be allocated to the collection and analysis of reliable data on innovation, preferably at the industry level, to take the heterogeneity of innovation into account. Moreover, given the several issues plaguing the econometric analysis – the lack of data, multicollinearity, endogeneity – case studies or comparative studies at the industry level on this issue might be more informative. Finally, these results
References
shed light on the need to better investigate the direction of the causality between IP pro-tection and innovation.
References
Aitken, B.J., and A.E. Harrison. 1999. Do Domestic Firms Benefit from Direct Foreign Investment? Evidence from Venezuela. American Economic Review 89(3):605-618.
Alfranca, O., and W.E. Huffman. 2003. Aggregate Private R&D Investments in Agricul-ture: The Role of Incentives, Public Policies, and Institutions. Economic Develop-ment and Cultural Change 52 (1):1-22.
Aubert, J.-É. 2005. Promoting Innovation in Developing Countries: A Conceptual Framework. World Bank Policy Research Working Paper 3554. World Bank, Washington, DC.
Barro, R., and J.W. Lee. 2000. Barro-Lee Data Set. International Data on Education At-tainment: Updates and Implications CID Working Paper 42. Harvard University, Boston, MA.
Bitzer, J. 2005. Measuring Knowledge Stocks: A Process of Creative Destruction. Kyklos 58 (3): 379-393.
Bitzer, J. and A. Stephan. 2007. A Schumpeter-inspired approach to the construction of R&D capital stocks. Applied Economics 39(2):179-189.
Blind, K., J. Edler, R. Frietsch, and U. Schmoch. 2006. Motives to patent: Empirical evidence from Germany. Research Policy 35 (5):655-672.
Chin, J.C., and G.M. Grossman. 1990. Intellectual Property Rights and North-South Trade. In R. W. Jones and A. O. Krueger (Eds.) The political economy of interna-tional trade: Essays in honor of Robert E. Baldwin. Blackwell Publishing, Oxford and Cambridge, Mass.
CIPR. 2002. Integrating Intellectual Property Rights and Development Policy. Commis-sion on Intellectual Property Rights, London.
Coe, D.T., E. Helpman, and A.W. Hoffmaister. 1997. North-South R&D Spillovers. Economic Journal 107(440): 134-149.
Cohen, W.M., and D.A. Levinthal. 1989. Innovation and Learning: The Two Faces of R&D. Economic Journal 99 (397):569-596.
Cohen, W.M., and S. Klepper. 1996. A Reprise of Size and R&D. Economic Journal 106 (437): 925-951.
References
Cohen, W.M., R.R. Nelson, and J.P. Walsh. 2000. Protecting Their Intellectual Assets: Appropriability Conditions and Why U.S. Manufacturing Firms Patent (or Not). NBER working paper 7552. National Bureau of Economic Research, Cambridge, MA.
Collier, P. 1998. The role of the state in economic development: cross-regional experi-ences. Journal of the African Economies 7(suppl_2): 38-76.
Commission for Africa. 2005. Our Common Interest: Report of the Commission for Af-rica. Commission for Africa, London.
Crespo, J., C. Martin, and F.J. Velázquez. 2004. International Technology Spillovers from Trade: The Importance of the Technological Gap. Investigaciones Economi-cas 28 (3): 515-533.
Davidson, R. and J.G. MacKinnon. 1993. Estimation and Inference in Econometrics, Oxford University Press, New York.
Deardorff, A.V. 1992. Welfare Effects of Global Patent Protection. Economica 59 (233): 35-51.
Fink, C., and K.E. Maskus. 2005. Why We Study Intellectual Property Rights and What We Have Learned. In C. Fink and K. E. Maskus (Eds.) Intellectual Property and Development - Lessons from Recent Economic Research. World Bank and Oxford University Press, Washington, DC.
Foellmi, R., and J. Zweimüller. 2006. Income Distribution and Demand-Induced Innova-tions. Review of Economic Studies 73 (4): 941-960.
Ginarte, J.C., and W. Park. 1997. Determinants of patent rights: A cross-national study. Research Policy 26 (3): 283-301.
Granstrand, O. 1999. The economics and management of intellectual property Edward Elgar, Chenltenham, UK.
Griliches, Z. 1994. Productivity, R&D, and the Data Constraint. American Economic Review 84 (1): 1-23.
Grossman, G.M., and E. Helpman. 1991. Innovation and Growth in the Global Economy MIT Press, Cambridge, MA.
Gwartney, J., and R. Lawson. (Fraser Institute)2005. Economic Freedom of the World: 2005 Annual Report. The Fraser Institute, Vancouver, BC.
Hanson, G.H. 2001. Should Countries Promote Foreign Direct Investment? G-24 Discus-sion Paper 9. UNCTAD and Center for International Development, Harvard Uni-versity, New York and Geneva.
Heckman, J.J. 1979. Sample Selection Bias as a Specification Error. Econometrica 47 (1): 153-162.
Helpman, E. 1993. Innovation, Imitation and Intellectual Property Rights. Econometrica 61 (6): 1247-1280.
References
Heston, A., R. Summers, and B. Aten. (Penn World Table) 2002. Penn World Table Version 6.1. Center for International Comparisons at the University of Pennsyl-vania (CICUP).
Higino Schneider, P. 2005. International trade, economic growth and intellectual property rights: A panel data study of developed and developing countries. Journal of De-velopment Economics 78 (2): 529-547.
Horton, N.J., and K.P. Kleinman. 2007. Much Ado About Nothing: A Comparison of Missing Data Methods and Software to Fit Incomplete Data Regression Models. The American Statistician 61 (1): 79-90.
Hu, M.-C., and J.A. Mathews. 2005. National innovative capacity in East Asia. Research Policy 34 (9): 1322-1349.
Jaffe, W., and J. van Wijk. 1995. The impacts of plant breeders' rights in developing countries - debate and experience in Argentina, Chile, Colombia, Mexico and Uru-guay Inter-American Institute for Cooperation on Agriculture and University of Amsterdam, Amsterdam.
Kanwar, S., and R. Evenson. 2003. Does intellectual property protection spur technologi-cal change? Oxford Economic Papers 55(2): 235-264.
Kline, S.J., and N. Rosenberg. 1986. An overview of innovation. In R. Landau and N. Rosenberg (Eds.) The Positive Sum Strategy: Harnessing Technology for Eco-nomic Growth. National Academies Press, Washington, DC.
Lall, S. 1992. Technological Capabilities and Industrialization. World Development 20(2): 135-186.
Lall, S. 1995. Science and Technology in the New Global Environment: Implications for Developing Countries. Science and Technology Issues. UNCTAD, Geneva.
Lederman, D., and W.F. Maloney. 2003. R&D and Development. World Bank Policy Research Working Paper 3024. World Bank, Washington, DC.
Léger, A. 2005. Intellectual property rights in Mexico: Do they play a role? World De-velopment 33 (11): 1865-1879.
Levin, R.C., A.K. Klevorick, R.R. Nelson, and S.G. Winter. 1987. Appropriating the Returns from Industrial Research and Development. Brookings Papers on Eco-nomic Activity 1987 (3): 783-831.
Little, R.J.A., and D.B. Rubin. 2002. Statistical analysis with missing data (second edi-tion) Chichester: Wiley.
Lundvall, B.-A. (Ed.) 1992. National systems of innovation. Pinter, London.
Mansfield, E. 1995a. Intellectual property protection, direct investment, and technology transfer. IFC Discussion paper 19. International Finance Corporation, Washington, DC.
Mansfield, E. 1995b. Intellectual property protection, direct investment, and technology transfer - Germany, Japan and the United States. IFC Discussion paper 27. Interna-tional Finance Corporation, Washington, DC.
References
OECD. 1997. The Measurement of Scientific and Technological Activities, Proposed Guidelines for Collecting and Interpreting Technological Innovation Data. Organi-zation for Economic Cooperation and Development, Paris.
Park, W. 2002. Intellectual Property and Economic Freedom. In J. Gwartney and R. Law-son, (Eds.) Economic Freedom of the World 2001. The Fraser Institute, Vancou-ver.
Park, W., and J.C. Ginarte. 1997. Intellectual property rights and economic growth. Con-temporary Economic Policy 15(3): 51-61.
Puhani, P. A. 2000. The Heckman Correction for Sample Selection and Its Critique. Journal of Economic Surveys 14(1): 53-68.
RICYT. Innovation Indicators [Online]. Available by Network on Science and Technol-ogy Indicators www.ricyt.org.
Schmookler, J. 1972. Patents, Invention, and Economic Change. Harvard University Press, Cambridge.
State Failure Task Force. 2007. Consolidated State Failure Events, 1955-2001 [Online]. Available by State Failure Task Force www.cidcm.umd.edu.
Stern, S., M.E. Porter, and J.L. Furman. 2000. The Determinants of National Innovative Capacity. NBER working paper 7876. National Bureau of Economic Research, Cambridge, MA.
Stiglitz, J.E. 1989. Markets, Market Failures, and Development. American Economic Review 79(2): 197-203.
Stock, J.H., J.H. Wright, and M. Yogo. 2002. A Survey of Weak Instruments and Weak Identification in Generalized Method of Moments. Journal of Business and Eco-nomic Statistics 20(4): 518-529.
UN Millennium Project. 2005. Innovation: Applying Knowledge in Development. Task Force on Science, Technology and Innovation, Earthscan, London.
UNCTAD. 2006. Developing Productive Capacities. United Nations, New York and Geneva.
UNESCO. (various years). Statistical Yearbooks. UNESCO, Paris.
Varsakelis, N.C. 2001. The impact of patent protection, economy openness and national culture on R&D investment: a cross-country empirical investigation. Research Pol-icy30(7): 1059-1068.
Windmeijer, F. 2005. A finite sample correction for the variance of linear efficient two-step GMM estimators. Journal of Econometrics 126(1): 25-51.
World Bank. 2005. World Development Indicators. World Bank, Washington, DC. Zigic, K. 1998. Intellectual property rights violations and spillovers in North–South trade.
Appendix
Table 10List of countries in each regression
Estimation 1 Australia, Austria, Belgium, Canada, Denmark, Finland, France, Greece, Iceland, Ireland, Italy, Netherlands, New Zealand, Norway, Portugal, Spain, Sweden, Switzerland, United Kingdom, USA.
Argentina, Brazil, Burundi, Chile, Colombia, Costa Rica, Cyprus, Ecuador, Egypt, El Salvador, Guatemala, Indonesia, Israel, Jamaica, Jordan, Kenya, Korea, Malaysia, Mexico, Niger, Panama, Philippines, Rwanda, Senegal, Singapore, South Africa, Sri Lanka, Thailand, Trinidad and Tobago, Turkey, Uruguay, Venezuela.
Estimation 2 Australia, Austria, Belgium, Canada, Denmark, Finland, France, Greece, Iceland, Ireland, Italy, Netherlands, New Zealand, Norway, Portugal, Spain, Sweden, Switzerland, United Kingdom, USA.
Argentina, Brazil, Burundi, Chile, Colombia, Costa Rica, Cyprus, Ecuador, Egypt, El Salvador, Guatemala, Indonesia, Israel, Jamaica, Jordan, Kenya, Korea, Malaysia, Mexico, Niger, Panama, Philippines, Senegal, Singapore, South Africa, Sri Lanka, Thailand, Trinidad and Tobago, Turkey, Uruguay, Venezuela.
Estimation 3 Australia, Austria, Belgium, Canada, Denmark, Finland, France, Greece, Iceland, Ireland, Italy, Netherlands, New Zealand, Norway, Portugal, Spain, Sweden, Switzerland, United Kingdom, USA.
Argentina, Brazil, Chile, Colombia, Costa Rica, Cyprus, Ecuador, Egypt, El Salvador, Guatemala, Indonesia, Israel, Jamaica, Jordan, Korea, Mexico, Niger, Panama, Philippines, Singapore, Sri Lanka, Thailand, Trinidad and Tobago, Turkey, Uruguay, Venezuela.