Application of statistical methods in Internet
financial information analysis
Tatjana Dolinšek
Faculty of Commercial and Business Sciences, Celje, Slovenia
[email protected]
Abstract
In today's modern globalised world, we are faced with numerous data which form the basis for many crucial decisions. The ability to perform the analysis and interpret data correctly is, therefore, of essential importance in practically every field. The field of financial Information is one of such fields, especially the segment of information that is used by companies in corporate communication. This article is focused solely on the information that refers to the Internet financial reporting, which is important particularly for the external stakeholders. The research was made on the basis of the Internet Financial Reporting (IFR) Index for 27 Slovenian companies listed on the Ljubljana Stock Exchange. The article demonstrates the methodological approach to the creation of the IFR Index, which served as the new variable in the following steps of this research, for which various statistical analyses were performed (univariate, bivariate, and multivariate). Based on the descriptive statistics, the main characteristics of the IFR Index are identified, and, by using the t-test for two independent samples, it was found out that there is a difference among the companies listed in the two different listings. Moreover, through the use of the correlation analysis, the correlation between the IFR-C and the IFR-P variables was verified, and, in the end, through the use of the multiple regression analysis, it was discovered that the size of the company is the factor which influences the level of the IFR Index. The purpose of this article is to show the awareness of the alternative research methods, and to facilitate the selection of the most appropriate method for addressing particular research questions in the Internet Financial Reporting.
Keywords: correlation analysis, financial information, internet financial reporting, multiple regression analysis, t-test.
JEL Classification: C10, M40, G30. DOI: 10.2478/crebss-2020-0004 Received: January 24, 2020 Accepted: May 10, 2020
Introduction
The world today is filled with data on which a number of crucial decisions are based. This is why the ability of a proper analysis and interpretation of data is of essential importance in practically all areas of work and life. The latter is enabled by statistics that, along with different methods (univariate, bivariate, and multivariate), establishes
relationships between individual variables, and, by using various models, predicts the movement of a certain phenomenon in the future.
Statistical analyses are used frequently in business for company valuations and in many business decisions. They are particularly important in decision-making processes at all levels of business, in the economy, administration, and politics, as well as in all areas of production and non-production activities, starting from agriculture, processing industries, and service activities to education. Understanding and interpretation of these data can be considered as the basic statistical literacy (Dumičić. Bahovec, eds., 2011). Accounting also presents a particular field of use, which provides access to various analytical and synthetic information on individual economic categories. In this case, accounting is meant as a function in the company which deals with bookkeeping, planning, controlling, and informing. The article is focused mainly on the last function, namely informing, as Internet Financial Reporting is one of the forms of the narrow and broader public information, both professional as well as non-professional, about the company’s business operations. In doing so, it uses the World Wide Web as the media, which provides numerous advantages to its users and reporters. Accountants in various fields, including auditors, forensic accountants, financial analytics, controllers and risk accountants, use statistics to accomplish their professional duties (Reference, 2020):
• Auditors who use sampling for the selection of a database when choosing documents they want to audit, as it is impossible for them to verify all existing documents and information.
• Forensics, who use statistical methods for the analysis of financial instruments through which they discover financial frauds. With knowledge and understanding of a statistical basis, forensics can assess whether the evaluation of risk connected with the financial instruments was appropriate.
• Controllers who, within a company, are responsible for the continuous monitoring, analysing of the company’s performance, and comparison of current results with the planned ones. In their work, they utilise various statistical calculations through which they analyse time series, calculate indicators, compare them with the competing companies, and suggest business solutions based on the results.
• Financial analysts, assessing the corporate credit rating – one of the analyses they use is discriminant analysis.
• External stakeholders analysing a company's financial statements for decision-making purposes. External stakeholder of financial information are investors, investment analysts, customers, suppliers, employees, lander institutions, government lenders and general public. They use it to understand the overall health of an organization as well as to evaluate financial performance and business value (Kenton, 2019). Mostly Companies’ websites include more information on their operation, inclusive of accounting and financial information that are usually presented within an Annual Report or as individual information intended for investors. For this type of reporting, the term Internet Financial Reporting (hereinafter IFR) is used.
This article will focus mainly on the external stakeholders, and on the example of the use of various statistical methods in the IFR analysis. The paper is organised as follows. The continuation of this paper will first show the theoretical background of the IFR (in the second chapter), in the third chapter literature review will be presented, while the creation of the IFR Index as an independent variable will be included in the research part of the article (in the fourth chapter), for which the Correlation and Regression Analysis were used to determine the correlation or dependence on the
predictors. By doing this, the use of various statistical methods will be demonstrated in the analysis of financial information. The final chapter will conclude the paper and provide recommendations for further research.
The aim of the paper was to perform an in-depth IFR Index analysis by using different statistical methods. The following hypotheses were set:
•H1: There is a connection between the IFR-P and IFR-C.
•H2: The companies listed in the prime market have a higher value of the IFR Index than other companies.
•H3: The size and the Stock Exchange listing affect the higher value of the IFR Index.
Theoretical background of IFR
Since 1990, the Internet has become an alternative to traditional printed forms of financial reporting. Due to its numerous advantages, the Internet today is used by many companies throughout the world (Siala et al., 2014). Its advantages can be summarised into the following: Access to data no matter the time or place, the capability to access a large number of users, interactivity, presentation flexibility, access to a greater degree of information, low access costs, usage of multimedia in presentation of information, ecological awareness, socially responsible business, and similar. The quantity and quality of information about the company’s business operations vary considerably: Some companies use the World Wide Web for the purposes of marketing and promotion, some also present other more general information about the company’s business operations, while others display an extremely comprehensive business operation (Gibson, 2013; Abdullah et al., 2017). According to Jain and Kumar (2013), financial information can be disclosed efficiently and effectively through the Internet. Thus, through online financial disclosure investors can have unlimited access to a greater volume of data (Al-Sartawi, 2018).
The theoretical background of IFR may be explained using different theories, which are classified into two groups (Dolinšek et al., 2014a):
• The first includes theories used primarily to interpret the impact of different factors (company size, profitability, age, industrial sector, ownership concentration, etc.) on IFR. Among them are the signalling theory and certain theories within the corporate management, such as the agency and legitimacy theories.
• The second includes theories and models that apply either to the expectations of the users regarding the content of accounting information (stakeholder theory), or to their acceptance of novelties, enabled by the World Wide Web at forwarding this information (the TAM model and innovation diffusion theory). In the continuation the Agency Theory and the Stakeholder Theory will be present, which will relate directly to the contents of the research part.
Agency theory
The originator of the Principal-Agent Theory, Ross (1973), who defined the agency relationship as a problem arising between two (or more) parties, namely, when one party (agent) acts as the representative of the other party (principal) in a certain decision-making problem. If the Agency Theory is applied to the field of Internet Financial Reporting it is necessary to start from the relationship between the Managing Directors (agents) and owners (principals), which the literature describes as the problem of corporate governance. Managing Directors are in a position where they can use the internal information in their own favour, hence, causing the situation of a conflict of interests, as the interests of owners and the management differ. Moreover,
the agents are also the ones who are in charge of the preparation of financial statements and the selection of appropriate accounting policies; that is why, in accordance with the Agency Theory, it can be assumed that the accounting information system reflects the management’s preferences (Glautier et al., 2011). Large companies have big agency costs because companies must inform their full financial statements to the shareholders as management responsibility (Abdulallah et al., 2017). In connection with this theory the influence of the size of the company on the index IFR has been assessed.
Previous research has shown a positive correlation between company size and IFR: Craven and Marston (1999), Pirchegger and Wagenhofer (1999), Ettredge et al. (2002), Debrency et al. (2002), Larran and Giner (2002), Allam and Lymer (2003), Oyeler et al. (2003), Xiao et al. (2004), Bollen et al. (2006), Al Shammari (2007), Dyczkowska (2014), Mokhtar, (2017), Abdullah et al. (2017), Maulana and Alimilia (2018), Demjyan (2019), etc.
Stakeholder theory
The Stakeholder Theory, which started to develop after 1980, was began by Edvard Freeman. The essence of this Theory can be seen in the realisation that companies have to build and strengthen the long-term relationships with their stakeholders, as that will also bring them financial benefits. The companies that manage to satisfy the expectations of all the stakeholders and the society in general can expect to gain a competitive advantage over the competing undertakings and thrive in their business. The broader purpose of this theory is to help corporate managers improve the value of their activities, and minimize losses for stakeholders (Pernamasari, 2019).The Internet enables companies to disclose traditional annual reports with additional financial and non-financial information in multiple formats to a wider audience (Bonson and Escobar, 2006). In connection with this theory the differences between listed companies on the Ljubljana Stock Exchange has been assessed.
Literature Review
Research regarding IFR has been conducted since 1996 when the Internet was first becoming used for advertising and commercial purposes (Allam and Lymer, 2003). The first research on IFR was performed in 1996 by Petravick and Gillett (1996), using a sample of 150 companies in the United States which were placed on the Fortune 500 list. Later, European countries as well as other developed countries became involved in such research, while in recent years, it is also being conducted in less developed countries (Dolinšek et al., 2014a).
The majority of research deals with IFR in a single country, for example Great Britain (Craven and Marston (1999), Xiao et al. (2002), Damaso and Lourenço (2011)), the United States of America (Petravick and Gillett (1996), Booker and Galbreath (1997), Debrecency and Gray (1999), Ettredge et al. (2002)), Germany (Marston and Polei (2004)), New Zeland (Oyelere et al. (2003)), Japan (Marston (2003)), Slovenia (Pervan 2006, Dolinšek et al. (2014a)), Greece (Iatridis and Alexakis (2012)), Spain (Larran and Giner (2002)), Kuwait (Al- Shammari (2007)), Indonesia (Sadalia et al. (2017)), Pakistan (Hussain et al. (2018)), etc.
Simultaneously with such research, studies involving two or more countries were commenced in order to ascertain the differences in IFR between the involved countries. As quated in Dolinšek et al. (2014b), Lymer and Tallberg (1997) included in their research 50 companies based in Great Britain and 72 companies based in Finland. Allam and Lymer (2003) compared the Internet financial information of 250
companies based in the United States, Great Britain, Canada, Australia and Hong Kong. Debreceny and Gray (1999) performed their research on 15 companies based in Great Britain, Germany and France. European Union member country companies were included in the study performed by Bonson and Escobar in 2002. The comparative analysis of IFR in Slovenia and Croatia which included 55 Croatian and 30 Slovenian companies quoted on the stock exchange was performed by Pervan (Pervan, 2006).
Research methodology
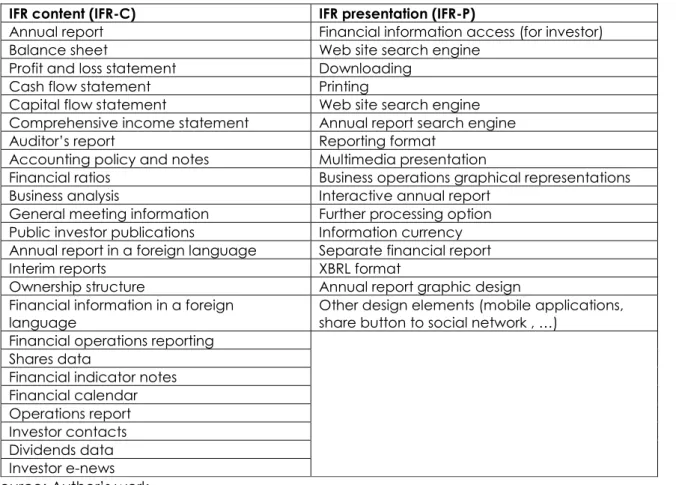
The research was conducted on an example of the Slovenian companies that are listed on the Ljubljana Stock Exchange (hereinafter LBSE). In November 2019, 29 companies were listed on the LBSE, 9 of which were in the prime market and 20 in the standard market. The prime market is a prestigious market intended for larger established companies renowned for their liquidity and transparency of operations. It was established to underline the visibility of Slovenia's top listed companies among international investors. The standard market meets the basic criteria for Stock Exchange market listing, but not those for entering higher market segments (Ljubljana Stock Exchange, 2020). As two companies from the standard market did not have access to websites, the actual sample was set to 27 companies (n = 27). The evaluation of websites took place in November 2019. Internet financial reporting differs from the traditional reporting in both content and presentation format. To determine the scope an evaluation form composed of 40 evaluation elements, namely 24 related to content (IFR-C) and 16 related to presentation (IFR-P) was used. The list of all evaluation elements can be seen in Table 1.
Table 1 The list of all IFR evaluation elements
IFR content (IFR-C) IFR presentation (IFR-P)
Annual report Financial information access (for investor)
Balance sheet Web site search engine
Profit and loss statement Downloading
Cash flow statement Printing
Capital flow statement Web site search engine
Comprehensive income statement Annual report search engine
Auditor’s report Reporting format
Accounting policy and notes Multimedia presentation
Financial ratios Business operations graphical representations
Business analysis Interactive annual report
General meeting information Further processing option
Public investor publications Information currency
Annual report in a foreign language Separate financial report
Interim reports XBRL format
Ownership structure Annual report graphic design
Financial information in a foreign language
Other design elements (mobile applications, share button to social network , …)
Financial operations reporting Shares data
Financial indicator notes Financial calendar Operations report Investor contacts Dividends data Investor e-news Source: Author’s work.
Evaluation of the 27 company websites was carried out through the use of an evaluation form which included 40 items. To this end, a dichotomous evaluation was used: If the item was present on the website it was given a value of 1 and, if not, the value of 0. In this way, we obtained a total sum for each company, which, theoretically, moved in the range of 0-40. Adding up every value resulted in the IFR index composed of the contents portion – C) – and the presentation portion – (IFR-P). The index calculation formula is given in (1):
𝐼𝐹𝑅 𝑖𝑛𝑑𝑒𝑥𝑖 = ∑𝐼𝐹𝑅 − 𝐶𝑖∗ 0,6 + ∑ 𝐼𝐹𝑅 − 𝑃𝑖 16 𝑖=1 ∗ 0,4, 24 𝑖=1 (1) where: IRF indexi performs Internet Financial Reporting index for company I, IFR-Ci is Internet Financial Reporting relating to content for company I, and IFR-Piis Internet Financial Reporting relating to presentation for company i.
Because, from the viewpoint of financial reporting, elements related to contents have more value than those concerning form, the analysis continued by weighting of this index. The weight of 60% was determined for contents’ elements, while presentation-related elements were weighted at 40%. A similar approach was applied by Pirchegger and Wagenhofer (1999), Marston and Polie (2004), Alexakis et al. (2012), Dolinšek et al. (2014a).
Results and Discussion
Based on the IFR Index I have illustrated different approaches of its analysis below. First, I presented the main characteristics of the IFR Index, and then I determined whether differences exist in the index level among the companies listed in the standard and in the prime market, and if the partial IFR-C and IFR-P Indexes were in mutual correlation. The conclusion presents the multiple regression analysis for determining factors influencing the IFR Index level.
Exploratory Data Analysis
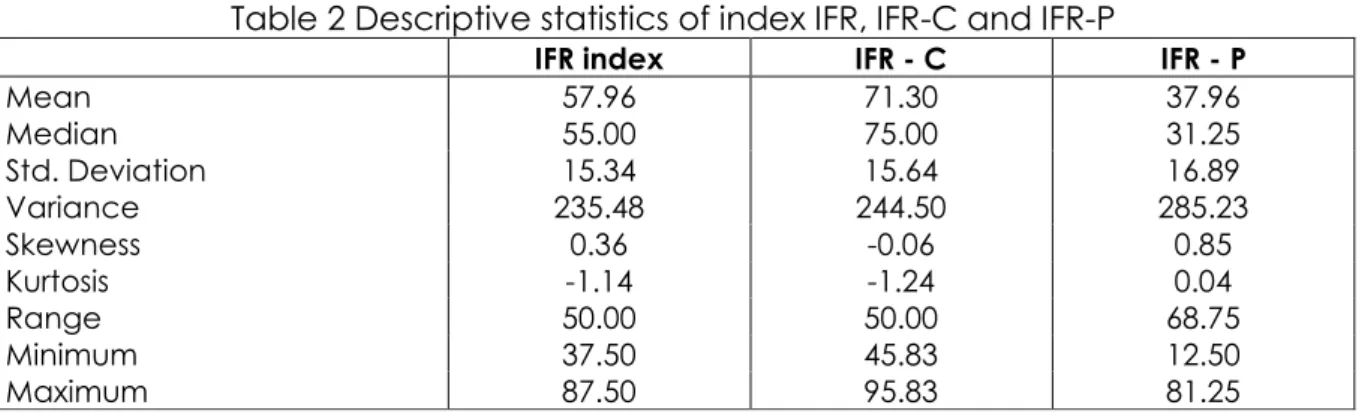
The basic exploratory analysis of the dependent variable (Index IFR) is shown in Table 2 (1st column). Its potential values range between 0 and 100. The IFR index minimum value equals 37.50, the maximum 87.50 while the range has been calculated at 50.00. The index average measures 57.96 while the standard deviation equals 15.34. According to the asymmetry and kurtosis coefficients, it has been established that the right tail of distribution is slightly asymmetrical while the distribution itself is platykurtic. Moreover, descriptive statistics were also done for both partial IFR-C and IFR-P Indexes (2nd and 3rd column).
Table 2 Descriptive statistics of index IFR, IFR-C and IFR-P
IFR index IFR - C IFR - P
Mean 57.96 71.30 37.96 Median 55.00 75.00 31.25 Std. Deviation 15.34 15.64 16.89 Variance 235.48 244.50 285.23 Skewness 0.36 -0.06 0.85 Kurtosis -1.14 -1.24 0.04 Range 50.00 50.00 68.75 Minimum 37.50 45.83 12.50 Maximum 87.50 95.83 81.25
It has been established that, on average, companies give greater importance to the contents (
𝑥
̅IFR-C= 71.30) than to the form of the financial information (𝑥
̅IFR-P=37.96). This is understandable, since there is a Regulation for the Public Limited Companies as regard to the information contents, while, on the other hand, the method of presentation is still under the sphere of responsibility of each company.Correlation analysis
The second part of the research concerned the use of bivariate statistical methods, through which we wanted to determine whether there is a correlation between the IFR-C and IFR-P. Namely, it can be assumed that companies that provide a wide range of financial information to its users also enable different forms and methods of presenting this information.
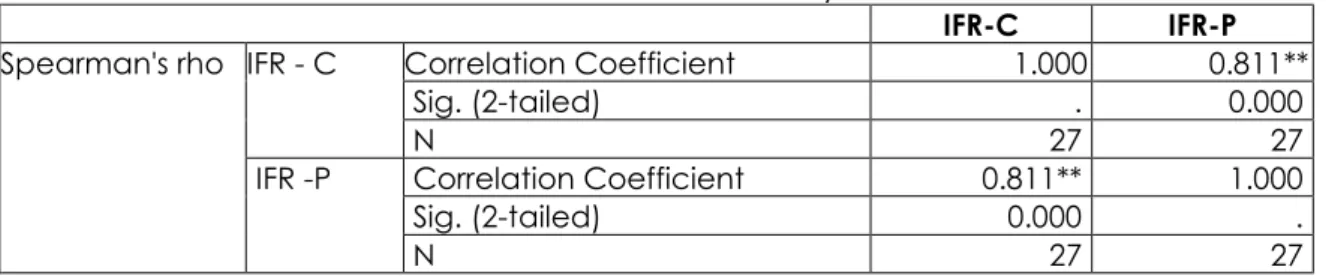
Spearman’s Correlation Coefficient, which presents the non-parametric statistics, was used. It can be used when the data have violated the parametric assumptions, such as the non-normally distributed data (Field, 2009). Before carrying out the test, the normality of distribution was verified of both variables by means of the Shapiro-Wilk test (n<30). The correlation matrix is shown in Table 3.
Table 3 Correlation analysis
IFR-C IFR-P
Spearman's rho IFR - C Correlation Coefficient 1.000 0.811**
Sig. (2-tailed) . 0.000
N 27 27
IFR -P Correlation Coefficient 0.811** 1.000
Sig. (2-tailed) 0.000 .
N 27 27
**Correlation is significant at the 0.01 level (2-tailed).
Source: Author’s work
Given the value of the correlation coefficient (R2 = 0.811; p = 0.000), a strong and positive correlation was noticed between both variables - companies that have a higher IFR-C also have a higher IFR-P. Namely, should the companies display substantially different information on their websites, they will also look for different channels for their presentation, for example, not only the Annual Report in a PDF format, but also presentation methods that will enable the user to process information further, search information faster, multimedia presentations of business, separate information for investors, the possibility to download information to mobile applications, and similar. Larger companies can also make such diversity happen more easily than smaller companies, which is in accordance with the Agency theory and the Stakeholder Theory. The first hypothesis can be accepted with 5 % risk.
Independent
t-
test
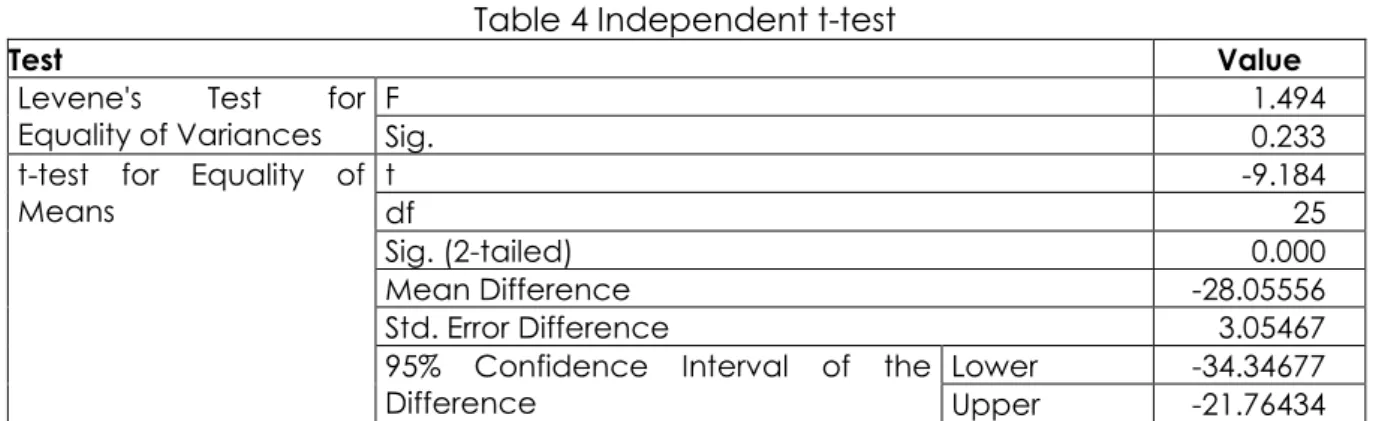
The Independent Samples t-test compares the means of two independent groups in order to determine whether there is statistical evidence that the associated population means are significantly different. This test is used for the data measured at least at the interval level and normally distributed (Field, 2009). Differences between the IFR index for companies on the standard market and on the prime market were compared. Results are shown in Table 4.
Table 4 Independent t-test
Test Value
Levene's Test for
Equality of Variances F Sig. 1.494 0.233
t-test for Equality of Means t -9.184 df 25 Sig. (2-tailed) 0.000 Mean Difference -28.05556 Std. Error Difference 3.05467
95% Confidence Interval of the
Difference Lower Upper -34.34677 -21.76434
Source: Author’s work
Firstly, a Levene's test was used to assess the equality of variances (F=1.494, p =0.233) and found out that variances are assumed equal. The results of the t-test from Table 4 prove that there is a statistically significant difference between the index IFR for companies listed on the prime market and companies listed on the standard market (t= -9.184, p=0.000).
Table 5 Descriptive statistics
Listed on the LJSE N Mean Std. Deviation Std. Error Mean
Standard market 18 48.6111 8.13364 1.91712
Prime market 9 76.6667 5.,86302 1.95434
Source: Author’s work
The results of descriptive statistics from Table 5 show that the average IFR Index for the companies in the standard market is lower (
𝑥
̅=48.61) than in the case of the prime market (𝑥
̅=76.67). This can be explained by the fact that the companies listed in the prime market are subjected to stricter rules as regard to the listing, as well as in relation to reporting to the stakeholders. Namely, the companies in the prime market must consistently apply the OECD Corporate Reporting Guidelines. The second hypothesis can be accepted with 5 % riskRegression analysis
The aim of the multiple regression analysis is to determine the relation between the IFR index as the dependent variable and independent variables. The independent variables are defined given the theoretical background presented in Chapter 2. In accordance with the Agency Theory, I used the number of employees and the size of assets and income as the independent variables, and according to the Stakeholder Theory, Stock Exchange listing (prime and standard). The list of dependent variables is shown in Table 6.
Table 6 List of Independent and dependent variables
Independent
variables Measuring method Measuring
Size No. of employees Assets Average number of employees in 2018 Assets on 31 December 2018
Income Net turnover in 2018
Listed on the LJSE market
Prime Dummy: (1 = Prime market); (0 = Standard
market) Standard
To objective was attained using the OLS (Ordinary least square) method previously applied by Xiao et al. (2004), Marston and Polie (2004), Al-Htaybat (2005), Aly (2008), Dolinšek et al. (2014a).
Multipe regression analysis was performed using the stepwise method, which gradually incorporates 5 independent variables into the model by first including items having the greatest impact, followed by other items.
When the regression model is observed, according to R=0.878 and adjusted R2=0.762 it might be concluded that the model is good an explain the variability in IFR. Furthermore, the F-test statistics value of 84.355 suggests that at the significance level of 1 % the regression model provides a good fit. Pearson correlation coefficient (R=0.878) indicates strong positive relationship between variables.
The Ordinary least squares method was also examined assumptions. Multicollinearity was examined by the VIF (Variance Inflation Factor). VIF values for regression coefficient is below 5, which indicates the absence of multicollinearity (VIF =1). Autocorrelation was examined by the Durbin-Watson statistics (DW=1.919). A value of 2.0 means that there is no autocorrelation detected in the sample.
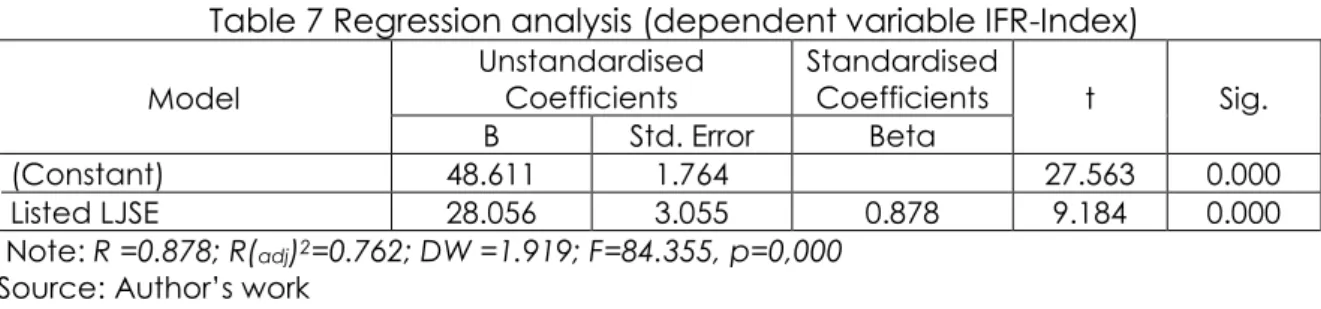
Table 7 Regression analysis (dependent variable IFR-Index)
Model Unstandardised Coefficients Standardised Coefficients t Sig.
B Std. Error Beta
(Constant) 48.611 1.764 27.563 0.000
Listed LJSE 28.056 3.055 0.878 9.184 0.000
Note: R =0.878; R(adj)2=0.762; DW =1.919; F=84.355, p=0,000
Source: Author’s work
The result of this analysis is the regression model with one regressor, as follows: IFR-P = 48.611 + 28.056 (listed LJSE) + e. (2) The results of the Regression Analysis show that only the type of listing on the Stock Exchange proved to be statistically significant. The IFR Index of the prime market companies is, on average, higher by 28.056 points than in the case of the standard market companies (t=9.184; p=0.000). A similar result can already be seen in the t-test. Given that the size of the company does not affect the IFR Index, in accordance with the Agency Theory, there was examined separately whether the size of the company would affect either the contents (IFR-C) or the presentation method (IFR-P). Two separate Regression Analyses were re-performed, where, on one occasion, the IFR-C as the dependant variable was used, and, on the second occasion, the IFR-P. In case of the IFR-C, the results were similar to those seen in the IFR Index, while in the IFR-P, the size of the company proved to be statistically significant (measured by the number of employees). The results are shown in Table 8.
Table 8: Regression analysis (dependent variable IFR-P)
Model Unstandardised Coefficients Standardised Coefficients t Sig.
B Std. Error Beta
(Constant) 4.306 0.261 16.523 0.000
Listed LJSE 3.823 0.663 0.680 5.765 0.000
No. of employees 0.001 0.000 0.297 2.519 0.019
Note: R =0.899; R(adj)2=0.800; DW =1.339, VIF= 2.194; F=84.355, p=0.000 Source: Author’s work
The result of this analysis is the regression model with two regressors, as follows:
IFR-P = 4.306 +3.823 (listed LJSE) + 0.001 (No. of employees) + e, (3)
where: IFR-P of companies listed on the prime market is, on average 3.823 (t=5.765; p=0.0004), is greater than of companies listed on the standard market, if other variables’ value remain unchanged.
If the number of company employees increases by one, the value of IFR-P will increase on average by 0.0013 (t=2.517; p=0.0190), if other variables’ values remain unchanged.
Conclusion
The aim of this article was to facilitate applied research studies in Accounting, respecting other disciplines.
Different approaches to statistical analysis were shown on the example of the Internet financial information. First, a methodological approach to development of indicator was presented, by which qualitative data was quantified. To this end, the evaluation form was used to analyse 27 websites of the Slovenian companies listed on the LBSE. 24 contents elements and 16 presentation elements was evaluated. As the aspect of contents is more important than presentation, pondering in the final stage was used. In this way, IFR Index was formed as the variable, on the basis of which different methods of statistical analysis,both univariate (descriptive statistics), as well as bivariate (correlation and T-test) and multivariate (multiple regression analysis) was applied. IFR Index is mostly affected by the type of listing on the Stock Exchange, while, in the case of the IFR-P Index, partly also the size of the company. This can be explained by the fact that the requirements given the corporate reporting for companies listed in the prime market are stricter than for the companies listed in the standard market. Moreover, the Internet is a media that enables simple, inexpensive, and widely accessible methods of spreading information about the company’s business operation. Because of that, the companies use it more frequently than all the other forms of media. The research presented only one aspect of the use of statistics in the financial information analysis. Research opportunities in the field of the Internet Financial Information are numerous, both in terms of the use of statistical methods, as well as in terms of financial information contents. Other analyses from the field of statistical methods that were not used in this paper, could also have been used (for example the use of logistic regression for the analysis of the IFR among the companies listed in the prime or standard market, or the use of Factor Analysis, through which the impact factors to IFR would be reduced).
The scientific contribution can be seen primarily in the model design that can help clarify the factors affecting the size, contents, and form of the financial information on websites. The IFR Index was used as a dependent variable and the Stock Exchange listing and the company’s size as the independent variables. The fact is that more independent variables could be included, which would most definitely improve the model’s quality. With certain adaptations the model could also have predictive power and could, therefore, help predict the value of the IFR Index at given values of the dependant variables.
From the aspect of contents, the research could be extended further to the field of determining the profitability as the factor that would affect the IFR, the comparison of the IFR between different countries, the usefulness of the modern forms of presentation
of the financial information on the Internet, or identifying the views given the usefulness of the Internet financial information.
References
1. Abdullah, F. D. M., Ardiansyah, M. N., Hamidah N. (2017). The Effect of Company Size, Company Age, Public Ownership and Audit Quality on Internet Financial Reporting. Sriwijaya international journal of dynamic economics and business, Vol. 1, No. 2, pp. 153-166.
2. Al-Htaybat, K., Alberti-Alhtaybat, L., Hutaibat, K. A. (2011). Users’ perceptions on Internet financial reporting practices in emerging markets: Evidence from Jordan, International Journal of Business and Management, Vol. 6, No. 9, pp. 170-182.
3. Allam, A., Lymer, A. (2003). Developments in IFR: Review and analysis across five developed countries. The International Journal of Digital Accounting Research, Vol. 3, No. 6, pp.165-199.
4. Al-Sartawi, M. A. (2018). Online financial disclosure and firms’ performance: evidence from the Gulf Cooperation Council countries. World Journal of Entrepreneurship, Management and Sustainable Development, Vol. 14, No. 2, pp.178–190.
5. Al-Shammari, B. (2007). Determinants of Internet financial reporting by listed companies on the Kuwait Stock Exchange, Journal of International Business and Economics, Vol. 7, No. 1, pp. 162-178.
6. Aly, D. (2008). Assessing the development of voluntary internet financial reporting and
disclosure in Egypt, Hull, University of Hull, Business school.
7. Dumičić, K., Bahovec, V. (Eds.) (2011). Poslovna statistika. Sveučilište u Zagrebu, Zagreb. 8. Bollen, L., Hassink H., Bozic, G. (2006). Measuring and explaining the quality of internet
investor relations activities: a multinational empirical analysis. International Journal of Accounting Information Systems, Vol. 7, No. 4, pp. 273-298.
9. Bonson, E., Escobar, T. (2002). A Survey on voluntary disclosure on the Internet. Empirical evidence from 300 European Union Companies. International Journal of Digital Accounting Research, Vol. 2, No. 1, pp. 27-51.
10. Bonson, E., Escobar, T. (2006). Digital reporting in Eastern Europe: An empirical study. International Journal of Accounting Information Systems, Vol. 7, No. 4, pp. 299-318.
11. Booker, J.A., Galbreath, S. C. (1997). Financial information and the WWW current state of reporting practices. National Public Accountant, Vol. 42, No. 8, pp. 32.
12. Craven, B., Marston C. (1999). Financial reporting on the Internet by leading UK companies. The European Accounting Review, Vol. 8, No. 2, pp. 321-333.
13. Damaso, G., Lourenço, I. C. (2011). Internet Financial Reporting: Environmental impact companies and other determinants, in 8th International Conference on Enterprise Systems, Accounting and Logistics, Thassos Island, Greece, 11-12 July 2011, pp. 331-359.
14. Demiyan, M. (2019). Determinatn internet financial reporting (IFR) di bursa efek Indonesia (Doctoral dissertation). Universitas Pembangunan Nasional Veteran, Jakarta.
15. Debreceny, R., Gray, G. L. (1999). Financial reporting on the Internet and the external audit. European Accounting Review, Vol. 8, No. 2, pp. 335-350.
16. Debreceny, R., Gray, G. L., Rahman, A. (2002). The determinants of Internet financial reporting. Journal of Accounting and Public Policy, Vol. 21, No. 4/5, pp. 371-394.
17. Dolinšek, T., Tominc, P., Lutar-Skerbinjek, A. (2014a). The determinants of internet financial reporting in Slovenia. Online Information Review, Vol. 38, No. 7, pp. 842-860.
18. Dolinšek, T., Tominc, P., Lutar-Skerbinjek, A. (2014b). Users’ Perceptions on Internet Financial Reporting. Organizacija, Vol. 47, No. 4, pp. 254-266.
19. Dyczkowska, J. (2014). Assessment of Quality of Internet Financial Disclosures Using a Scoring System. A Case of Polish Stock. Accounting and Management Information Systems, Vol. 13, No.1, pp. 50-81.
20. Ettredge, M., Richardson, V. J., Scholz, S. (2001). The presentation of Financial information at corporate websites. International Journal of Accounting Information Systems, Vol. 1, No. 2, pp. 149-168.
22. Gibson, H. C. (2013). Financial Reporting and Analysis. Using financial accounting information. South Western Cengage Learning, Mason USA.
23. Glautier, M., Underdown, B., Morris, D. (2011). Accounting Theory and Practice. New York: Financial Times Prentice Hall.
24. Hussain, A., Rehman, Al., Ishaq, A. (2018). The determinants of internet financial reporting in pakistan. City University Research Journal, Vol. 8, No. 2, pp. 287-29.
25. Iatridis, G., Alexakis, P. (2012). Evidence of voluntary accounting disclosures in the Athensstock market. Review of Accounting and Finance, Vol. 11, No. 1, pp. 73-92.
26. Jain, S. K., Kumar, P. (2013). Corporate financial reporting on internet: A study of user’s perception. Pacific Business Review International, Vol. 5, No. 12, pp. 45-55.
27. Larran, J. M., Giner, B. (2002). The use of the Internet for corporate reporting by Spanish companies. The International Journal of Digital Accounting Research, Vol. 2, No. 3, pp. 53-82.
28. Ljubljana Stock Exchange. (2020). Our markets. Available at: http://www.ljse.si/cgi-bin/jve.cgi?doc=8371#standard_market [07 January 2020].
29. Lymer, A., Tallberg, A. (1997). Corporate reporting and the Internet – a survey and commentary on the use of the WWW in corporate reporting in the UK and Finland, in 20th Annual Congress of the European Accounting Association, Graz, Austria.
30. Marston, C. (2003), Financial Reporting on the Internet by Leading Japanese Companies, Corporate Communication. An International Journal, Vol. 8, No. 1, pp. 23-34.
31. Marston, C., Polei, A. (2004). Corporate reporting on the Internet by German companies. International Journal of Accounting Information Systems, Vol. 5, No. 3, pp. 285-311.
32. Mokhtar, E (2017). Internet financial reporting determinants: a meta-analytic review. Journal of Financial Reporting and Accounting, Vol. 15, No. 1, pp. 116-154.
33. Maulana, I.R, Almilia, L. S. (2018). Factors Affecting the Internet Financial Reporting (IFR) in Banking Sector Companies Listed on the Indonesia Stock Exchange (IDX). The Indonesian Accounting Review, Vol. 8, No. 2, pp. 175 – 187.
34. Oyelere, P. B., Laswad, F., Fisher, R. (2003). Determinants of Internet Financial Reporting by
New Zealand Companies. Journal of International Financial Management and
Accounting, Vol. 14, No. 1, pp. 26-63.
35. Petravick, S., Gillett, J. (1996). Financial reporting on the World Wide Web. Management
Accounting, Vol. 78, No. 6, pp. 26-29.
36. Pernamasari, R. (2019). Analysis of Index Internet Financial Reporting. Studies in Banking Companies in Indonesia, Malaysia and Singapore. International Journal of Academic Research in Accounting, Finance and Management Sciences, Vol. 9, No. 1, pp. 150-159. 37. Pervan, I. (2006), Voluntary financial reporting on the internet – analysis of the practice of
Croation and Slovene listed joint stock companies. Financial theory and practice, Vol. 30, No. 1, pp. 1−27.
38. Pirchegger, B., Wagenhofer, A. (1999). Financial Information on the Internet: A Survey of the
homepages of Austrian companies, The European Accounting Review, Vol. 8, No. 2, pp.
383–395.
39. Reference (2020). How are Statistics Used in Accounting? Available at
https://www.reference.com/world-view/statistics-used-accounting-3efe8decd7b1d368 [07 January 2020].
40. Ross, S. (1973). The Economic Theory of Agency: The Principal's Problem. American Economic Review, Vol. 63, No. 2, pp, 134–139.
41. Sadalia, I., Rahamani, N. A., Muda, I. (2017). The Significance of Internet Based Financial Information Disclosure on Corporates’ Shares in Indonesia. International Journal of Economic Research, Vol. 14, No. 12, pp. 337-346.
42. Siala, H. G., Sellami, Y. M., Fendri, H. B. (2014). Determinants of voluntary web-based disclosure: A comparison of the United Kingdom and its former colony, New Zealand. International Journal of Accounting and Economics Studies, Vol. 2, No. 2, pp.100-110. 43. Xiao, J. Z., Jones, M. J., Lymer, A. (2002). Immediate trends in Internet reporting, European
44. Xiao, J. Z., Yang, H., Chow, C. W. (2004). The determinants and characteristics of voluntary Internet-based disclosures by listed Chinese companies. Journal of Accounting and Public Policy, Vol. 23, No. 3, pp. 191-225.
About the author
Tatjana Dolinšek, PhD, is an Assistant Professor of accounting and statistics at the Faculty of
Commercial and Business Sciences in Celje, Slovenia. Her research interests include cost, financial and management accounting as well as statistical methods in economics and business. As a guest tutor and a member of the Review and Organisational Board of the Science Conference she also cooperates with the RRiF College of Financial Management in Zagreb in Croatia. She has participated at more than 10 scientific and professional conferences and is the author of five papers in scientific and professional journals published in Slovenia and internationally. The author can be contacted at [email protected].