Accepted Manuscript
Micro-Computed Tomography Pore-scale Study of Flow in Porous Media:Effect of Voxel Resolution
S.M. Shah , F. Gray , J.P. Crawshaw , E.S. Boek
PII: S0309-1708(15)00159-1
DOI: 10.1016/j.advwatres.2015.07.012
Reference: ADWR 2424
To appear in: Advances in Water Resources
Received date: 5 December 2014 Revised date: 6 July 2015 Accepted date: 14 July 2015
Please cite this article as: S.M. Shah , F. Gray , J.P. Crawshaw , E.S. Boek , Micro-Computed To-mography Pore-scale Study of Flow in Porous Media:Effect of Voxel Resolution, Advances in Water Resources(2015), doi:10.1016/j.advwatres.2015.07.012
This is a PDF file of an unedited manuscript that has been accepted for publication. As a service to our customers we are providing this early version of the manuscript. The manuscript will undergo copyediting, typesetting, and review of the resulting proof before it is published in its final form. Please note that during the production process errors may be discovered which could affect the content, and all legal disclaimers that apply to the journal pertain.
ACCEPTED MANUSCRIPT
Highlights
3-phase segmentation important to understand the role of resolved macro-pore phase.
Partial volume effects impact transport properties at different scanned resolutions.
ACCEPTED MANUSCRIPT
Micro-Computed Tomography Pore-scale Study of Flow in Porous Media:
Effect of Voxel Resolution
S.M. Shah*†, F. Gray†, J.P. Crawshaw† and E. S. Boek†
† Department of Chemical Engineering, Qatar Carbonates and Carbon Storage Research Centre Imperial College London, South Kensington Campus, London SW7 2AZ, United Kingdom
e-mail: [email protected], web page: http://www.imperial.ac.uk/
*
corresponding author
Abstract
A fundamental understanding of flow in porous media at the pore-scale is necessary to be able to upscale average displacement processes from core to reservoir scale. The study of fluid flow in porous media at the pore-scale consists of two key procedures: Imaging - reconstruction of three-dimensional (3D) pore space images; and modelling such as with single and two-phase flow simulations with Lattice-Boltzmann (LB) or Pore-Network (PN) Modelling. Here we analyse pore-scale results to predict petrophysical properties such as porosity, single-phase permeability and multi-phase properties at different length scales. The fundamental issue is to understand the image resolution dependency of transport properties, in order to up-scale the flow physics from pore to core scale. In this work, we use a high resolution micro-computed tomography (micro-CT) scanner to image and reconstruct three dimensional pore-scale images of five sandstones (Bentheimer, Berea, Clashach, Doddington and Stainton) and five complex carbonates (Ketton, Estaillades, Middle Eastern sample 3, Middle Eastern sample 5 and Indiana Limestone 1) at four different voxel resolutions (4.4 µm, 6.2 µm, 8.3 µm and 10.2 µm), scanning the same physical field of view. Implementing three phase segmentation (macro-pore phase, intermediate phase and grain phase) on pore-scale images helps to understand the importance of connected macro-porosity in the fluid flow for the samples studied. We then compute the petrophysical properties for all the samples using PN and LB simulations in order to study the influence of voxel resolution on petrophysical properties. We then introduce a numerical coarsening scheme which is used to coarsen a high voxel resolution image (4.4 µm) to lower resolutions (6.2 µm, 8.3 µm and 10.2 µm) and study the impact of coarsening data on macroscopic and multi-phase properties. Numerical coarsening of high resolution data is found to be superior to using a lower resolution scan because it avoids the problem of partial volume effects and reduces the scaling effect by preserving the pore-space properties influencing the transport properties. This is evidently compared in this study by predicting several pore network properties such as number of pores and throats, average pore and throat radius and coordination number for both scan based analysis and numerical coarsened data.
Keywords
pore-scale; flow; micro-CT; voxel resolution; porosity; single-phase permeability; lattice Boltzmann; Pore Network; numerical coarsening
ACCEPTED MANUSCRIPT
1.
Introduction
The principal knowledge of fluid flow in porous media is allied with three different length scales which are defined as pore-scale (microscopic, μm), lab-scale (macroscopic, mm to cm) and field-scale (reservoir, km) (Zhang et al., 2000). Recent pore-scale studies accompanied by complex fluid flow modelling techniques on sandstones and carbonate rocks have proved effective to understand the multi-phase flow processes associated with enhanced oil-gas recovery and CO2 sequestration processes (Blunt et al., 2002; 2013, Knackstedt et al., 2006
and Crawshaw & Boek, 2013). A pore-scale study comprises two key procedures: imaging and modelling. 3D pore-scale imaging methods, such as high resolution X-ray computed tomography (Spanne et al., 1994, Dong & Blunt 2009 and Peng et al., 2012) and FIB-SEM (Focussed Ion Beam –Scanning Electron Microscopy) (Bera et al., 2011) are now widely used to image and reconstruct 3D images of complicated rock samples with a resolution on the micrometre to nanometre scale. Recent advances in 3D pore-scale numerical modelling techniques, such as network modelling (indirect) and lattice Boltzmann simulation (direct) have been used as a powerful predictive tool for solving the flow in complex rock geometries (Knackstedt et al., 2001, Gharbi & Blunt, 2012, Blunt et al., 2013, Boek & Venturoli, 2010 and Yang & Boek, 2013).
The essence of pore-scale studies is to encapsulate the understanding of complicated physical fluid flow processes from small scale (microscopic) to large scale (macroscopic and field). However, the process of up-scaling from pore-scale to macroscopic-scale has encountered many challenges due to limitations associated with pore-scale imaging. There is always a compromise between the spatial (voxel) resolution and the physical area of the sample (field of view, FOV) to be scanned by the imaging methods, specifically X-ray micro-CT in our case. Consider, for instance, a rock sample scanned to obtain a 3D pore-scale image using Focussed Ion Beam at voxel resolution 10 nm with a physical scanned volume of 10 μm3 capturing the pore geometry for pore sizes less than 0.1 μm and XMT imaging technique at voxel resolution 3 μm with the physical scanned area of 3 mm3
, to cover at-least pore-scale heterogeneity. The former (FIB) technique gives information down the nanometre scale, but this comes at the cost of smaller FOV which cannot incorporate the different scales of heterogeneity even at the pore-scale range. The latter (XMT) technique gives a larger FOV with lower resolution which lacks detailed micro- pore space information. Now let us
ACCEPTED MANUSCRIPT
consider a realistic case for modelling single- and multi-phase simulation on larger 3D data sets of 20003 voxels scanned at voxel resolution 1.5 μm representing 3 mm3 of physical sampling area. In this case, a large amount of computational power and time is required which demands the prediction to be done on sub-sample data sets and is a challenge for up-scaling (Blunt et al., 2013 and Yang & Boek, 2013). The above problem was also addressed by Peng et al (2012), Al-Ansi et al (2013), Shah et al (2013) and Peng et al (2014). Peng et al
(2012) have investigated the effect of resolution on pore-space properties of Berea sandstone with two different voxel resolutions: 0.35 μm at smaller FOV, and 12.7 μm at larger FOV. Al-Ansi et al (2013) have studied the effect of five different voxel resolutions on predicted transport properties for the two sandstones Doddington and Clashach. They found that the predicted porosity was insensitive to voxel resolution, while single-phase permeability changes were considerable. However, these previous studies were carried out on different sampling areas (Peng et al., 2012), limited range of voxel resolution (1.85 μm and 5.92 μm)
(Peng et al., 2014) and only three homogenous rock systems were studied, which is too sparse to fully address the issue of voxel resolution on transport properties.
In this study, a careful analysis was done to understand the effect of scanned voxel resolution using the XMT technique on the 3D pore-scale images of different porous media varying from sandstones to carbonates scanned at different voxel resolution (4.4 μm, 6.2 μm, 8.3 μm and 10.2 μm) by keeping the scanned FOV constant for all samples which can be ideally used to align or register the images to allow direction comparison between different resolutions using 3D image registration (Latham et al., 2008). However, 3D image registration is beyond the scope of this study. Three dimensional micro-CT images were segmented into three phases, including macro-pore phase, intermediate phase and grain phase. Then we studied the effect of voxel resolution on the macro-pore phase (macro-porosity) and intermediate phase (micro-porosity) and the fluid flow properties of the connected macro-pore space using lattice-Boltzmann (LB) and pore network (PN) modelling methods. We have also applied a numerical coarsening algorithm to compare it to the results directly scanned at lower voxel resolution and to reduce the computational power and time required to accurately predict the flow properties using the LB and PN method.
2.
Materials and Methods
We study ten representative rocks: these include five sandstone samples and five carbonate samples as shown in Figure 1.
ACCEPTED MANUSCRIPT
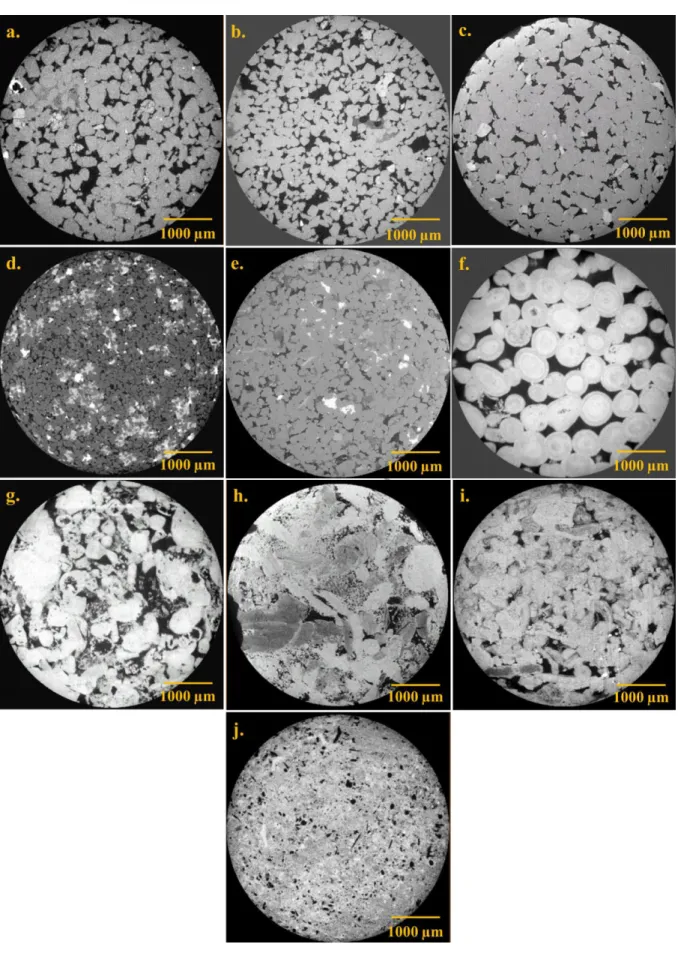
Figure 1 Two-dimensional cross-section of three dimensional micro-CT images of different sandstones and carbonates samples scanned at voxel resolution of 4.4 µm. (a) Doddington sandstone (b) Bentheimer sandstone (c) Clashach sandstone (d) Berea sandstone (e) Stainton sandstone (f) Ketton (g) Middle Eastern carbonate (h) Estaillades carbonate. (i) Indiana Limestone 1 (j) Middle Eastern sample 3. In all figures, the pore-space is shown in dark.ACCEPTED MANUSCRIPT
The first five images in Figure 1(a) – (e), are sandstones (Doddington, Bentheimer, Clashach, Berea and Stainton) and Figure 1(f) - (j) show carbonates (Ketton, ME5, Estaillades, Indiana Limestone 1 and ME3) which are likely to contain significant micro-porosity and well defined macro-porosity. The grayscale values appears to vary dramatically across these images, perhaps due to the use of region of interest scanning and manually reconstructed images with different beam hardening constant. Detailed information on mineral composition for sandstone and carbonate samples is shown in Table 1 and Table 2 respectively.
Table 1 Mineral composition obtained for sandstone samples using X-ray Diffraction Analysis (XRD).
a Analysis conducted at Weatherford Laboratories (East Grinsted, UK). b Andrew et al., 2014
c
Ngwenya et al., 1995
Table 2 Mineral composition obtained for carbonate samples using X-ray Diffraction Analysis (XRD).
Minerals Kettona ME5a Estailladesa Indiana Limestone 1a ME3a Calcite 99.1 % 97.2 % 97.9 % 99.0 % 93.3 % Quartz 0.9 % 2.8 % 2.1 % 1.0 % 1.5 % Dolomite - - - - 5.2 %
a Analysis conducted at Weatherford Laboratories (East Grinsted, UK).
Dry scans of small cylindrical sandstone and carbonate cores (5 mm diameter and 10 mm length) were scanned using a laboratory micro-CT scanner, a Versa XRM-500 X-Ray Microscope (Zeiss X-Ray Microscopy, Pleasanton, CA, USA). To study and analyse the effect of scaled voxel resolution on the pore-scale micro-CT images and corresponding transport properties, it was necessary to scan the sample with the same field of view with respect to change in voxel resolution. X-rays from a micro-focused X-ray source are used to look into the sample. The X-ray source produces a polychromatic X-ray beam and the projection data (3000 projections) were collected with a cone beam along the circular trajectory. The voltage was set at 80kV and power at 7W. In our cone beam set-up, the voxel resolution is controlled by the proximity of the sample to the beam or X-ray source. The 3D pore-scale images of the samples were scanned at four different voxel resolutions acquiring the same physical field of view by adjusting the X-ray source and detector position along
Minerals Doddingtona Bentheimerb Clashachc Bereaa Staintona Quartz 93.6 % 95 % 90 % 87.3 % 91.1 % Illite + Mica 2.0 % 1 % - 3.4 % 3.5 % Kaolinite 1.9 % - - 4.2 % 2.4 % K-Feldspar 1.7 % 4 % 10 % 3.0 % 1.9 % Chlorite 0.6 % - - 1.0 % 0.2 % Calcite 0.2 % - - 0.4 % 0.2 % Dolomite - - - 0.5 % 0.3 %
ACCEPTED MANUSCRIPT
with using an appropriate magnification lens. A 4X magnification was used to obtain pore-scale images of 10003 voxels at voxel resolution 4 μm with 0.3 seconds and 6 μm with 3.5 seconds exposure time per projection respectively. A 1X magnification was used to obtain pore-scale images of 6003 voxels at voxel resolution 8 μm with 2.5 seconds and 10 μm with 5.2 seconds exposure time per projection respectively. 3D images of all the samples were first
cropped into 3D cubic images (4.4 μm – 5753 voxels, 6.2
μm – 4153
voxels, 8.3 μm – 3133 voxels and 10.2 μm – 2553 voxels reproducing the same field of view (~ 2.5 mm) for all the different voxel resolutions. For convenience the voxel resolutions will be labelled as 4 µm, 6 µm, 8 µm and 10 µm.
2.1 Image processing
The application of computed tomography (CT) imaging to characterize porous media is based on grayscale value. The porous rock samples contain volumes of empty space, called void or the pore-space, while composites are made up of several different materials, each with a reasonably uniform density represented by different CT number (Sheppard et al., 2004). In geological studies, the standard approach to deal with CT images is to employ image processing techniques to obtain different rock properties such as porosity and surface area (Lindquist & Venkatarangan, 1999 and Taud et al., 2005). Image processing is a vital step after acquiring 3D micro-CT images of samples. It forms the back-bone of digital rock physics which seeks to accurately predict the petrophysical properties of any complicated rock system. The grayscale micro CT image seen in Figure 2, consists of dark phase with low grayscale value which relates to macro-pore space; a bright phase corresponding to grains with high density material with a high grayscale value; and an intermediate phase corresponding to a mixture of high and low density material phase along with sub-resolution micro-pore space which cannot be resolved using current micro-CT capabilities.
ACCEPTED MANUSCRIPT
Figure 2 Two-dimensional cross-section of a three-dimensional raw micro-CT image of Estaillades carbonate, showing three main phases: macro-pore space, intermediate phase (micro-pore + grain) which is unresolved, and grain phase.
In the past, few researchers have given information about the segmentation of micro-CT images into pore-space and grain-space. A promising method, converging active contours (CAC), was described by Sheppard et al (2004). An interesting review was done on different image processing steps including non-local means filter for image enhancement, and watershed segmentation for image classification by Schlüter et al (2014). In this study, we used a non-local means filter to improve the signal-to-noise ratio and to preserve the edges between pore and grain phase of acquired micro-CT images (Buades et al., 2005). A marker-seeded watershed algorithm was used to segment images into pore and grain phases. This method relies not only on the intensity field of the image but also on the intensity gradient magnitudes, with the seed markers generated by the use of 2D histograms (Andrew et al., 2014 and Jones et al. 2009).
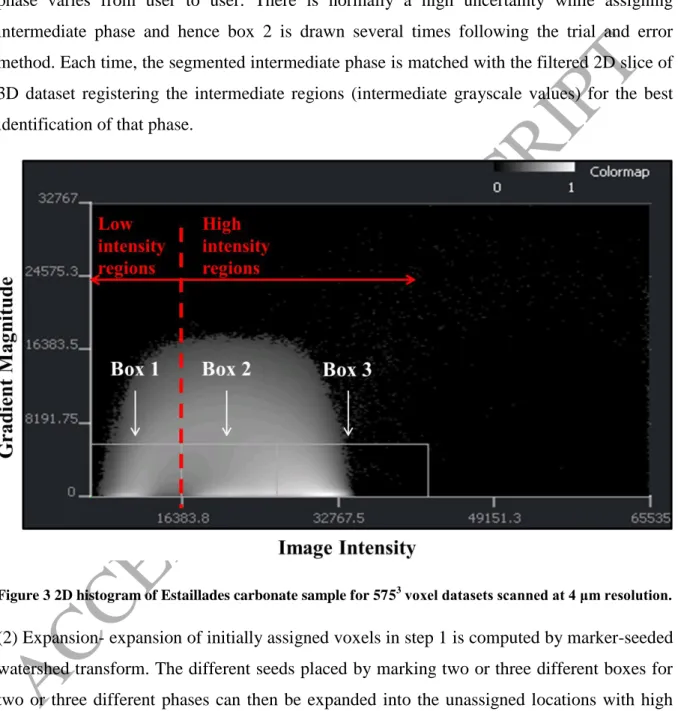
The 2D Histogram Segmentation module within the program Avizo Fire 8.0 (Visual Sciences Group, Burlington, MA, USA) has two main processes: (1) Classification - initialization of voxels into two or more phases using 3D voxel intensity and gradient magnitude. The intensity map of the 3D volume is input into the 2D histogram segmentation module which computes the gradient magnitude so that the user is presented with 2D scatterplot that shows image intensity on x-axis and gradient magnitude on y-axis. A 2D histogram of a multiphase material will look like a small cluster of high density pixels somewhere near the bottom of the histogram for each individual phase. The 2D histogram for Estaillades carbonate (4 μm voxel resolution) is shown in Figure 3. The low gradient-magnitude regions in the 2D histogram are assigned by drawing a box (Box 1) which represents macro-pore phase in our
ACCEPTED MANUSCRIPT
case. The assigned Box 1 regions are generally unambiguous and can be definitively classified as a single phase. In contrast, high gradient-magnitude regions are ambiguous, and may belong to either or combination of two phases. Box 2 is then assigned carefully by the user representing the intermediate phase and box 3 corresponds to grain phase. The segmentation method is partly subjective as the marking of intermediate phase and grain phase varies from user to user. There is normally a high uncertainty while assigning intermediate phase and hence box 2 is drawn several times following the trial and error method. Each time, the segmented intermediate phase is matched with the filtered 2D slice of 3D dataset registering the intermediate regions (intermediate grayscale values) for the best identification of that phase.
Figure 3 2D histogram of Estaillades carbonate sample for 5753 voxel datasets scanned at 4 μm resolution.
(2) Expansion- expansion of initially assigned voxels in step 1 is computed by marker-seeded watershed transform. The different seeds placed by marking two or three different boxes for two or three different phases can then be expanded into the unassigned locations with high gradient magnitude using the watershed transform algorithm. The watershed transform is principally more sensitive to the initialization of voxels with different phases performed in step 1. The watershed transform algorithm models the flow of water from an initial seed or labelled regions in a 3D image until the regions reach the watershed lines (Vincent & Soille, 1991) which is determined by the computed gradient magnitude in step 1.
ACCEPTED MANUSCRIPT
In this study, the important issue arises regarding the consistent segmentation process at different resolutions. The low gradient regions (Box 1) are assigned unambiguously assuredly represents the macro-pore phase for different resolutions. The segmentation of intermediate phase (Box 2) and grain phase (Box 3) is performed separately for each of the respected resolution dataset because of the magnitude of partial volume effects (portion of two phases which are averaged together) and its changes with the scale (from finer to coarser resolution) which depends on two main parameters: (1) image processing techniques and manual segmentation errors, and (2) feature of the underlying pore size distribution. For instance, if there are many pores with 10-15 μm diameters, then they will be well resolved at 4 μm resolution, but they will be assigned to intermediate phase at coarser resolution. Figure 4 shows the effect of scanned voxel resolution (4 μm to 10 μm) on partial volume effects, and disappearance of resolved pore features at 4 μm to intermediate phase at 10 μm for the same 2D slice of Estaillades carbonate.
ACCEPTED MANUSCRIPT
Figure 4 Two-dimensional cross-section of micro-CT image of Estaillades carbonate. (a) 2D filtered slice scanned at 4 μm resolution. (b) Three-phase segmentation at 4 μm resolution. (c) 2D filtered slice scanned at 10 μm resolution. (d) Three-phase segmentation at 10 μm resolution. 2D image with cyan colour represents macro-pore phase, red colour represents grain phase and dark blue colour represents intermediate phase (combination of unresolved micro-pores and grains).
In this study, we carefully segment macro-pore phase, intermediate phase and grain phase for all the 10 different rocks scanned at 4 different voxel resolutions.
ACCEPTED MANUSCRIPT
2.2 Modelling
We then compute and predict the transport properties using pore network modelling (PN) and Lattice Boltzmann (LB) simulations for 3D pore-scale images of rocks scanned at 4 different voxel resolution to study the effect of voxel resolution on transport properties. In this study, the three phase segmented images are converted into two phase binarised image with macro-pore phase as 0’s and combining intermediate and impermeable grain phase as 1’s for calculating LB and PN single-phase permeability. Pore network modelling extracts topologically equivalent pore and throat networks from binarised 3D segmented micro-CT images of rocks using maximal ball algorithm (Silin & Patzek, 2006) This algorithm constructs the largest spheres centred on each void voxel that just fits in the pore-space and defines the throats as chains of smaller balls that connect pores. Such a pore network extraction code developed by Dong & Blunt (2009) is used to extract the pore and throat networks from 3D micro-CT images of rocks giving valuable pore-scale properties such as number of pores and throats; minimum, maximum and average pore and throat radius; average coordination number (average number of throats connected to single pore). Capillary controlled displacement is simulated using a two-phase pore network model developed by Valvatne & Blunt (2004). The lattice Boltzmann (LB) method is a direct modelling technique which computes single and multi-phase flow directly on 3D pore-scale segmented images without network extraction. The LB method computes a discrete version of the Boltzmann equation in which a velocity distribution of fictitious fluid particles at each grid node undergoes ‘collision’ and ‘streaming’ steps leading to a solution for the incompressible Naviers-Stokes equation (Chen et al., 1992). A 3D single-phase LB solver is used to calculate the single-phase permeability of the sample (Yang et al., 2013, Yang & Boek, 2013). Two-phase pore network modelling assumes the medium is initially filled with the wetting Two-phase (brine or water). The primary drainage process starts by injecting the non-wetting phase (oil) displacing the wetting phase (water). After oil invasion, waterflooding is then simulated and relative permeability curves are generated (Valvatne & Blunt, 2004).
3.
Results and Discussion
3.1 Porosity and Single-Phase Permeability
Macro-porosity and intermediate-phase content was calculated for each of the different rocks by using the three phase segmented data and calculating the ratio of the total number of macro-pore (and intermediate) voxels to the total number of voxels present in the scanned
ACCEPTED MANUSCRIPT
rock volume. The single-phase permeability was predicted using PN modelling by extracting pore and throat networks, and LB simulation on the macro-phase segmented sandstone and carbonate sample images. The average coordination number is also calculated for all the carbonate and sandstone samples at varying voxel resolution which represents the number of independent throats connected to a pore, and has a critical influence on the transport properties (Yuan, 1981, Jerauld & Salter 1990, Arns et al., 2004, Dong & Blunt 2009 and Tanino & Blunt 2012). The experimental (total) porosity and single-phase permeability was measured on the each of the cylindrical sandstone and carbonate core samples. Note that these measurements are for the whole sample volume and not only the scanned region. The porosity was measured using bulk volume measurements saturating the core with water in a vacuum for two hours and single-phase permeability was measured using Darcy flow equation by injecting fluid at constant flow rate and monitoring the pressure drop across the length of the sample. The single-phase experiments were performed at three different flow rates in a flow cell designed for accurate measurements (Gharbi & Blunt, 2012).
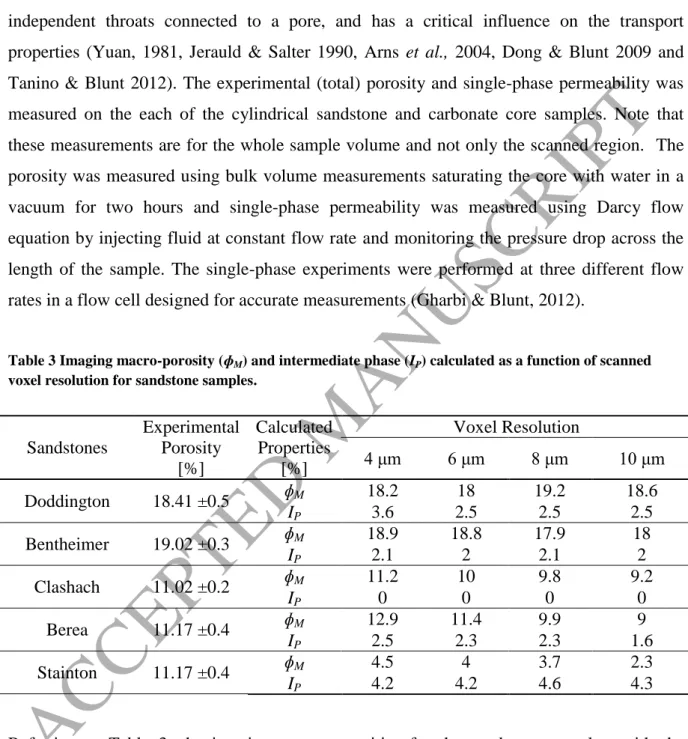
Table 3 Imaging macro-porosity (ɸM) and intermediate phase (IP) calculated as a function of scanned
voxel resolution for sandstone samples.
Referring to Table 3, the imaging macro-porosities for the sandstone samples, with the exception of Stainton, match the experimental porosities. This is expected since these samples were segmented with very little intermediate phase and confirms that there is no unresolved micro-pore phase below the scanned limit of 4 μm in this study. Comparing the imaging macro-porosity and experimental porosity, it is clear that the low segmented intermediate phase for the sandstone samples are attributed to different minerals (refer to
Sandstones Experimental Porosity [%] Calculated Properties [%] Voxel Resolution 4 μm 6 μm 8 μm 10 μm Doddington 18.41 ±0.5 ɸM 18.2 18 19.2 18.6 IP 3.6 2.5 2.5 2.5 Bentheimer 19.02 ±0.3 ɸM 18.9 18.8 17.9 18 IP 2.1 2 2.1 2 Clashach 11.02 ±0.2 ɸM 11.2 10 9.8 9.2 IP 0 0 0 0 Berea 11.17 ±0.4 ɸM 12.9 11.4 9.9 9 IP 2.5 2.3 2.3 1.6 Stainton 11.17 ±0.4 ɸM 4.5 4 3.7 2.3 IP 4.2 4.2 4.6 4.3
ACCEPTED MANUSCRIPT
Table 1) with different X-ray absorption.. The imaging macro-porosity and intermediate phase calculated for Bentheimer and Doddington sandstone remains insensitive against resolution whereas Berea and Clashach sandstone show a 2 % variation which is due to increase in partial volume effects with the change in voxel resolution from 4 μm to 10 μm. In contrast, the imaging macro-porosity for the carbonate samples does not match the experimental porosity (refer Table 4). Ketton and Middle Eastern sample 5 (ME5) carbonates show the imaging macro-porosity at-least 30 % lower, Estaillades and Indiana Limestone 1 at-least 70 % lower and ME3 shows a 90 % lower than the experimental total porosity. Therefore, the segmented intermediate fraction (intermediate grayscale values) in the case of carbonates represents a considerable amount of unresolved micro pore phase as most of the carbonates consist mainly of calcite mineral as the grain phase (higher grayscale values). This leads to the question of whether the segmented intermediate phase consisting of micro-pores in carbonates contributes strongly to the single-phase fluid flow.
Table 4 Imaging macro-porosity (ɸM) and intermediate phase (IP) calculated as a function of scanned
voxel resolution for carbonate samples.
The effect of change in voxel resolution on the pore network properties by comparing the rock samples in terms of number of pores, throats, average pore radius, average throat radius and average coordination number are shown in the Table 5 and Table 6 for sandstones and carbonates respectively. The number of pores and throats decreases with increasing pore and throat radius for all the rocks as the finer details of the pore-space are limited to resolve with change in voxel resolution from 4 μm to 10 μm.
Carbonates Experimental Porosity [%] Calculated Properties [%] Voxel Resolution 4 μm 6 μm 8 μm 10 μm Ketton 18.93 ±0.1 ɸM 14.1 14.7 14.3 14.3 IP 2.5 1.5 1.8 1.4 ME5 24.77 ±0.8 ɸM 15.4 13.8 13.3 13.7 IP 19.1 15.5 14.3 13.1 Estaillades 22.55 ±0.9 ɸM 7.4 6.1 4.9 4.2 IP 38.9 43.3 44.3 44.1 Indiana Limestone 1 25.81 ±0.5 ɸM 2.6 2.3 1.3 1.2 IP 12.3 11.6 8.9 7.8 ME3 10.65 ±0.4 ɸM 1.6 1.3 1.3 1.1 IP 19.1 15.5 14.3 13.1
ACCEPTED MANUSCRIPT
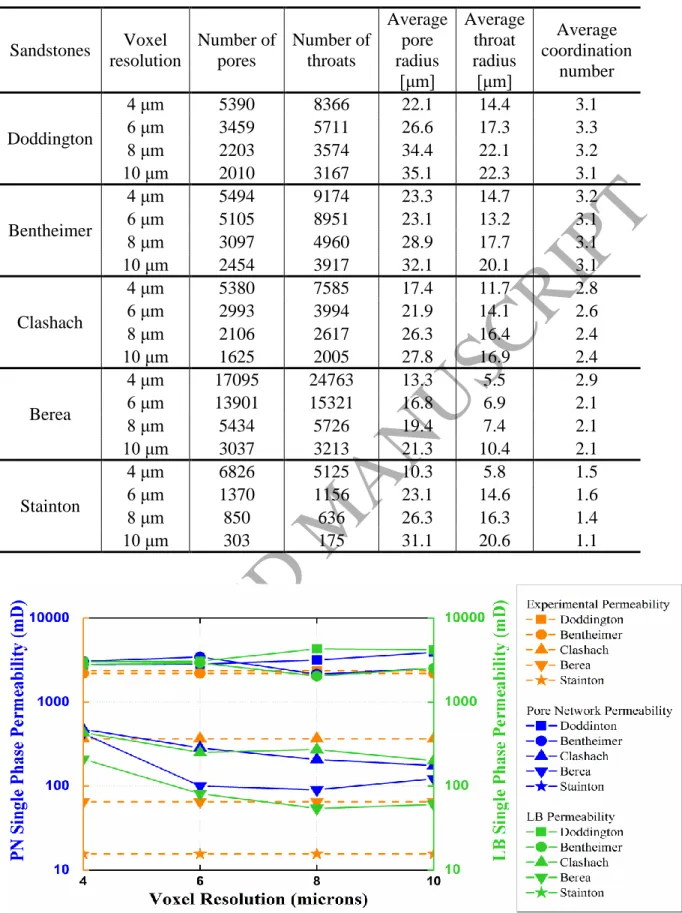
Table 5 Pore network properties calculated as a function of scanned voxel resolution for sandstones
Sandstones Voxel resolution Number of pores Number of throats Average pore radius [μm] Average throat radius [μm] Average coordination number Doddington 4 μm 5390 8366 22.1 14.4 3.1 6 μm 3459 5711 26.6 17.3 3.3 8 μm 2203 3574 34.4 22.1 3.2 10 μm 2010 3167 35.1 22.3 3.1 Bentheimer 4 μm 5494 9174 23.3 14.7 3.2 6 μm 5105 8951 23.1 13.2 3.1 8 μm 3097 4960 28.9 17.7 3.1 10 μm 2454 3917 32.1 20.1 3.1 Clashach 4 μm 5380 7585 17.4 11.7 2.8 6 μm 2993 3994 21.9 14.1 2.6 8 μm 2106 2617 26.3 16.4 2.4 10 μm 1625 2005 27.8 16.9 2.4 Berea 4 μm 17095 24763 13.3 5.5 2.9 6 μm 13901 15321 16.8 6.9 2.1 8 μm 5434 5726 19.4 7.4 2.1 10 μm 3037 3213 21.3 10.4 2.1 Stainton 4 μm 6826 5125 10.3 5.8 1.5 6 μm 1370 1156 23.1 14.6 1.6 8 μm 850 636 26.3 16.3 1.4 10 μm 303 175 31.1 20.6 1.1
Figure 5 Predicted PN and LB single-phase permeability as a function of scanned voxel resolution for sandstones: Doddington (rectangles), Bentheimer (circles), Clashach (upper triangles), Berea (lower triangles) and Stainton (stars). The measured experimental permeability is shown with dashed lines. Single-phase permeability simulation for the Stainton sample resulted in no flow and is therefore missing from the figure.
ACCEPTED MANUSCRIPT
Referring to Table 5 and Figure 5, the predictions of single-phase permeability are correlated with the average coordination number obtained from the extracted networks of 3D pore-scale images of the sample. The Doddington and Bentheimer sandstone samples have well-connected macro-pore phases with a calculated average coordination number of 3 which remains approximately constant with change in voxel resolution. Therefore, the predicted PN and LB single-phase permeability agree with the experimental permeability for whole range of scanned resolutions used here. The predicted permeability for Berea sandstone at 4 μm voxel resolution is over-estimated compared with experimental permeability. Also, the predicted permeability decreases with change in voxel resolution from 4 μm to 10 μm which is because of the scaling problem. Essentially, the narrow throats which are important for pore continuity and coordination number, are well resolved at 4 μm giving higher coordination number of 2.9 for Berea while the same resolved throats disappears at coarser resolutions giving lower coordination and predicting low permeability. Clashach sandstone shows a trend of slight decrease in the predicted permeability, also due to the scaling problem linked with a decrease in average coordination number. Stainton sandstone is a special case which has a high percentage of unresolved micro-pore phase with poorly connected macro-pore phase and a low coordination number of 1; hence we observe a large difference in experimental and imaging porosity. The PN and LB models predict zero permeability indicating no flow path. This indicates that the permeability observed experimentally in the Stainton sample is due to connectivity through the unresolved micro pores further implied by the experimental permeability being three orders of magnitude lower than Bentheimer and Doddington. For sandstone samples, with the exception of Stainton, the imaging macro-porosity relatively insensitive to changes in the voxel resolution and well-resolved connected macro-pore phase dominates the single-phase fluid flow.
ACCEPTED MANUSCRIPT
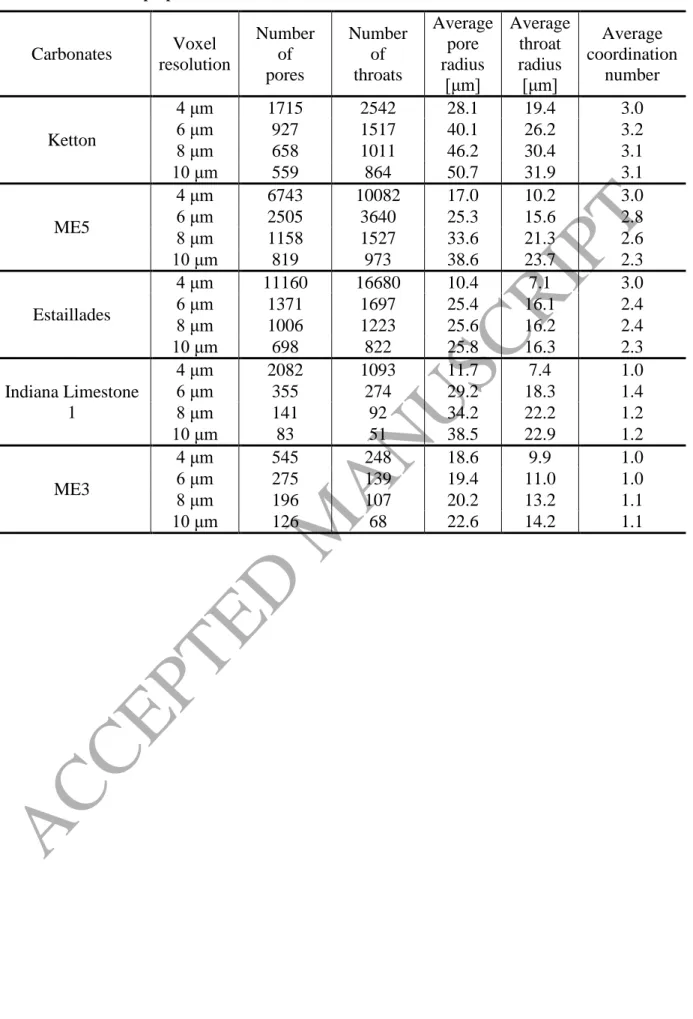
Table 6 Pore network properties calculated as a function of scanned voxel resolution for carbonates
Carbonates Voxel resolution Number of pores Number of throats Average pore radius [μm] Average throat radius [μm] Average coordination number Ketton 4 μm 1715 2542 28.1 19.4 3.0 6 μm 927 1517 40.1 26.2 3.2 8 μm 658 1011 46.2 30.4 3.1 10 μm 559 864 50.7 31.9 3.1 ME5 4 μm 6743 10082 17.0 10.2 3.0 6 μm 2505 3640 25.3 15.6 2.8 8 μm 1158 1527 33.6 21.3 2.6 10 μm 819 973 38.6 23.7 2.3 Estaillades 4 μm 11160 16680 10.4 7.1 3.0 6 μm 1371 1697 25.4 16.1 2.4 8 μm 1006 1223 25.6 16.2 2.4 10 μm 698 822 25.8 16.3 2.3 Indiana Limestone 1 4 μm 2082 1093 11.7 7.4 1.0 6 μm 355 274 29.2 18.3 1.4 8 μm 141 92 34.2 22.2 1.2 10 μm 83 51 38.5 22.9 1.2 ME3 4 μm 545 248 18.6 9.9 1.0 6 μm 275 139 19.4 11.0 1.0 8 μm 196 107 20.2 13.2 1.1 10 μm 126 68 22.6 14.2 1.1
ACCEPTED MANUSCRIPT
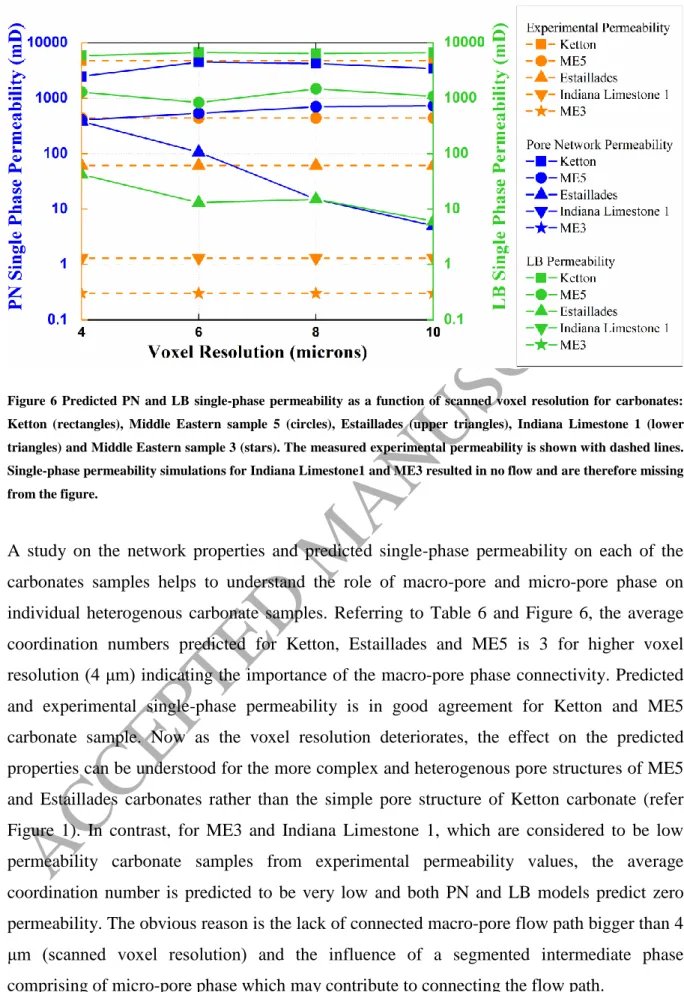
Figure 6 Predicted PN and LB single-phase permeability as a function of scanned voxel resolution for carbonates: Ketton (rectangles), Middle Eastern sample 5 (circles), Estaillades (upper triangles), Indiana Limestone 1 (lower triangles) and Middle Eastern sample 3 (stars). The measured experimental permeability is shown with dashed lines. Single-phase permeability simulations for Indiana Limestone1 and ME3 resulted in no flow and are therefore missing from the figure.
A study on the network properties and predicted single-phase permeability on each of the carbonates samples helps to understand the role of macro-pore and micro-pore phase on individual heterogenous carbonate samples. Referring to Table 6 and Figure 6, the average coordination numbers predicted for Ketton, Estaillades and ME5 is 3 for higher voxel resolution (4 μm) indicating the importance of the macro-pore phase connectivity. Predicted and experimental single-phase permeability is in good agreement for Ketton and ME5 carbonate sample. Now as the voxel resolution deteriorates, the effect on the predicted properties can be understood for the more complex and heterogenous pore structures of ME5 and Estaillades carbonates rather than the simple pore structure of Ketton carbonate (refer Figure 1). In contrast, for ME3 and Indiana Limestone 1, which are considered to be low permeability carbonate samples from experimental permeability values, the average coordination number is predicted to be very low and both PN and LB models predict zero permeability. The obvious reason is the lack of connected macro-pore flow path bigger than 4 μm (scanned voxel resolution) and the influence of a segmented intermediate phase comprising of micro-pore phase which may contribute to connecting the flow path.
ACCEPTED MANUSCRIPT
3.2 Numerical Coarsening
The pore-scale transport properties can, in many cases, be obtained accurately in lower resolution digital rock samples than the actual resolution of scan. By numerically coarsening the rock image using a simple but efficient algorithm, the computational power and time required for such calculations can be reduced. The binarized lattice (0’s and 1’s) is numerically coarsened by mapping coarser grid onto the original lattice (see Figure 7 (a)). For each new cell, the amount of solid (1’s – grain phase, white colour) contained within is computed from the exact overlap on the original grid. A new cell comprising more than 50% solid is set solid, otherwise it is set to a fluid node (0’s – macro-pore phase, black colour). This algorithm preserves total porosity. Figure 7 (b) shows the binarised 2D slice of 3D image of scanned Estaillades carbonate at high resolution (4 μm), numerically coarsened to low resolution (10 μm) as shown in Figure 7 (c) demonstrating the importance of numerical coarsening technique maintaining the morphological features important for fluid flow when compared with the same 2D slice segmented at low scanned resolution (10 μm) shown in Figure 7 (d).
Figure 7 (a) Numerical coarsening scheme showing the new, coarser grid mapped onto the original lattice. One new cell is shown. (b) Segmented macro-pore phase of Estaillades carbonate scanned at 4 μm resolution. (c) Numerically coarsened macro-pore phase of Estaillades carbonate at 10 μm resolution. (d) Segmented macro-pore phase of Estaillades carbonate scanned at 10 μm resolution.
ACCEPTED MANUSCRIPT
Numerical coarsening can be considered as an important asset in improving the computational efficiency of transport property calculations. LB simulations demand large computational power and time for calculating single and multi-phase properties and have to compromise with the sample size (Ramstad et al., 2012 and Blunt et al., 2013). In this study, the predicted LB single-phase permeability on each sample was run as a single simulation on 128 CPUs in parallel environment. The computational time scales approximately N4, where N is the number of voxels per side length. As expected, the calculation time for the LB single- phase simulations decreases considerably from high (5753 voxels – 4 μm) to low (2553 voxels -10 μm) resolution with respect to porosity and pore geometry.
In this study, 3-D micro-CT scanned rock samples at high voxel resolution (4 μm) consisting of 5753 voxels are coarsened down to lower resolution data (6 μm, 8 μm and 10 μm) generating respectively 4153, 3133 and 2553 data sets. The macro-porosity and single-phase permeability is predicted for three sandstone samples (Bentheimer, Clashach and Berea) and two carbonate samples (Estaillades and Middle Eastern sample 5) to observe the effect of the change in voxel resolution due to the coarsening effect. The motivation for selecting the sets of sandstone and carbonate samples for studying the coarsening effect is mainly because the set shows variation in predicted macro porosity and permeability due to a change in voxel resolution.
Table 7 Macro-porosity calculated at high resolution (4 µm), and numerically coarsened to lower resolutions (6 µm, 8 µm and 10 µm) compared with imaging macro-porosity at different scanned resolutions.
Voxel resolution Imaging macro-porosity [%] Coarsened macro-porosity [%] Bentheimer sandstone 4 μm 18.9 18.9 6 μm 18.8 18.8 8 μm 17.9 18.8 10 μm 18.0 18.8 ME5 carbonate 4 μm 15.4 15.3 6 μm 13.8 15.3 8 μm 13.3 15.2 10 μm 13.7 15.2 Clashach sandstone 4 μm 11.3 11.3 6 μm 10.0 11.3 8 μm 9.8 11.1 10 μm 9.3 11.1 Berea sandstone 4 μm 12.9 12.9 6 μm 11.4 12.6 8 μm 9.9 12.5 10 μm 9.1 12.5
ACCEPTED MANUSCRIPT
Estaillades carbonate 4 μm 7.4 7.4 6 μm 6.1 7.2 8 μm 4.9 7.1 10 μm 4.2 7.0Referring to Table 7, the coarsened macro-porosity remains constant for both sandstone and carbonate samples when the high voxel resolution data set is numerically coarsened. The coarsened low resolution data sets are used as input for the PN and LB models for predicting single-phase permeability, shown in Table 8. Comparing with the varying predicted permeability for the scanned samples at different resolutions, we can observe that the LB and PN models shows the same trend of constant predicted permeability for all the coarsened resolution data.
Table 8 PN and LB single-phase permeability predicted at high resolution (4 µm), and numerically coarsened to lower resolutions (6 µm, 8 µm and 10 µm) compared with PN and LB single-phase permeability predicted at different scanned resolutions. Voxel resolution PN permeability [mD†] PN permeability [mD†] LB permeability [mD†] LB permeability [mD†] scanned resolutions numerically coarsened scanned resolutions numerically coarsened Bentheimer sandstone 4 μm 3048 3048 2802 2804 6 μm 3442 3050 2922 2630 8 μm 2143 3001 2034 2652 10 μm 3004 3150 2568 2675 ME5 carbonate 4 μm 409 409 1287 1287 6 μm 535 1197 832 1405 8 μm 700 1107 1475 1483 10 μm 725 1827 1079 1549 Clashach sandstone 4 μm 447 447 434 434 6 μm 284 408 251 406 8 μm 207 598 272 421 10 μm 175 401 199 426 Berea sandstone 4 μm 421 421 209 209 6 μm 100 555 80 200 8 μm 90 505 54 199 10 μm 122 234 60 207 Estaillades carbonate 4 μm 381 381 42 41 6 μm 106 209 13 28 8 μm 15 401 15 31 10 μm 5 460 6 33 †1mD= 0.98x10⁻¹²m2
ACCEPTED MANUSCRIPT
Table 9 (a), (b), (c), (d) and (e) summarises and compares the network properties calculated from the scanned resolution and coarsened resolution data for five different rock samples. The number of pores and throats obtained from numerically coarsened data (6 μm, 8 μm and 10 μm) are much higher than the corresponding lower scanned resolutions for all of the samples studied. The segmentation error related to partial volume effects is no longer an important consideration in numerically coarsening technique and hence the macro-pore phase segmented at high resolution is greatly preserved when coarsened to low resolution data. The average pores and throat radii contributing to the flow also shows large variations which increase as the scanned voxel resolution is reduced. In contrast numerical coarsening maintains a fairly constant average pore/throat size from high resolution to numerically coarsened resolution data. The limitation for applying the numerical coarsening algorithm to a sample mainly depends on the difference between the calculated average pore and throat radius at highest resolution compared at the coarsened resolution.
Table 9 (a) Comparision of pore network properties at scanned and coarsened resolution for Bentheimer sandstone. Bentheimer sandstone Number of pores Number of throats Average pore radius [μm] Average throat radius [μm] Average coordination number 4 μm 5494 9174 23.3 14.7 3.2 6 μm scanned 5105 8951 23.1 13.2 3.1 coarsened 4966 8552 24.0 16.1 3.3 8 μm scanned 3097 4960 28.9 17.7 3.1 coarsened 4618 8138 24.1 16.4 3.3 10 μm scanned 2454 3917 32.1 20.1 3.1 coarsened 4254 7700 24.4 16.4 3.4
ACCEPTED MANUSCRIPT
Table 9 (b) Comparision of pore network properties at scanned and coarsened resolution for ME5 carbonate. ME5 carbonate Number of pores Number of throats Average pore radius [μm] Average throat radius [μm] Average coordination number 4 μm 6743 10082 17.0 10.2 2.9 6 μm scanned 2505 3640 25.3 15.6 2.1 coarsened 4552 7110 19.3 12.2 3.1 8 μm scanned 1158 1527 33.6 21.3 2.1 coarsened 3787 5887 20.8 13.0 3.1 10 μm scanned 819 973 38.6 23.7 2.1 coarsened 3149 4996 21.6 13.4 3.1
Table 9 (c) Comparision of pore network properties at scanned and coarsened resolution for Clashach sandstone. Clashach sandstone Number of pores Number of throats Average pore radius [μm] Average throat radius [μm] Average coordination number 4 μm 5380 7585 17.4 11.7 2.8 6 μm scanned 2993 3994 21.9 14.1 2.6 coarsened 4457 6289 18.9 12.2 2.8 8 μm scanned 2106 2617 26.3 16.4 2.4 coarsened 3788 5411 19.9 12.5 2.8 10 μm scanned 1625 2005 27.8 16.9 2.4 coarsened 3137 4561 21.1 12.9 2.8
Table 9 (d) Comparision of pore network properties at scanned and coarsened resolution for Berea sandstone. Berea sandstone Number of pores Number of throats Average pore radius [μm] Average throat radius [μm] Average coordination number 4 μm 17095 24763 13.3 5.5 2.9 6 μm scanned 13901 15321 16.8 6.9 2.6 coarsened 13852 20251 13.6 5.9 2.9 8 μm scanned 5434 5726 19.4 7.4 2.4 coarsened 10590 16213 13.6 5.9 2.9 10 μm scanned 3037 3213 21.3 10.4 2.4 coarsened 9384 14141 14.1 6.2 2.9
ACCEPTED MANUSCRIPT
Table 9 (e) Comparision of pore network properties at scanned and coarsened resolution for Estaillades carbonate. Estaillades carbonate Number of pores Number of throats Average pore radius [μm] Average throat radius [μm] Average coordination number 4 μm 11160 16680 10.4 7.1 3.0 6 μm scanned 1371 1697 25.4 16.1 2.4 coarsened 7536 11412 11.9 7.9 3.0 8 μm scanned 1006 1223 25.6 16.2 2.4 coarsened 5377 8442 13.2 8.4 3.1 10 μm scanned 698 822 25.8 16.3 2.3 coarsened 4222 6764 14.2 9.0 3.2
The numerical coarsening can also be applied to the prediction of two-phase flow at different resolution. The experimental determination of relative permeability on different rock samples is often expensive, restricted to a single displacement process on a limited number of samples. Pore-scale imaging and modelling techniques complement experimental measurement of relative permeability curves describing the average flow behaviour of immiscible fluids on large number of samples studying different displacement sequences and wettability conditions. Gharbi & Blunt (2012) have studied the impact of wettability and connectivity on multi-phase properties by analysing relative permeability for a set of carbonate samples. In this study, the aim is to understand the effect of voxel resolution and numerical coarsening scheme on multi-phase flow properties, mainly for residual oil saturation (Sor), for the well-connected macro-pore dominated Bentheimer and a complex
Middle Eastern sample 5 (ME5) carbonate sample, by using a simple water-wet condition using two phase network model developed by Valvatne & Blunt (2004) in the absence of experimental relative permeability data. The representative network of the rock sample which are composed of individual elements such as pores and throats with circular, triangular or square cross sectional shapes requires the presence of wetting layers while the non-wetting phase occupies the centre of the element and wetting phase remains in the corners (Blunt et al., 2012). Using two phase pore network model, relative permeability curves are generated with the input parameters shown in Table 10.
ACCEPTED MANUSCRIPT
Table 10 Input fluid properties and contact angles used in PN simulations (Gharbi & Blunt, 2012: p. 6).
Input parameters
Initial contact angle (degrees) 0 Interfacial tension (mN m-1) 48.3a Water-wet contact angle (degrees) 0-60 Oil-wet contact angle (degrees) 100-160 Oil viscosity (mPa s) 0.547*b Water viscosity (mPa s) 0.4554*c
*Values of viscosity were obtained from Pentland et al. (2010).
a from Zeppieri et al. (2001); linearly extrapolated to 343K.
b Kestin et al. (1981); 5.8wt% NaCl aqueous solution at 10Mpa and 343.2 K. cLee and Ellington (1965); 9480KPa and 344 K
Figure 8 shows the relative permeability curve for the completely water-wet case for Bentheimer and ME5 samples. The fluid physics are as expected in the water-wet case after the water-flooding process. Wetting phase (brine or water) remains in the smallest portions of the pore-space, giving very low water permeability and significant trapping of non-wetting phase (oil) in the larger pores, mainly caused by snap-off (Gharbi & Blunt, 2012).
ACCEPTED MANUSCRIPT
Figure 8 Predicted water-flood relative permeability for the strongly water-wet case as a function of scanned and numerically coarsened resolutions. (a) Bentheimer sandstone – scanned. (b) Bentheimer sandstone – coarsened. (c) Middle Eastern sample 5 carbonate – scanned. (d) Middle Eastern sample 5 carbonate – coarsened.
Figure 9 Residual oil saturation as a function of scanned voxel (solid lines) and numerically coarsened resolution (dotted lines) for: Bentheimer sandstone (rectangles) and Middle Eastern sample 5 carbonate (circles).
ACCEPTED MANUSCRIPT
Referring to Figure 8 (a) and (b), the predicted two-phase relative permeability curves for scanned and numerically coarsened Bentheimer sandstone samples demonstrated good agreement in the high water permeability (Krw) due to consistent pore connectivity across
different resolutions. Correspondingly, as shown in Figure 9, less trapping of oil is observed, predicting low residual oil saturation (Sor) across different scanned resolution and also for the
numerically coarsened data. The predicted single and multi-phase properties for the Bentheimer sandstone sample shows insensitivity to the change in scanned voxel resolution wherein the lowest resolution is sufficient to capture the pore phase. In contrast, referring to Figure 8 (c) and (d) and Figure 9, the two-phase relative permeability curves for scanned ME5 carbonate sample at the highest resolution (4 μm) predicted low water permeability (Krw) due to the highly irregular pore-space with water remaining in the grooves and crevices,
and significant oil is trapped in the larger pores, mainly caused by snap-off leading to high residual oil saturation. As the scanned resolution deteriorates, the residual oil saturation increases due to change in pore-space properties (refer to Table 9(b)) which is not the case for the numerically coarsened data. A minimal variation of predicted residual oil saturation can be observed for ME5 at lower coarsered resolution. The application of the numerical coarsening scheme has proved effective in predicting macroscopic transport properties (imaging macro-porosity and single-phase permeability) and multi-phase properties for sandstones and most of the well-connected macro-pore phase carbonates. This is only true when the high voxel resolution data images are reconstructed and segmented with precise quality and validated with experimental transport properties.
4.
Conclusion
Petrophysical properties for different rock types varying from sandstone to carbonate samples were presented as a function of four different scanned voxel resolutions using micro-CT imaging and two modelling techniques Lattice Boltzmann and Pore-Network Modelling. Three-phase segmentation was used to understand the role of resolved macro-pore space for transport properties, in single-phase and multi-phase fluid flow, indirectly pointing at the importance of sub-resolution unresolved micro-pore phase in carbonates and some sandstone samples. The impact of scanned voxel resolution was observed in changes of the estimated macro-porosity and single-phase permeability (LB and PN) for certain sandstone and carbonate samples, mainly due to the increase in partial volume effects from finer to coarser resolution. Resolution issues lead to partial volume effects, whereby pores and throats of a
ACCEPTED MANUSCRIPT
size below the scanned resolution starts to blur or even disappear, causing them to be assigned to an intermediate phase or grain phase. The resolution problem impacted considerably on the prediction of pore network properties (number of pores/throats, average pore/throat radius and coordination number) of the studied rock samples over the progression from finer to coarser scanned resolution. A numerical coarsening algorithm was then applied to a single high resolution 3D binarized dataset for each sample to reduce the image resolution in a way which effectively avoids the problem of partial volume effects. This leads to the prediction of petrophysical properties consistently over the range of resolutions used. The pore network properties predicted for the samples when numerically coarsened was greatly improved when compared those predicted at different scanned resolutions. This demonstrated that the average pore/throat sizes – the essence for single and multi-phase fluid flow were well preserved. The numerical coarsening scheme turns out to be a powerful tool in improving the computational efficiency of digital rock modelling techniques, allowing (for some rocks) a vast reduction in computing time for a given physical sample size or a larger sample size to be used given fixed computing resources.
Acknowledgement
This work was carried out as part of the activities of the Qatar Carbonates & Carbon Storage Research Centre (QCCSRC) at Imperial College London. We gratefully acknowledge the funding of QCCSRC provided jointly by Qatar Petroleum, Shell, and the Qatar Science and Technology Park, and their permission to publish this research. S.Shah is grateful to BG Group for funding his PhD project through Imperial College Centre for CCS. Oussama Gharbi (Total) and Nayef Al-Ansi (Department of Earth Science and Engineering, Imperial College London) are gratefully acknowledged for helpful discussion. We would like to thank unknown reviewers for their insightful comments on the paper, as these comments led us to an improvement of the work.
References
Al-Ansi, N.M., Gharbi, O., Qaseminejad Raeini, A., Yang, J., Iglauer, S., Blunt, M.J. 2013. Influence of Micro-Computed Tomography Image Resolution on Petrophysical Properties. Paper presented at 6th International Petroleum Technology Conference, Beijing, China. 26th-28th March. http://dx.doi.org/10.2523/16600-MS
Arns, C., Knackstedt, M., Pinczewski, W., Martys, M., 2004. Virtual permeametry on microtomographic images. Journal of Petroleum Science and Engineering. 45 (1-2), 41-46.
ACCEPTED MANUSCRIPT
Andrew, M., Bijeljic, B. Blunt, M.J., 2013. Pore-scale imaging of geological carbon dioxide storage under in situ conditions. Geophys. Res. 40 (15), 3915-3918.
Andrew, M., Bijeljic, B. Blunt, M.J., 2014. Pore-scale imaging of trapped supercritical carbon dioxide in sandstones and carbonates. Int. J. Greenh. Gas Control, 22 (2014), pp. 1–14
Bera, B., Mitra, S.K., Vick, D., 2011. Understanding the micro structure of Berea Sandstone by the simultaneous use of micro-computed tomography (micro-CT) and focused ion beam-scanning electron microscopy (FIB-SEM). Micron. 42, 412–418.
Blunt, M.J., Jackson, M., Piri, M., Valvatne, P.H., 2002. Detailed physics, predictive capabilities and macroscopic consequences for pore network models of multiphase flow. Adv.Water Resour. 25(8), 1069-1089.
Blunt, M.J., Branko, B., Dong, H., Gharbi, O., Iglauer, S., Mostaghimi, P., Paluszny, A., Petland, C. 2013. Pore-scale imaging and modelling. Adv.Water Resour. 51,197-216.
Boek, E.S. and Venturoli, M., 2010. Lattice-Boltzmann studies of fluid flow in porous media with realistic rock geometries. ComputMath Appl. 59, 2304-2314.
Buades, A., Coll, B. & Morel, J.M. 2005. A non-local algorithm for image denoising. Proc. Int. Conf. Computer Vision and Pattern Recognition (CVPR), 2, 60-65.
Chen,S., Wang, Z., Shan, X., Doolen, G.D., 1992. Lattice Boltzmann computational fluid dynamics in three dimensions. Journal of Statistical Physics. 68 (3-4), 379-400.
Crawshaw, J. and Boek, E.S., 2013. Multi-scale Imaging and Simulation of Structure, Flow and Reactive Transport for CO2 Storage and EOR in Carbonate Reservoirs, Reviews in Mineralogy & Geochemistry. 77 (1), 431-458.
Dong, H and Blunt, M.J., 2009. Pore-network extraction from micro-computerized tomography images. Physical Review E. 80:036307.
Jerauld, G. R., and Salter, S.J. 1990. The effect of pore-structure on hysteresis in relative permeability and capillary pressure: Pore-level modeling, Transport in Porous Media. 5, 103–151.
Jones, A.C., Arns, C.H., Hutmacher, D,W., Milthorpe, B.K., Sheppard, A.P., Knackstedt, M.A., 2009. The correlation of pore morphology, interconnectivity and physical properties of
3D ceramic scaffolds with bone ingrowth. Biomaterials, 30 (7), 1440 – 1451.
Kestin, J., Khalifa, H. E., & Correia, R. J. 1981. Tables of the dynamic and kinematic viscosity of aqueous NaCl solutions in the temperature range 20–150 C and the pressure range 0.1–35 MPa. Journal of physical and chemical reference data, 10(1), 71-88.
Knackstedt, M.A., Sheppard, A.P., Sahimi, M., 2001. Pore network modelling of two-phase flow in porous rock: the effect of correlated heterogeneity.Advances in Water Resources. 24 (3), 257-277.
Knackstedt, M.A., Arns, C., Ghous, A., Sakellariou, A., Senden, T., Sheppard, A., Sok, R., Averdunk, H., Val Pinczewski, W., Padhy, G.S., Ioannidis, M.A.: 3D Imaging and flow
ACCEPTED MANUSCRIPT
characterization of the pore space of carbonate rock samples, International Symposium of the society of Core Analysts., SCA2006-23, Norway (2006)
Latham, S., Varslot, T. & Sheppard, A. P. 2008. Image Registration: Enhancing and Calibrating X-ray Micro-CT Imaging. Society of Core Analysts 35, 1 – 12.
Lee, A. L., & Ellington, R. T. 1965. Viscosity of n-Decane in the Liquid Phase. Journal of Chemical and Engineering Data, 10(4), 346-348.
Lindquist, W.B. and Venkatarangan, A., 1999. Investigating 3D geometry of porous media from high resolution images. Phys. Chem. Earth, Part A Solid Earth Geod. 24 (7), 593– 599 Gharbi, O., and Blunt, M.J., 2012. The impact of wettability and connectivity on relative permeability in carbonates: A pore network modeling analysis. Water Resources Research, 48(12).
Ngwenya, B.T., Elphick, S.C., and Shimmield, G.B. 1995. Reservoir Sensitivity to waterflooding: An Experimental Study of Seawater Injection in a North Sea reservoir Analog. AAPG Bulletin. 79 (2), 285-303.
Peng, S., Hu, Q., Dultz, S., Zhang, M. 2012. Using X-ray computed tomography in pore structure characterization for Berea sandstone: Resolution effect. Journal of Hydrology. 472-473, 254-261.
Peng, S., Marone, F., Dultz, S. 2014. Resolution effect in X-ray microcomputed tomography imaging and small pore’s contribution to permeability for a Berea sandstone. Journal of Hydrology. 510, 403-411.
Pentland, C. H.,Tanino, Y., Iglauer, S., and Blunt, M.J., (2010), Residual Saturation of Water-Wet Sandstones: Experiments, Correlations and Pore-Scale Modeling, SPE 133798, proceedings of the SPE Annual Technical Conference and Exhibition, 19-22 September, Florence, Italy.
Ramstad, T., Idowu, N., Nardi, C., Øren, P.E., 2012. Relative permeability calculations from two-phase flow simulations directly on digital images of porous rocks. Transport Porous Medium. 94(2), 487–504.
Schlüter, S., Sheppard, A., Brown, K., & Wildenschild, D. (2014). Image processing of multiphase images obtained via X‐ray microtomography: A review. Water Resources Research, 50(4), 3615-3639.
Sheppard, A., Sok, R., Averdunk, H., 2004. Techniques for image enhancement and segmentation of tomographic images of porous materials, Physica A, 339(1), 145–151.
Shah, S.M., Yang, J., Crawshaw, J.P., Gharbi, O., Boek, E.S. 2013. Predicting porosity and permeability of carbonate rocks from core-scale to pore-scale using Medical CT, Confocal Laser Scanning Microscopy and Micro CT. Paper SPE 166252 SPE Annual Technical Conference and Exhibition, New Orleans, Louisiana, USA, 30th September – 2nd October 2013.
ACCEPTED MANUSCRIPT
Silin, D. & Patzek, T. (2006) Pore space morphology analysis using maximal inscribed spheres. Physica A, 371, 336–360.
Spanne, P., Thovert, J.F., Jacquin, C.J., Lindquist, W.B., Jones, K.W., Adler, P.M., 1994. Synchroton Computed Microtomography of Porous Media: Topology and Transports. Phys. Rev. Lett. 73
Tanino, Y and Blunt, M.J. 2012. Capillary trapping in sandstones and carbonates: Dependence on pore structure. Water Resources Research. 48 (8), W08525.
Taud, H., Martinez-Angeles, R., Parrot, J.F., Hernandez-Escobedo, L., 2005. Porosity estimation method by X-ray computed tomography. Journal of Petroleum Science and Engineering. 47(3), 209-217.
Valvatne, P.H. and Blunt, M.J., 2004. Predicitve pore-scale modelling of two-phase flow in mixed water-wet media. Water Resources Research, 40:W07406.
Vincent, L and Soille, P. 1991. Watersheds in Digital Spaces: An Efficient Algorithm Based on \immersion Simulations. IEEE Transactions on Pattern Analysis and Machine Intelligence. 13(6), 583-598.
Yang, J. and Boek, E.S., 2013. A comparison study of multi-component Lattice Boltzmann models for flow in porous media applications. Comput Math Appl.65 (6), 882-890.
Yang, J., Crawshaw, J.P., Boek, E.S., 2013. Quantitative determination of molecular propagator distributions for solute transport in homogeneous and heterogeneous porous media using lattice Boltzmann simulations. Water Resources Research, 49 (12), 8531-8538 Yuan, H. H. (1981), The influence of pore coordination on petrophysical parameters, in Proc., SPE Annual Technical Conference and Exhibition, 4–7 Oct., SPE 10074, Soc. of Pet. Eng., San Antonio, Tex.
Zeppieri, S., Rodríguez, J., & López de Ramos, A. L. (2001). Interfacial tension of alkane+ water systems. Journal of Chemical & Engineering Data, 46(5), 1086-1088.
Zhang, D., Zhang, R., Chen, S., Soll, W., 2000. Pore-scale study of flow in porous media: Scale dependency, REV, and statistical REV. Geophysical Research Letters. 27 (8), 1195-1198.