RESEARCH PAPER
Mapping of quantitative trait loci associated with chilling
tolerance in maize (
Zea mays
L.) seedlings grown under
field conditions
Choosak Jompuk, Yvan Fracheboud, Peter Stamp and Jo¨rg Leipner*
Institute of Plant Sciences, Swiss Federal Institute of Technology Zurich, Universita¨tstrasse 2, CH-8092 Zu¨rich, Switzerland
Received 16 September 2004; Accepted 16 December 2004
Abstract
The effect of low growth temperature on morpho-physiological traits of maize was investigated by the means of a QTL analysis in a segregating F2:3 popula-tion grown under field condipopula-tions in Switzerland. Chlo-rophyll fluorescence parameters, leaf greenness, leaf area, shoot dry weight, and shoot nitrogen content were investigated at the seedling stage for two years. Maize was sown on two dates in each year; thus, plants sown early were exposed to low temperature, whereas those sown later developed under more favourable conditions. The main QTLs involved in the functioning of the photosynthetic apparatus at low temperature were stable across the cold environments and were also identified under controlled conditions with sub-optimal temperature in a previous study. Based on the QTL analysis, relationships between chlorophyll fluo-rescence parameters and leaf greenness were moder-ate. This indicates that the extent and functioning of the photosynthetic machinery may be under different genetic control. The functioning of the photosynthetic apparatus in plants developed at low temperature in the field did not noticeably affect biomass accumula-tion; since there were no co-locations between QTLs for leaf area and shoot dry weight, biomass accumu-lation did not seem to be carbon-limited at the seedling stage under cool conditions in the field.
Key words: Chilling tolerance, chlorophyll fluorescence, field environment, maize, photosynthesis, QTL, seedling vigour.
Introduction
During the latter part of the last century, the cultivation of maize (Zea mays L.), which originated in the subtropics, has been extended to higher latitudes. Adaptation to growth conditions, as in northern Europe, has been partially successful due to breeding for early maturing maize plants and, therefore, reaching a compromise between the risk of yield loss and an acceptable level of yield (Stamp, 1986). Nevertheless, the chilling-sensitive nature of maize makes early plant establishment in spring difficult under cool environmental conditions.
Among the various effects of low temperature on the physiology of maize, that on the photosynthetic apparatus is considered to be especially important (Bakeret al., 1994). In particular, the combination of high light intensity and low temperature, as occurs frequently during the early growing season in temperate regions, can cause photo-inhibition of photosynthesis (Farage and Long, 1987). Leaves of maize, which develop under such conditions, are characterized by a lower photosynthetic capacity, lower quantum efficiency of CO2-fixation (/CO2), and lower
quantum efficiency of electron transfer at PSII (/PSII) than
leaves which develop under more favourable conditions (Nieet al., 1992; Fryeret al., 1998; Leipneret al., 1999). One reason for the lower photosynthetic performance might be the perturbation of chloroplast development, specifi-cally, the limited ability of maize leaves to develop a functional photosynthetic apparatus at low temperature (Nie and Baker, 1991). Besides this, the susceptibility of the enzymes involved in the C4-cycle, especially that of
pyruvate orthophosphate dikinase, are discussed as being the cause of the chilling sensitivity of the photosynthetic machinery of C4-plants, and in particular of maize (for
* To whom correspondence should be addressed. Fax:+41 1 632 1143. E-mail: joerg.leipner@ipw.agrl.ethz.ch
ªThe Author [2005]. Published by Oxford University Press [on behalf of the Society for Experimental Biology]. All rights reserved. For Permissions, please e-mail: journals.permissions@oupjournals.org
a review see Long, 1983). Moreover, ribulosebisphosphate carboxylase (Rubisco) activity is known to be reduced in maize seedlings at low temperature (Kingston-Smithet al., 1997). Its activity has been found to be the limiting factor for photosynthesis at suboptimal temperature in another C4
-plant,Muhlenbergia glomerata(Kubien and Sage, 2004). Recently, the necessary intercellular partitioning of the antioxidative defences between the mesophyll and bundle sheath and probably also a potential disruption of the circadian regulation of certain photosynthetic enzymes are claimed to cause the chilling sensitivity of maize (Foyer et al., 2002). Furthermore, the transport rate of assimilates between the mesophyll and the bundle sheath, as well as phloem loading, are considered to be affected by low temperature (Sowinskiet al., 1998, 2003). Whatever is the primary cause of the chilling-induced reduction of photo-synthesis, its effect on seedling growth has only been studied by the comparison of a few genotypes with contrasting chilling tolerance (Verheul, 1992; Verheul et al., 1995), which does not yet allow a final conclusion to be drawn concerning the importance of photosynthesis for growth under low temperature conditions.
For some years, the use of molecular markers have enabled the identification of quantitative trait loci (QTLs) involved in the expression of important agronomic traits (e.g. yield components) (Kraja and Dudley, 2000) or disease resistance (Moon et al., 1999). Although the genetic dissection of drought tolerance in maize has been studied extensively (for a review see Ribaut et al., 2004), less is known about the genetic basis of chilling tolerance: research under controlled conditions has only recently been under-taken in this laboratory (Fracheboudet al., 2002, 2004). Not only is QTL analysis important in breeding programmes, it is also a powerful tool for studying the relationships between complex physiological traits (for a review see Prioulet al., 1997). Although complex processes like biomass accumu-lation are controlled by a large number of genetic factors, only a few of these processes are supposed to be limiting factors. Moreover, the importance of genetic factors for a certain trait might be considerably affected by environ-mental conditions, making the genetic dissection of phys-iological traits by means of QTL analysis a promising approach for stress physiologists.
Studies of chilling stress conducted under controlled conditions, however, often poorly reflect natural environ-mental conditions which are usually characterized by considerable fluctuations in temperature and light intensity. Hence, it is not surprising that growth of maize at an early stage of development under field conditions often shows little correlation with maize grown under controlled con-ditions (Revilla et al., 1998). Therefore, the aim of the present study was to conduct a QTL analysis in order to understand the genetic and physiological mechanism(s) of chilling tolerance of maize seedlings under field conditions. To do this, a segregating population, which was studied
previously under controlled conditions (Fracheboudet al., 2004), was sown on two different dates under temperate climatic conditions in Switzerland. Thus, plants sown early were exposed to chilling conditions, whereas plants sown later developed under conditions more favourable for growth. The QTL analysis of morpho-physiological traits and the identification of potential candidate genes may help to understand the relationship between photosynthesis and growth in different environments as well as the genetic background of chilling tolerance in maize.
Materials and methods
Plant material
Maize (Zea mays L.) lines with contrasting chilling-tolerance of photosynthesis were obtained by divergent selection from a Swiss dent maize breeding population using chlorophyll fluorescence as the selection tool (Fracheboud et al., 1999). Two lines in the S5 generation, namely ETH-DH7 (chilling-tolerant) and ETH-DL3 (chilling-sensitive) were used as parents to produce a segregating F2 population. From 254 F2 plants a genetic linkage map was constructed using simple sequence repeat markers (Fracheboudet al., 2004). The F2plants were grown in the field and selfed, yielding 226 successful F3families. Of each F3family, 20 plants were grown in the field and intercrossed within families to produce the F2:3population used in the present QTL experiments.
Field experiments
In 2002, the F2:3families were sown on two dates: 26 April (early sowing) and 24 May (late sowing). In 2003, sowing was done on 14 April (early) and 15 May (late). The experimental unit was a single-row plot with 50 plants, 5 m long, and 0.75 m between the single-rows. All the experiments were over-planted by machine and later thinned to the final plant number. Trials of 226 F2:3lines and the two parental lines were conducted using an alpha (0,1) lattice design with 23 blocks per replication (Patterson and Williams, 1976) and two replications for each sowing date. Each replication was bordered by two rows of a mixture of the F2:3families. In each experimental unit, the first two plants were considered to be border plants and were not used for measurement. Field experiments were conducted at the experimental station of the Institute of Plant Sciences of the ETH in Eschikon near Zurich (478269 N, 88409E, 550 m above sea level). The soil was an Eutric Cambisol (FAO classification) with a clay loam (CL) texture and a low content of organic matter (3%) (Richner
et al., 1996). Air temperature (thermistor YSI 400, Yellow Spring Instruments, Yellow Spring, OH, USA) and global radiation (BF2, Delta-T Devices, Cambridge, UK) were recorded at 15 min intervals, 2 m above the soil surface close to the experimental site.
Photosynthesis and chlorophyll fluorescence
To obtain light response curves from the parental lines, carbon exchange and chlorophyll a fluorescence were monitored with a portable photosynthesis system (6400) equipped with a LI-6400–40 pulse-amplitude modulation fluorometer (Li-Cor, Lincoln, NE, USA). Light response curves were conducted at plants from the late sown set at the second leaf of seedlings in the 2nd leaf stage (11–12 June 2002) as well as during flowering at the second leaf above the ear (2–3 August 2002). The operating quantum yield of photosystem II photochemistry (/PSII) was calculated according to Genty et al. (1989). Other chlorophyll a fluorescence parameters were calculated using the ‘lake’ model according to Krameret al.
qL=ððFm9 F9ÞF 9 oÞ=ððF 9 mF 9 oÞF 9Þ
, the quantum efficiency ofopen
PSII reaction centres as/qL=ððF9mF 9 oÞF 9Þ=ðF9 m3F 9 oÞ, the quan-tum efficiency of dissipation by down-regulation as /NPQ= 1
/PSII1=ðFm=F9m+qLðFm=Fo1ÞÞ, and the quantum efficiency of other non-photochemical losses (non-light-induced, basal or dark, quenching processes) as/NO=1/PSII/NPQ. The maximum fluo-rescence in the dark-adapted (Fm) and in the light-adapted (Fm9) state was determined by applying a 0.8 s saturating flash (;8300lmol m2s1). To determineF9
o, a 3 s far red pulse was applied after the saturation pulse. For nomenclature of the fluorescence states see Rosenqvist and van Kooten (2003).
For QTL analysis in 2002, the operating quantum efficiency of PSII photochemistry (/PSII) of the F2:3population were recorded with the LI-6400. The light intensity was set at 400lmol m2s1; the temperature of the sample chamber was 188C for plants sown early and 30 8C for plants sown late. These temperatures reflected the temperature in the field at the time of the measurements. Humidity and CO2concentration were the same as the ambient conditions. The chlorophyllafluorescence was measured in the middle section of the third leaf after about 2 min adaptation to chamber conditions.
In 2003, the chlorophyllafluorescence was recorded with a pulse-amplitude modulation fluorometer (PAM-2000, Walz, Effeltrich, Germany). The operating quantum efficiency of PSII photochemistry (/PSII) was measured from leaf discs; the discs had been punched from the middle of the third leaf and incubated, while floating on water, in a growth chamber for at least 30 min. The temperature of the growth chamber was 188C (early sowing date) and 258C (late sowing date). The light intensity was 400lmol m2s1. The/PSIIof six leaf discs of each experimental unit was measured. Furthermore, the maximum quantum efficiency of PSII primary photochemistry (Fv/Fm) of the third leaf was determinedin vivoon the F2:3population in the field.Fv/Fmwas measured by applying a 1 s saturation flash (>8000lmol m2s1). TheFv/Fmmeasurements were conducted during the night from about 1 h after sunset until about 1 h before sunrise. In the plants sown early,Fv/Fm was measured from the evening of 16 May 2003 until the early morning of 18 May 2003. Measurements of the late-sown set were done from 6 June 2003 (evening) until 9 June 2003 (early morning). TheFv/Fmof 10 plants was determined for each experimental unit.
Morpho-physiological traits
The greenness of the third leaf was determined with a portable SPAD-502 chlorophyll meter (Minolta, Osaka, Japan). The measurements were performed on three parts of the middle section of the third leaf of six randomly selected plants per experimental unit.
The area of the third leaf was measured with a portable area meter, LI-3000A, (Li-Cor, Lincoln, NE, USA) equipped with a LI-3050A transparent conveyer belt. For each experimental unit, the leaf area of 10 plants was measured.
To determine shoot dry weight, 10 plants per experimental unit were dug out and cut at the coleoptilar node. The samples were washed and dried in an oven at 658C for at least 72 h. All the dried shoots of each line were pooled and ground prior to the determination of the nitrogen and carbon contents, which was performed with a Leco CHN-1000 elemental analyser (LECO, St Joseph, MI, USA). In 2002, the morpho-physiological traits (leaf greenness, /PSII) were measured at the seedling stage on 29 and 30 May (early-sown plot) and 20 and 21 June (late-sown plot). In 2003, the measurements (leaf greenness, leaf area, shoot dry weight, and/PSII) were done from 19 to 21 May (early-sown plot), and between 16 and 18 June (late-sown plot).
Quantitative trait loci analysis
Means of the phenotypic traits of the F2:3were checked for normality of distribution as described by Shapiro and Wilk (1995) using the
SAS PROC UNIVARIATE (SAS 8.2, SAS Institute, 1999–2001, Cary, NC, USA). The adjusted mean for QTL analysis was calculated by the Alpha lattice program (Alpha, CIMMYT, Mexico). All the QTL analyses for the individual environments were performed using QTL Cartographer version 1.17b (Bastenet al., 1994). The method of composite interval mapping (CIM), model 6 of the Zmapqtl program module, was deployed for mapping the QTLs and estimating their effects (Basten et al., 2002). The genome was scanned at 2 cM intervals and the window size was set at 30 cM. Cofactors were chosen using the forward–backward method of step-wise regression atp(Fin)=p(Fout)=0.05. A joint analysis of the phenotypic data for early and late sowing in both years, respectively, made it possible to evaluate the QTL-by-environment (Q3E) interaction (Jiang and Zeng, 1995). The presence of a QTL was declared significant when the likelihood of odds (LOD) value was higher than 3.50 for a single-trait analysis and higher than 4.43 for a joint analysis. These values correspond to a Type-I error rate (alevel) of 0.021, assuming that all the chromosome arms segregate independently. An LOD threshold of 1.3 for a significant Q3E interaction was based on the Type-I error rate of a single locus for an F2with two degrees of freedom. Additive effects of the detected QTLs were also estimated by the Zmapqtl procedure of QTL Cartographer using hypothesis 31 (Bastenet al., 2002). TheR2value (coefficient of determination) from this analysis indicated the percentage of phenotypic variance explained by marker genotypes at the locus.
Results
Environmental conditions
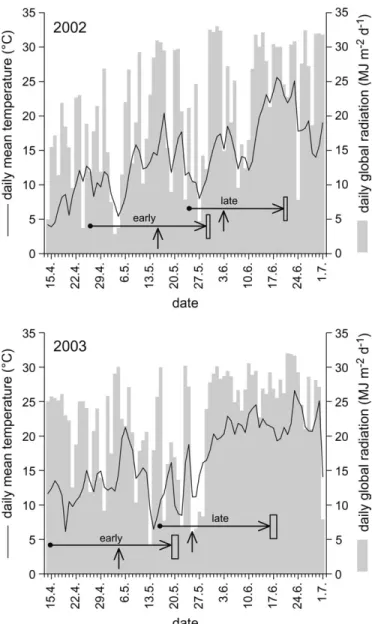
Figure 1 shows the daily mean temperature and daily global radiation throughout the experiments. In 2002, the average temperatures of 14 d before the harvest of the seedlings were 13.38C (early sowing) and 19.08C (late sowing). In 2003, the average temperatures were 13.98C (early sowing) and 22.08C (late sowing). Global radiation fluctuated through-out the seedling development, especially in the early-sown sets. The average global radiation of 14 d before the harvest of the seedlings were 18.6/18.4 MJ m2d1(2002/2003) for the early sowing and 24.2/27.3 MJ m2s1(2002/2003) for the late sowing.
Characterization of the parental lines
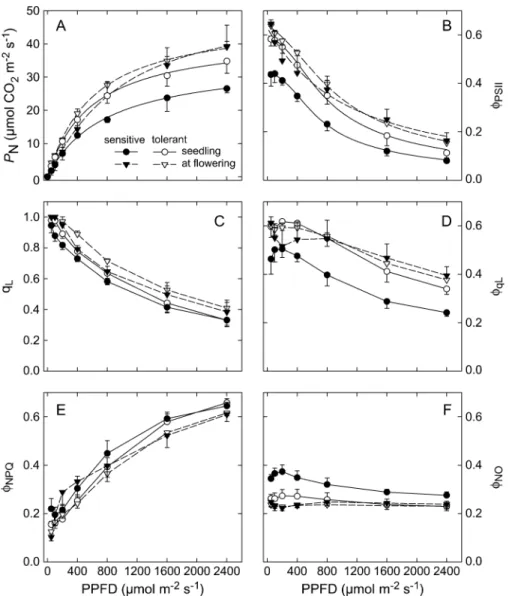
In the first year of the experiment (2002), the photosynthetic apparatus of the parental lines was studied by light response curves. The light response of photosynthesis showed that the photosynthetic capacity and efficiency of the chilling-sensitive genotype, ETH-DL3, were lower than those of the chilling-tolerant genotype, ETH-DH7, in young seedlings, which developed at low temperature (Fig. 2). Prior to measurement of the light response curves at the 2nd leaf stage, the average temperature of the 7 d before the measurements was 13.98C. The lower operating quantum efficiency of PSII (/PSII) in the sensitive compared with the
tolerant genotype was mainly due to the lower quantum efficiency ofopenPSII reaction centres (/qL) and, to a lesser
extent, to a decrease in the fraction ofopenPSII reaction centres (qL). The difference in the efficiency ofopenPSII
reaction centres seemed to be caused for the most part by non-light-induced quenching processes, as indicated by the higher value for /NOin the sensitive line, while the light
response of the quantum efficiency for dissipation by down-regulation (/NPQ) revealed only a few differences between
the two genotypes. The comparison with leaves developed at favourable temperature (2nd leaf above the ear during flowering) showed that differences between the two geno-types disappeared under optimal temperature conditions. Moreover, seedlings of the chilling-tolerant genotype, ETH-DH7, were characterized by a higher maximum quantum efficiency of PSII primary photochemistry (Fv/
Fm) and a higher chlorophyll content; the latter was
estimated from measurements of the leaf greenness
(SPAD), especially of the early-sown sets (Table 1). The shoot dry weight and area of the third leaf was higher for the tolerant than for the sensitive genotype when plants were sown early. The opposite was observed when plants were sown late (Table 1).
Quantitative trait loci analysis
In the first experimental year, traits which characterize the photosynthetic apparatus and which can be measured in relatively short time, namely SPAD and /PSII, were
de-termined in the segregating population. Interim conclu-sions, which were drawn after the first year and according to the results obtained under controlled conditions (Frache-boudet al., 2004), revealed additional traits of great interest for examination in the second experimental year.
In the F2:3 population, the lines were significantly
different for all the parameters at the early and late planting dates, with the exception of /PSII and Fv/Fm of the late
planting date andFmof both planting dates (Table 1). For
the traits evaluated in both years, namely/PSIIand SPAD,
the combined data over environments was analysed to obtain the heritability. The heritability of /PSII was rather low
(h2=0.25) indicating that this trait was strongly affected by environment. For leaf greenness, a heritability of h2=0.71 was determined.
For leaf greenness (SPAD) measured on the third leaf, six QTLs were detected from the seedlings sown early (Table 2). These QTLs were located on chromosomes 1 (181 cM), 2 (125 cM), 3 (102 cM), 4 (20 and 138 cM), and 10 (78 cM). An increase in leaf greenness was due to the alleles of the chilling-tolerant parent at most of these loci, except for the QTL at chromosome 3 and that at the beginning of chromosome 4. At the latter two loci, the greener leaves were due to the allelic contribution of the chilling-sensitive parent, ETH-DL3. The QTL for leaf greenness on chromosome 2 was not present in plants sown late. The joint analysis revealed that this QTL was stable across cold environments, indicated by the low Q3E interaction for the early sowing dates (Table 2). In plants sown late, four QTLs for leaf greenness were revealed. Three were also found in the plants sown early. Only the QTL at chromosome 9 (28 cM) was specific for the late-sown plants.
QTLs for/PSIIwere found mostly in plants sown early
(Table 2). The most prominent QTL for/PSIIwas located
on chromosome 6 at 225 cM; it was found in both years and explained 7.6% of the phenotypic variance of/PSIIin 2002
and 20.4% in 2003. The increase in this trait was due to the allelic contribution of the chilling-tolerant parent. There were further QTLs for /PSIIon chromosomes 2, 4, 8, and
9 detected in the early sown sets (Table 2). One of these QTLs, namely the one at chromosome 8, was also found in the late-sown set. In both sets it had a very low Q3E interaction indicating a high stability. The QTL at chromo-some 9 seemed to be specific to the early-sown plants in Fig. 1. Daily mean temperature and daily global radiation during the
growing season in 2002 and 2003. The two sets of each year are marked by horizontal arrows. The dates of emergence are indicated by vertical arrows.
2002; here, it explained a large percentage of the pheno-typic variance and was characterized by a high additivity.
Measurements of the maximum quantum efficiency of PSII primary photochemistry (Fv/Fm) were conducted in
2003. Two QTLs forFv/Fmwere common in both the
early-and the late-sown sets; they were located on chromosome 2 (138 cM) and chromosome 6 (225, 219 cM) (Table 3). These two QTLs explained a high proportion of the phenotypic variance in the early and late-sown sets. However, their additivity was high only in the early-sown plants, while it was rather low in the late-sown set. Two additional QTLs were found for the plants of the early sowing date; they were located at the beginning of chromosomes 1 and 4. The additivity of these QTLs was negative, showing that the chilling-sensitive genotype carried the favourable allele for
this trait. A decrease inFv/Fmcan be caused by an increase
inFoor a decrease inFm. The QTL analysis revealed that the
major QTL forFv/Fmon chromosome 6 was also found for
Fo but not for Fm. Since the additivity at this locus was
positive forFv/Fmand negative forFo, the decrease inFv/Fm
seems to be due to an increase inFo. By contrast, the QTL for
Fv/Fmat chromosome 4 was found also forFm, but not for
Fo. Since the additivity was negative forFv/Fmas well as for
Fm, the decrease inFv/Fmseemed to be caused by a decrease
inFmat this locus.
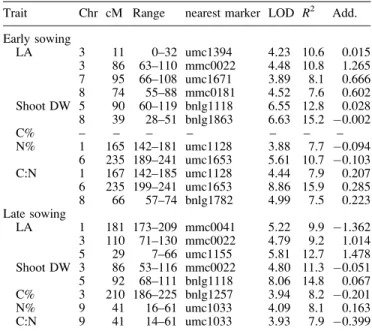
The QTL analysis revealed four QTLs for the area of the third leaf of the early-sown F2:3families and three QTLs for
the late-sown set (Table 4). One QTL on chromosome 3 at about 100 cM seems to be common for early- and late-sown plants, although the peaks were 24 cM apart. Furthermore, Fig. 2.Light response curves of photosynthesis (A), operating quantum efficiency of PSII (B), fraction of PSII centres inopenstates (C), quantum efficiency ofopenreaction centres (D), quantum efficiency for dissipation by downregulation (E), and quantum efficiency of other non-photochemical losses (F) in the chilling-tolerant (white symbols) and chilling-sensitive line (black symbols) at seedling stage (circles; 11–12 June 2002) and during flowering (triangles; 2–3 August 2002). Measurements were conducted at 208C at the second leaf of seedlings and at 258C at the second leaf above the ear during flowering. Values are means6SD of four replications. The light response curves of photosynthesis and/PSIIwere fitted according to the
a second QTL at chromosome 3 (11 cM), one at chromo-some 7 (95 cM), and one at chromochromo-some 8 (74 cM) were found in the early-sown set. In the late-sown plants, a strong QTL was detected at chromosome 5 (29 cM). All the QTLs
for leaf area were due to the allelic contribution of the chilling-tolerant parent, with the exception of the QTL at chromosome 1 (181 cM) identified in the late-grown set.
For shoot dry weight of the seedlings sown early, two QTLs were found on chromosome 5 (90 cM) and 8 (39 cM). The increase in shoot dry weight was due to the allelic contributions of the tolerant and the chilling-sensitive parent, respectively (Table 4). The QTL on chromosome 5 was also found in the late-sown set. In plants sown late, a second QTL was detected on chromo-some 3 at 86 cM with negative additivity.
The QTL analysis of traits obtained from the element analysis showed that C:N ratio was mostly influenced by the nitrogen content (Table 4); in early-sown plants the two QTLs at chromosomes 1 and 6 and in the late-sown plants the QTL at chromosome 9 were common for nitrogen content and C:N ratio. While in the early-sown plants a high C:N ratio and, respectively, a low nitrogen content, was inherited by the chilling-tolerant parent, the situation for the QTL was the opposite for the late-sown set.
Discussion
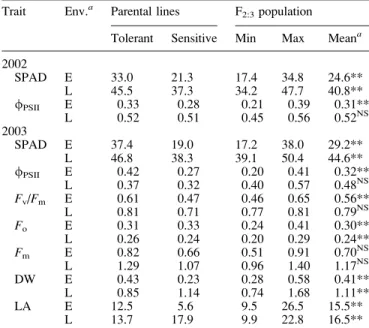
The photosynthetic performance, but also the shoot bio-mass accumulation, of the two parental lines differed considerably when the plants were exposed to low temper-ature early in the growing season. This difference disap-peared when the plants developed under favourable temperature conditions. The photosynthetic apparatus of seedlings grown under cold conditions in the field showed the typical symptoms of growth at suboptimal temperature, Table 1. Means of leaf greenness (SPAD), operating quantum
yield of photosystem II (/PSII), maximum quantum efficiency of PSII primary photochemistry (Fv/Fm), minimum fluorescence (Fo), maximum fluorescence (Fm), shoot dry weight (DW; g plant1), and area of the third leaf (LA; cm2) of the parental lines (tolerant=ETH-DH7; sensitive=ETH-DL3) and the 226 F2:3families from their cross
Trait Env.a Parental lines F2:3population
Tolerant Sensitive Min Max Meana
2002 SPAD E 33.0 21.3 17.4 34.8 24.6** L 45.5 37.3 34.2 47.7 40.8** /PSII E 0.33 0.28 0.21 0.39 0.31** L 0.52 0.51 0.45 0.56 0.52NS 2003 SPAD E 37.4 19.0 17.2 38.0 29.2** L 46.8 38.3 39.1 50.4 44.6** /PSII E 0.42 0.27 0.20 0.41 0.32** L 0.37 0.32 0.40 0.57 0.48NS Fv/Fm E 0.61 0.47 0.46 0.65 0.56** L 0.81 0.71 0.77 0.81 0.79NS Fo E 0.31 0.33 0.24 0.41 0.30** L 0.26 0.24 0.20 0.29 0.24** Fm E 0.82 0.66 0.51 0.91 0.70NS L 1.29 1.07 0.96 1.40 1.17NS DW E 0.43 0.23 0.28 0.58 0.41** L 0.85 1.14 0.74 1.68 1.11** LA E 12.5 5.6 9.5 26.5 15.5** L 13.7 17.9 9.9 22.8 16.5**
aNS, not significant; **, significant atP<0.01; Env., environment; E,
early sowing; L, late sowing.
Table 2. Main characteristics of QTLs for leaf greenness (SPAD) and operating quantum efficiency of PSII (/PSII) of maize seedlings sown early or late with an LOD score above a threshold of 4.43 for the joint analysis
Chr, chromosome number; cM, position of the peak of the QTL in centimorgans; Range, range of the QTL above the threshold LOD score; Joint, LOD score in the joint analysis of year 2002 and 2003; Q3E, LOD score value for QTL–environment interaction in the joint analysis of year 2002 and 2003;
R2, percentage of the phenotypic variance explained by genotype class at LOD peak; Add., Additivity (positive additivity = high values of the trait were inherited from the tolerant parent; negative additivity = high values of the trait were inherited from the sensitive parent).
Trait Sowing Chr cM Range Nearest marker LOD score R2 Add.
2002 2003 Joint Q3E 2002 2003 2002 2003 SPAD Early 1 181 149–197 mmc0041 4.18 5.31 8.22 1.65 4.4 4.2 1.00 1.29 2 125 123–138 bnlg121 3.22 3.13 5.07 0.23 6.4 5.0 0.98 1.04 3 102 82–122 mmc0022 6.66 1.33 7.01 2.59 10.6 1.7 1.15 0.80 4 20 10–36 umc1276 0.15 4.90 5.11 2.39 0.0 7.9 0.57 0.93 4 138 134–140 bnlg2291 0.18 4.54 4.78 2.36 0.1 7.0 0.51 0.93 10 78 63–82 bnlg1712 0.77 4.70 4.80 0.91 1.0 4.2 0.66 0.89 Late 1 165 157–189 umc1128 2.47 3.41 5.22 1.02 4.9 6.0 0.86 0.65 3 110 72–134 mmc0022 4.04 8.82 11.29 1.58 7.3 10.3 1.05 1.22 9 28 10–79 bnlg244 0.72 6.60 6.77 1.11 1.4 8.3 0.76 0.94 10 92 39–122 umc1995 3.41 4.65 6.57 0.30 5.0 6.5 0.90 0.80
/PSII Early 2 108 100–110 phi109642 4.06 0.49 4.67 0.78 9.3 0.5 0.011 0.008
4 12 0–40 umc1276 1.07 6.29 6.98 1.98 0.9 8.3 0.009 0.013 6 225 195–241 bnlg1740 5.88 17.98 21.34 5.75 7.6 20.4 0.014 0.021 8 63 61–65 bnlg1782 1.91 3.12 4.59 0.41 3.5 2.3 0.010 0.009 9 188 158–188 umc1277 5.59 2.82 9.24 1.37 24.8 3.6 0.020 0.022 Late 8 66 65–66 bnlg1782 3.63 1.46 4.68 0.06 5.9 2.4 0.004 0.004
namely low photosynthetic capacity and efficiency and low chlorophyll content, as demonstrated in several studies conducted under controlled environment conditions (Nie et al., 1992; Haldimannet al., 1996; Leipner et al., 1997) and in the field (Andrewset al., 1995; Leipneret al., 1999). The regulation of the photosynthetic apparatus with respect to the fraction and the efficiency of open PSII reaction centres seemed to function similarly in both lines. How-ever, seedlings of the chilling-sensitive line exposed to low growth temperature, were characterized by a higher yield for energy losses (/NO), which was not attributed to
down-regulation; it indicated chilling-induced constitutive struc-tural alterations of the photosynthetic apparatus.
The time of sowing and/or the climatic conditions during early seedling development also resulted in differential expression at several QTLs. Most of the identified QTLs derived from seedlings of the early-sown plots. Since the parental lines were selected for high or low operating quantum efficiency of PSII photochemistry (/PSII) at
sub-optimal growth temperature (Fracheboudet al., 1999), this observation indicates that the selection method was effi-cient for the particular growth conditions. Moreover, the fact that the favourable alleles for most of the QTLs were inherited from the chilling-tolerant parent also shows the efficacy of the selection method.
Several genomic regions were found where different traits were under related genetic control. A major QTL for photosynthetic traits was located on chromosome 6 and was identified for the photosynthesis related parameters/PSII,
Fv/Fm, and Fo in early-sown plants. This QTL was also
found forFv/Fmin the late-sown set, but with a considerably
smaller additivity, indicating its greater importance under
cool conditions. A previous study, conducted with the same plant material grown under controlled conditions, revealed a QTL at the same position and for the same traits in plants grown at 158C, but not in plants developed at 258C (Fracheboudet al., 2004). Under controlled low-tempera-ture conditions, there was a pleitropic effect between the photosynthetic traits and the shoot dry weight at this locus, which led to the assumption that photosynthesis limits dry matter accumulation at suboptimal growth temperature. Seemingly, this was not the case in the field. This might be due to the higher light intensity under natural conditions, since a decrease in the maximum photosynthetic efficiency has a relatively stronger effect on photosynthetic activity at low light intensity than it has at high light intensity. Moreover, the probability that growth is source limited is much larger under low light than under high light intensity conditions. Taken together, changes in photosynthetic efficiency will have a smaller effect on growth at higher light intensity, as in the field, than at lower light intensity as is usual under growth chamber conditions. Nevertheless, in early-sown plants in the field, a QTL for the C:N ratio was detected at this locus, indicating the involvement of the quantum efficiency of PSII in the overall carbon assimila-tion. Furthermore, the QTL analysis revealed a weak QTL Table 3. Main characteristics of QTLs with an LOD score>3.5
for photosynthetic maximum quantum efficiency of PSII primary photochemistry (Fv/Fm), minimum fluorescence (Fo), and maxi-mum fluorescence (Fm) of the field experiment in 2003
Chr, chromosome number; cM, position of the peak of the QTL in centimorgans; Range, range of the QTL above the threshold LOD score;
R2, percentage of the phenotypic variance explained by genotype class at
LOD peak; Add., Additivity (positive additivity = high values of the trait were inherited from the tolerant parent; negative additivity = high values of the trait were inherited from the sensitive parent).
Trait Chr cM Range Nearest marker LOD R2 Add. Early sowing Fv/Fm 1 0 0–12 bnlg1112 3.74 4.1 0.007 2 138 98–154 dupssr21 6.79 12.5 0.017 4 4 0–30 phi072 3.68 4.8 0.008 6 225 201–241 bnlg1740 18.22 23.8 0.023 Fo 6 227 195–241 bnlg1740 19.15 30.3 0.023 Fm 4 6 0–38 phi072 4.52 8.2 0.026 8 65 32–86 bnlg1782 4.48 7.2 0.026 Late sowing Fv/Fm 2 138 97–154 dupssr21 4.02 9.7 0.003 6 219 191–241 bnlg1740 15.55 30.4 0.005 Fo 6 205 176–225 bnlg1740 4.87 15.2 0.006 Fm – – – – – – –
Table 4. Main characteristics of QTLs with an LOD score>3.5 for area of the third leaf (LA; cm2), shoot dry weight (g plant1) carbon content (C%, g [C] g1 shoot dry weight), nitrogen content (N%, g [N] g1shoot dry weight), and C:N ratio of the field experiment in 2003;see Table 3 for legends
Chr, chromosome number; cM, position of the peak of the QTL in centimorgans; Range, range of the QTL above the threshold LOD score;
R2, percentage of the phenotypic variance explained by genotype class at LOD peak; Add., Additivity (positive additivity = high values of the trait were inherited from the tolerant parent; negative additivity = high values of the trait were inherited from the sensitive parent).
Trait Chr cM Range nearest marker LOD R2 Add.
Early sowing LA 3 11 0–32 umc1394 4.23 10.6 0.015 3 86 63–110 mmc0022 4.48 10.8 1.265 7 95 66–108 umc1671 3.89 8.1 0.666 8 74 55–88 mmc0181 4.52 7.6 0.602 Shoot DW 5 90 60–119 bnlg1118 6.55 12.8 0.028 8 39 28–51 bnlg1863 6.63 15.2 0.002 C% – – – – – – – N% 1 165 142–181 umc1128 3.88 7.7 0.094 6 235 189–241 umc1653 5.61 10.7 0.103 C:N 1 167 142–185 umc1128 4.44 7.9 0.207 6 235 199–241 umc1653 8.86 15.9 0.285 8 66 57–74 bnlg1782 4.99 7.5 0.223 Late sowing LA 1 181 173–209 mmc0041 5.22 9.9 1.362 3 110 71–130 mmc0022 4.79 9.2 1.014 5 29 7–66 umc1155 5.81 12.7 1.478 Shoot DW 3 86 53–116 mmc0022 4.80 11.3 0.051 5 92 68–111 bnlg1118 8.06 14.8 0.067 C% 3 210 186–225 bnlg1257 3.94 8.2 0.201 N% 9 41 16–61 umc1033 4.09 8.1 0.163 C:N 9 41 14–61 umc1033 3.93 7.9 0.399
for shoot dry weight in the early-sown set at the end of chromosome 6 which was, however, with a LOD score of 1.9 below the threshold (data not shown). Since a QTL for leaf greenness was not detected at this locus, the molecular cause of the lower photosynthetic efficiency may be changes in the functioning of the photosynthetic apparatus or a feedback inhibition of photosynthesis, rather than a smaller amount of photosystems. This reduction in photosynthetic activity, however, seemed only partially to be the limiting factor for dry matter accumulation under field conditions. As discussed previously (Fracheboud et al., 2004), an interesting candidate gene for this QTL might be agp2 coding for the small subunit of leaf ADP glucose pyrophosphorylase (Table 5).
On chromosome 2 close to markerdupssr21, a common QTL was found for leaf greenness in early-sown seedlings and forFv/Fmin early- and late-sown seedlings, the latter,
however, with low additivity. Moreover, QTLs for leaf greenness, carbon exchange rate, and/PSIIwere identified
at this position in this (Fracheboud et al., 2004) and in another population (Fracheboud et al., 2002) grown at suboptimal temperature under controlled conditions. The association between low chlorophyll content and reduction in the quantum efficiency of PSII might reflect a disturbance of the assembly of the photosynthetic apparatus, induced by low growth temperature. Aligning these results with the IBM2 Neighbor’s consensus genetic map (Maize Genetics and Genomics Database, www.maizegdb.org) revealed the presence of an interesting candidate gene at this locus: hcf106 (Table 5). The hcf106 gene codes for the high chlorophyll fluorescence protein 106, which is a component of theDpH-dependent translocation pathway in the thyla-koid membrane (for review see Mori and Cline, 2001). Nuclear mutation of hcf106 results in a pale green, non-photosynthetic seedling, which releases absorbed light energy as chlorophyll fluorescence (Martienssen et al., 1989), similar to plants developed at low temperature and carrying the allele at this locus from the chilling-sensitive line. The genehcf106c, a homologue ofhcf106, is located at chromosome 10, close toumc1995, the nearest marker of another QTL for leaf greenness identified in the present study (Table 5).
For leaf greenness, leaf area, and shoot dry weight a common QTL was located close to the centromere of chromosome 3. Similarly, several common QTLs for shoot dry weight and leaf area were found in maize seedlings grown in the greenhouse (Causseet al., 1995). With respect to the QTL at chromosome 3, however, high shoot dry weight was related to a small leaf area. Since the relative growth rate (RGR) reflects the product of net assimilation rate (NAR) and leaf area ratio (LAR) (Evans, 1972), one would expect that a QTL for carbon assimilation rate would be present at this location, which exhibits the same direction of additivity as for shoot dry weight, thus counteracting the smaller leaf area. Beside the QTL for
leaf greenness, a QTL forFv/Fmwith a LOD score of 2.4,
which was, however, below the threshold, was identified close to the centromere of chromosome 3 in the late-sown seedlings (data not shown). Moreover, a QTL for carbon exchange rate, /PSII, Fv/Fm, and leaf greenness, with the
favourable allele inherited from the chilling-sensitive line (ETH-DL3) as in the present study, was revealed at this position in seedlings grown at optimal temperature in growth cabinets (Fracheboudet al., 2004), supporting the involvement of photosynthesis in this QTL. The complex-ity of this QTL makes an explanation of its mode of action difficult. It is possible that the gene or the genes behind this QTL are involved in the control of cell division and, therefore, affect the biomass accumulation and the photo-synthetic activity by altering the morphology of the leaf. A nearby located potential candidate gene for this mode of action would bemyb2, which codes the cell division control protein 5 (CDC5) (Table 5). Alternatively, changes in photosynthetic performance could be the primary cause, Table 5. Position of potential candidate genes in relation to the QTLs detected in this study and to common SSR markers from this population (ETH-population, ETH-DL33ETH-DH7), from the IBM2 2004 Neighbor’s map and the Pioneer composite 1999 map
Marker/gene/QTLa Position (cM)
ETH-population IBM2 Pioneer Chromosome 2 bnlg1909 121 297 82 hcf106 – 309 80 1QTL SPAD 125 (123–138) – – bnlg121 126 319 89 dupssr21 131 309 85 Chromosome 3 bnlg1019 76 191 43 mmc0022 102 318 – 2QTL SPAD 110 (72–134) – – myb2 – 347 78 sps2 – 358 82 bnlg1063 127 441 47 Chromosome 5 bnlg1346 78 545 150 3QTL shoot DW 90 (60–119) – – bnlg1118 93 590 149 nnr2 – 599 – bnlg1695 123 657 149 Chromosome 6 umc1859 187 391 – bnlg1740 225 511 134 4QTL/ PSII 225 (195–241) – – umc1653 241 535 – agp2 – 536 156 Chromosome 10 bnlg1712 78 218 57 umc1995 84 246 – hcf106c – 246 – 5QTL SPAD 92 (32–122) – – umc1930 104 307 –
aQTL position from1, joint early;2, joint late;3, early 2003,4, joint
which consequently would affect shoot growth and leaf greenness and area. According to the IBM2 Neighbor’s consensus genetic map, a potential candidate gene, which is located near the identified QTL and which may explain the pleiotropic effect at this locus by the latter mode of action is sps2, a gene for sucrose phosphate synthase (SPS) (Table 5). The effect of SPS activity on photosynthesis is well documented for C3-plants overexpressing SPS (for a
re-view see Huber and Huber, 1996). Moreover, an effect of SPS activity on chlorophyll content was observed in SPS transformants ofArabidopsis thalina(Strandet al., 2003). However, its effect on photosynthesis in C4-plants has not
been extensively studied. It may be of less importance since a short-term feedback inhibition of SPS by sucrose seems not to occur in maize leaves (Lunn and Hatch, 1997). If the chlorophyll content is indirectly regulated by the activity of enzymes involved in carbon assimilation, as also found for Rubisco in the C4-plant Flaveria bidentis (Kubien et al.,
2003), then one would expect that all major QTLs for photosynthetic activity are associated with QTLs for leaf greenness. Clearly, this was not the case regarding the QTL at the end of chromosome 6, indicating that changes in photosynthetic activity does not necessarily affect the chlorophyll content.
Only one QTL was identified for shoot dry weight which was stable in all the investigated environments. This QTL was located on chromosome 5 at about 90 cM, and the favourable allele was inherited from the chilling-tolerant parent. It was also detected for shoot dry weight in seedlings sown in the autumn which developed under cold conditions (data not shown). The QTL at chromosome 5 was not related to any other trait; and it was not identified under controlled conditions either for this trait or for any of the other traits (Fracheboudet al., 2004). According to the IBM2 Neighbor’s consensus genetic map, this QTL is located near the nnr2 gene, whose product is NAD(P)H nitrate reductase (Table 5). There is a strong indication that nitrate reductase is important for this QTL as shown by Hirelet al. (2001) for another segregating population. In the latter population, a QTL for nitrate reductase activity and nitrate content was identified in the same region of chromosome 5 when the map was aligned to the IBM2 Neighbor’s consensus map. Since this part of the chromo-some has no influence on the C:N ratio, the gene or the gene cluster behind the QTL at chromosome 5 might influence the shoot dry weight through the availability of nitrogen for growth. On the other hand, if carbon limits growth, then a QTL for photosynthesis or leaf area would be expected at this locus, which was not the case. The hypothesis that the activity of nitrate reductase affects the shoot dry weight is also supported by the high correlation between nitrate reductase activity at the seedling stage and final plant biomass of European maize cultivars (Feilet al., 1993).
Together with previous results obtained under controlled conditions (Fracheboudet al., 2004), it is evident that the
main QTLs involved in the functioning of the photosyn-thetic apparatus at low temperature are stable in cold environments. Furthermore, the QTL analysis indicated that the chilling-induced reduction in photosynthetic activ-ity can be caused by perturbation in the assembling of the photosynthetic apparatus, as well as by reduced enzyme activity down-stream of the photosynthetic light reaction. The former was implied by the co-location of QTLs for photosynthetic efficiency and leaf greenness, the latter was indicated by QTLs which were found only for photosyn-thetic efficiency but not for leaf greenness. The functioning of the photosynthetic apparatus in plants developed at low temperature in the field, however, did not noticeably affect biomass accumulation, in contrast to the findings under controlled conditions. Nitrogen assimilation is probably more important for seedling growth in the field, because a larger leaf area, which may also positively influence growth, did not affect biomass accumulation of the in-vestigated material either.
The comparison of the QTLs with QTLs of similar traits at the seedling stage in two other mapped populations (Fracheboud et al., 2002; Causse et al., 1995) revealed some agreement. Similarities between mapped populations were found when the populations were grown under similar conditions and when traits characterizing the physiology of the photosynthetic apparatus were considered (Fracheboud et al., 2004), indicating that the genetic basis of the chilling-tolerance of photosynthesis is similar in different maize germplasms.
Supplementary data
The genetic map and the location of the QTLs for leaf greenness,/PSII,Fv/Fm, area of the third leaf, and shoot dry
weight are shown on a supplementary figure available at JXB online.
Acknowledgements
This research was supported by grants to CJ from the Center for Agricultural Biotechnology of the Kasetsart University, Thailand. We also thank Karl-Heiz Camp for helpful discussions.
References
Andrews JR, Fryer MJ, Baker NR. 1995. Characterization of chilling effects on photosynthetic performance of maize crops during early season growth using chlorophyll fluorescence. Jour-nal of Experimental Botany46,1195–1203.
Baker NR, Farage PK, Stirling CM, Long SP. 1994. Photo-inhibition of crop photosynthesis in the field at low temperature. In: Baker NR, Bowyer JR, eds. Photoinhibition of photosynthesis: from molecular mechanisms to the field. Oxford: Bios Scientific Publishers, 349–363.
Basten CJ, Weir BS, Zeng ZB.1994. Zmap-a QTL cartographer. In: Smith C, Gavora JS, Chesnais BBJ, Fairfull W, Gibson JP, Kennedy BW, Burnside EB, eds.Proceedings of the 5th world congress on genetics applied to livestock production: computing strategies and software. Guelph, Canada: University of Guelph, 65–66.
Basten CJ, Weir BS, Zeng ZB.2002.QTL cartographer, a reference manual and tutorial for QTL mapping. North Carolina State University, Raleigh: Department of Statistics.
Causse M, Rocher J-P, Henry AM, Charcosset A, Prioul J-L, de Vienne D. 1995. Genetic dissection of the relationship between carbon metabolism and early growth in maize, with emphasis of key-enzyme loci.Molecular Breeding1,259–272.
Evans GC.1972.The quantitative analysis of plant growth. Oxford: Blackwell Scientific Publications.
Farage PK, Long SP.1987. Damage to maize photosynthesis in field during periods when chilling is combined with high photon fluxes. In: Biggens J, ed.Progress in photosynthesis research,Vol. IV. The Netherlands: Martinus Nijhoff Publishers, 139–142.
Feil B, Thiraporn R, Stamp P. 1993. In vitro nitrate reductase activity of laboratory-grown seedlings as an indirect selection criterion for maize.Crop Science33,1280–1286.
Foyer CH, Vanacker H, Gomez LD, Harbinson J.2002. Regu-lation of photosynthesis and antioxidant metabolism in maize leaves at optimal and chilling temperatures: review. Plant Phys-iology and Biochemistry40,659–668.
Fracheboud Y, Haldimann P, Leipner J, Stamp P.1999. Chloro-phyll fluorescence as a selection tool for cold tolerance of photosynthesis in maize (Zea maysL.).Journal of Experimental Botany50,1533–1540.
Fracheboud Y, Ribaut J-M, Vargas M, Messmer R, Stamp P.
2002. Identification of quantitative trait loci for cold-tolerance of photosynthesis in maize (Zea maysL.).Journal of Experimental Botany53,1967–1977.
Fracheboud Y, Jompuk C, Ribaut J-M, Stamp P, Leipner J.
2004. Genetic analysis of cold-tolerance of photosynthesis in maize.Plant Molecular Biology56,241–253.
Fryer MJ, Andrews JR, Oxborough K, Blowers DA, Baker NR.
1998. Relationship between CO2 assimilation, photosynthetic electron transport, and active O2metabolism in leaves of maize in the field during periods of low temperature.Plant Physiology 116,571–580.
Genty B, Briantais J-M, Baker NR. 1989. The relationship between the quantum yield of photosynthetic electron transport and quenching of chlorophyll fluorescence. Biochimica et Bio-physica Acta990,87–92.
Haldimann P, Fracheboud Y, Stamp P. 1996. Photosynthetic performance and resistance to photoinhibition of Zea mays L. leaves grown at sub-optimal temperature.Plant, Cell and Envi-ronment19,85–92.
Hirel B, Bertin P, Quillere´ I, et al. 2001. Towards a better understanding of the genetic and physiological basis for nitrogen use efficiency in maize.Plant Physiology125,1258–1270.
Huber SC, Huber JL. 1996. Role and regulation of sucrose-phosphate synthase in higher plants. Annual Review of Plant Physiology and Plant Molecular Biology47,431–444.
Jiang C, Zeng ZB.1995. Multiple trait analysis of genetic mapping for quantitative trait loci.Genetics140,111–127.
Kingston-Smith AH, Harbinson J, Williams J, Foyer CH.1997. Effect of chilling on carbon assimilation, enzyme activation, and photosynthetic electron transport in the absence of photoinhibition in maize leaves.Plant Physiology114,1039–1046.
Kraja AT, Dudley JW.2000. QTL analysis of two maize inbred line crosses.Maydica45,1–12.
Kramer DM, Johnson G, Kiirats O, Edwards GE.2004. New flu-orescence parameters for the determination of QAredox state and excitation energy fluxes.Photosynthesis Research79,209–218.
Kubien DS, Sage RF.2004. Low-temperature photosynthetic per-formance of a C4grass and a co-occurring C3grass native to high latitudes.Plant, Cell and Environment27,907–916.
Kubien DS, von Caemmerer S, Furbank RT, Sage RF.2003. C4 photoynthesis at low temperature. A study using transgenic plants with reduced amounts of Rubisco. Plant Physiology 132,
1577–1585.
Leipner J, Fracheboud Y, Stamp P. 1997. Acclimation by sub-optimal growth temperature diminishes photooxidative damage in maize leaves.Plant, Cell and Environment20,366–372.
Leipner J, Fracheboud Y, Stamp P.1999. Effect of growing season on the photosynthetic apparatus and leaf antioxidative defenses in two maize genotypes of different chilling tolerance.Environmental and Experimental Botany42,129–139.
Long SP.1983. C4photosynthesis at low temperature.Plant, Cell and Envrionment6,345–363.
Lunn JE, Hatch MD.1997. The role of sucrose-phosphate synthase in the control of photosynthate partitioning inZea maysleaves.
Australian Journal of Plant Physiology24,1–8.
Martienssen RA, Barkan A, Freeling M, Taylor WC. 1989. Molecular-cloning of a maize gene involved in photosynthetic membrane organization that is regulated by robertson mutator.
EMBO Journal8,1633–1639.
Moon HG, Brewbaker JL, Lu XW.1999. Major QTLs for disease resistance and other traits identified in recombinant inbred lines from tropical maize hybrids.Maydica44,301–311.
Mori H, Cline K.2001. Post-translational protein translocation into thylakoids by the Sec andDpH-dependent pathways.Biochimica et Biophysica Acta1541,80–90.
Nie G-Y, Baker NR.1991. Modifications to thylakoid composition during development of maize leaves at low growth temperature.
Plant Physiology95,184–191.
Nie G-Y, Long SP, Baker NR.1992. The effects of development at sub-optimal growth temperature on photosynthetic capacity and susceptibility to chilling-dependent photoinhibition inZea mays.
Physiologia Plantarum85,554–560.
Patterson HD, Williams ER. 1976. New class of resolvable in-complete block designs.Biometrika63,83–92.
Prioul J-L, Quarrie S, Causse M, de Vienne D.1997. Dissecting complex physiological functions through the use of molecular quantitative genetics. Journal of Experimental Botany 48,
1151–1163.
Revilla P, Malvar RA, Cartea ME, Orda´s A. 1998. Identifying open-pollinated populations of field corn as sources of cold tolerance for improving sweet corn.Euphytica101,239–247.
Ribaut J-M, Ba¨nziger M, Setter T, Edmeades G, Hoisington D.
2004. Genetic dissection of drought tolerance in maize: a case study. In: Nguyen H, Blum A, eds.Physiology and biotechnology integration for plant breeding. New York: Marcel Dekker, Inc., 571–609.
Richner W, Soldati A, Stamp P.1996. Shoot to root relations in field-grown maize seedlings.Agronomy Journal88,56–61.
Rosenqvist E, van Kooten O. 2003. Chlorophyll fluorescence: a general description and nomenclature. In: DeEll JR, Toivonen PMA, eds. Pratical applications of chlorophyll fluorescence in plant biology. Dordrecht: Kluwer Academic Publishers, 31–77.
Shapiro SS, Wilk MB. 1965. An analysis of variance test for normality (complete samples).Biometrika52,591–611.
Sowinski P, Richner W, Soldati A, Stamp P. 1998. Assimilate transport in maize (Zea mays L.) seedlings at vertical low temperature gradients in the root zone.Journal of Experimental Botany49,747–752.
Sowinski P, Rudzinska-Langwald A, Kobus P.2003. Changes in plasmodesmata frequency in vascular bundles of maize seedling leaf induced by growth at sub-optimal temperatures in relation to photosynthesis and assimilate export.Environmental and Exper-imental Botany50,183–196.
Stamp P.1986. Chilling stress in maize. In: Dolstra O, Miedema P, eds.Breeding of silage maize. Wageningen: Eucarpia Proceeding, 43–50.
Strand A, Foyer CH, Gustafsson P, Gardestrom P, Hurry V.
2003. Altering flux through the sucrose biosynthesis pathway in transgenicArabidopsis thalianamodifies photosynthetic
acclima-tion at low temperatures and the development of freezing tolerance.
Plant, Cell and Environment26,523–535.
Thornley JHM.1976. Mathematical models in plant physiology. London: Academic Press.
Verheul MJ. 1992. Seedling growth of maize (Zea mays L.) genotypes under chilling conditions. PhD thesis No. 9855, ETH Zu¨rich, Switzerland.
Verheul MJ, van Hassel PR, Stamp P.1995. Comparison of maize inbred lines differing in low temperature tolerance: effect of acclimation at suboptimal temperature on chloroplast functioning.