THE TREE TO SUCCESS: USING DECISION TREE ANALYSIS TO
PREDICT EMPLOYEE PERFORMANCE AND HEALTH
by
Justin M. Raines
December, 2015
Director of Dissertation: Dr. Mark C. Bowler
Major Department: Department of Psychology
The purpose of the current study was to evaluate the relative advantages and disadvantages of a
novel statistical technique within the context of personnel decision-making. Specifically, the use
of decision tree analysis was examined regarding its potential benefits over binary logistic
regression. Using Monte Carlo simulation, a series of data sets were generated based on
meta-analytic correlation matrices representing the topics of (1) employee performance and (2)
employee health. Each data set was analyzed via both decision tree analysis and binary logistic
regression with subsequent comparisons being made concerning model validity, adverse impact,
and interpretability. Overall, decision tree analysis demonstrated a variety of benefits over the
more traditional method. In general, decision tree analysis produced predictive models that
possessed nearly equivalent levels of validity as models produced by logistic regression. Of
greater importance, the majority of decision tree analysis models produced no adverse impact,
whereas logistic regression models were largely associated with discriminatory results. Lastly,
decision tree analysis models were generally more parsimonious and interpretable than the
competing logistic regression models. The practical implications of these results are discussed
and suggest that the use decision tree analysis holds the potential to greatly improve the way in
THE TREE TO SUCCESS: USING DECISION TREE ANALYSIS TO
PREDICT EMPLOYEE PERFORMANCE AND HEALTH
A Dissertation
Presented to the Faculty of the Department of Psychology
East Carolina University
In Partial Fulfillment of the Requirements for the Degree
Doctor of Philosophy in Health Psychology
by
Justin M. Raines
THE TREE TO SUCCESS: USING DECISION TREE ANALYSIS TO
PREDICT EMPLOYEE PERFORMANCE AND HEALTH
by Justin M. Raines APPROVED BY: DIRECTOR OF DISSERTATION: ______________________________________________________________ Mark C. Bowler, PhD COMMITTEE MEMBER: _______________________________________________________ Shahnaz Aziz, PhD COMMITTEE MEMBER: _______________________________________________________ Karl L. Wuensch, PhD COMMITTEE MEMBER: _______________________________________________________ Hamid Fonooni, PhD
CHAIR OF THE DEPARTMENT
OF PSYCHOLOGY: ____________________________________________________________ Susan L. McCammon, PhD
DEAN OF THE
GRADUATE SCHOOL: _________________________________________________________ Paul J. Gemperline, PhD
ACKNOWLEDGEMENTS
The completion of this dissertation would not have been possible without the guidance
and support of my dissertation chair, Dr. Mark Bowler. I am grateful for the knowledge,
encouragement, and autonomy he provided me throughout this process. I would also like to
thank the members of my committee, Dr. Shahnaz Aziz, Dr. Karl Wuensch, and Dr. Hamid
Fonooni, for dedicating their time and expertise. Next, I must express immeasurable gratitude to
my remarkable parents, Mike and Karen, my brother, Matt, and my sister, Andrea. I will be
forever thankful for their unwavering love, support, and patience. I must also thank my amazing
grandmother for her endless support of my ambitions. Finally, none of my achievements would
be possible without the love of my life, Anna, who introduced me to work psychology, and
TABLE OF CONTENTS
LIST OF TABLES ... xi
LIST OF FIGURES ... xii
CHAPTER I: INTRODUCTION ... 1
Personal Decision-Making ... 1
Objectives of Personnel Decision-Making ... 2
Personnel Selection ... 3
Employee Health ... 3
Statistical Techniques for Decision-Making ... 4
Current Study ... 7
Research Questions ... 7
CHAPTER II: LITERATURE REVIEW ... 9
Personal Selection ... 9
Traditional Decision-Making Methods ... 11
Statistical Methods ... 11
Multiple Linear Regression ... 11
Strengths and Weaknesses ... 13
Binary Logistic Regression ... 16
Strengths and Weaknesses ... 18
Selection Techniques ... 18
Cutoff Scores ... 18
Strengths and Weaknesses ... 22
Multiple Hurdles ... 23
Strengths and Weaknesses ... 24
Decision Tree Analysis ... 27
Automatic Interaction Detection (AID) ... 30
Classification and Regression Trees (CART) ... 31
Decision-Making Criteria ... 32
Validity ... 33
Adverse Impact ... 35
Interpretability ... 36
CHAPTER III: METHODOLOGY ... 40
Study 1 ... 40
Procedure ... 40
Population Parameters ... 40
Model Variations ... 42
Model Variables ... 43
Big Five Personality ... 43
Cognitive Ability ... 43 Situational Judgment ... 44 Integrity ... 45 Data Analysis ... 45 Study 2 ... 48 Procedure ... 49 Population Parameters ... 49 Model Variations ... 50 Model Variables ... 50
Big Five Personality ... 50
Generalized Self-Efficacy ... 51
Internal Locus of Control ... 52
Job Satisfaction ... 52
Data Analysis ... 53
CHAPTER IV: RESULTS ... 54
Study 1 ... 54
Correlations and Mean Group Differences ... 54
Data Generation and Assessment ... 56
Test of Research Questions ... 58
Data Set 1 ... 60 Validity ... 60 Adverse Impact ... 61 Interpretability ... 61 Data Set 2 ... 63 Validity ... 63 Adverse Impact ... 64 Interpretability ... 64 Data Set 3 ... 65 Validity ... 66 Adverse Impact ... 66 Interpretability ... 66 Data Set 4 ... 68 Validity ... 68 Adverse Impact ... 69 Interpretability ... 69
Data Set 5 ... 70 Validity ... 70 Adverse Impact ... 71 Interpretability ... 71 Data Set 6 ... 73 Validity ... 73 Adverse Impact ... 73 Interpretability ... 74 Data Set 7 ... 75 Validity ... 75 Adverse Impact ... 75 Interpretability ... 76 Data Set 8 ... 77 Validity ... 77 Adverse Impact ... 78 Interpretability ... 78 Study 2 ... 80 Correlations ... 80
Data Generation and Assessment ... 81
Test of Research Questions ... 81
Data Set 1 ... 82
Validity ... 83
Interpretability ... 83
Data Set 2 ... 85
Interpretability ... 85
Data Set 3 ... 87
Validity ... 87
Interpretability ... 87
CHAPTER V: DISCUSSION ... 90
Discussion and Results and Research Questions ... 91
Research Question 1 ... 92
Research Question 2 ... 94
Research Question 3 ... 96
Research Question 4 ... 98
Study Implications ... 101
Study Limitations and Future Research ... 103
Conclusions ... 105
REFERENCES ... 107
LIST OF TABLES
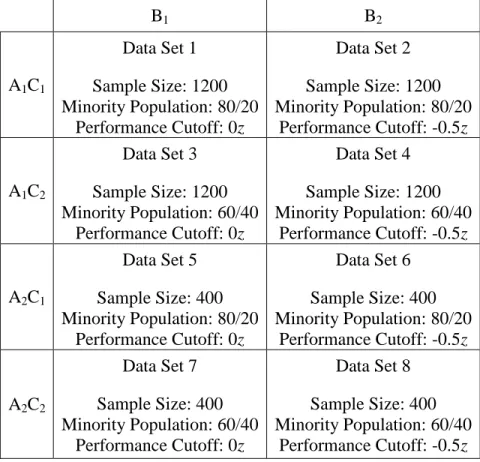
Table 1: Data Set Parameters (Study 1) ... 41
Table 2: Data Set Parameters (Study 2) ... 50
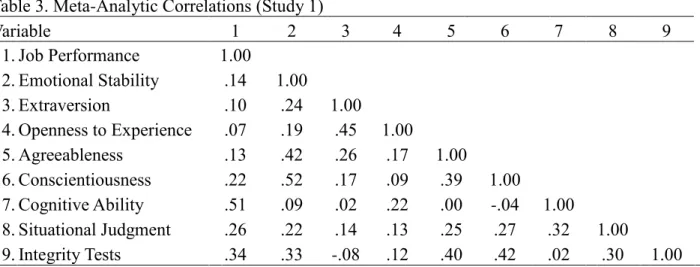
Table 3: Meta-Analytic Correlations (Study 1) ... 55
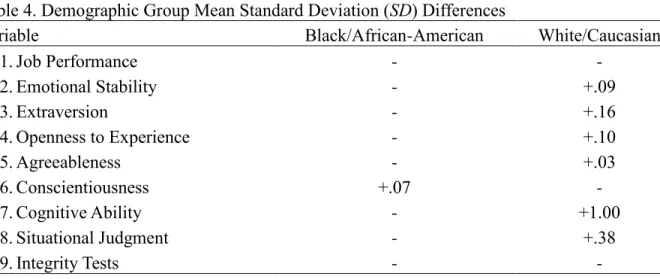
Table 4: Demographic Group Mean Standard Deviation (SD) Differences ... 56
Table 5: Data Set Correlation Discrepancies ... 58
Table 6: Model Classification Accuracy and AUC Index (Study 1) ... 59
Table 7: Model Adverse Impact ... 60
Table 8: Meta-Analytic Correlations (Study 2) ... 81
Table 9: Model Classification Accuracy and AUC Index (Study 2) ... 82
LIST OF FIGURES
Figure 1: Strong relationship with tight clustering of cases around estimate line (a) and weak relationship with loose clustering of cases around estimate line (b) ... 12
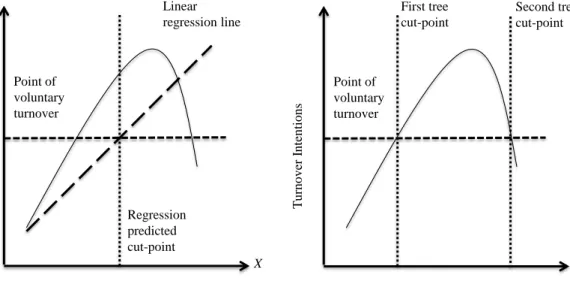
Figure 2: Sample curvilinear relationship between turnover and performance ... 15
Figure 3: Evenly distributed clustering of cases around estimate line, “homoscedastic” (a) and fan-like clustering of cases around estimate line, “heteroscedastic” (b) ... 16
Figure 4: Rectangular partitions (a) and associated decision tree (b) ... 29
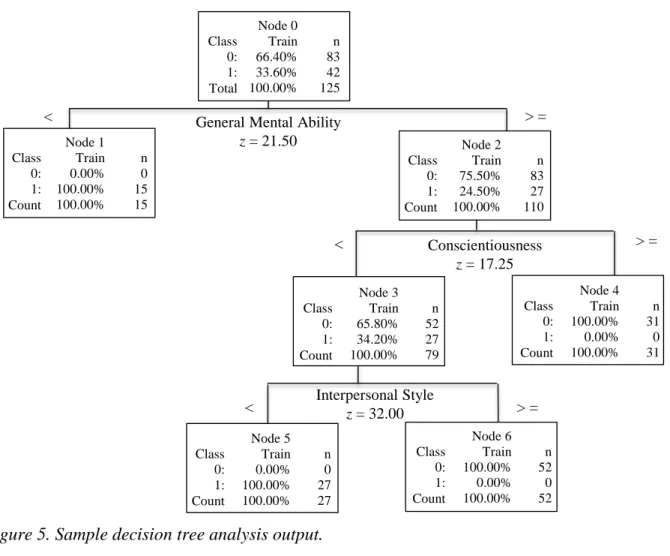
Figure 5: Sample decision tree analysis output ... 38
Figure 6: Sample regression solution that fails to model the depicted curvilinear relationship (a) and sample decision tree solution that models the depicted curvilinear relationship
CHAPTER I: INTRODUCTION Personnel Decision-Making
Personnel decision-making has gained mainstream popularity in the global business
community and is a key management activity for any successful organization (Scullion, Collings,
& Caligiuri, 2010). Furthermore, the process of making personnel decisions is no longer a
function exclusive to Human Resources (HR), as Chief Executive Officers (CEOs) report
spending a substantial amount of time on personnel activities (Economist Intelligence Unit,
2006). Personnel decision-making is part of an organization’s efforts to strategically attract,
select, develop, and retain high-performing employees (Farndale, Scullion, & Sparrow, 2010;
Scullion et al., 2010). Moreover, employers utilize strategic personnel decision-making to
remain competitive in the current global market, which considers highly-skilled workers to be
one of the most important corporate resources available (Chambers, Foulon, Handfield-Jones,
Hankin, & Michaels, 1998; Farndale et al., 2010; Vaiman, Scullion, & Collings, 2012).
Unfortunately, personnel decision-making is an area in which many HR professionals
lack competence and expertise (Mellahi & Collings, 2010; Vaiman et al., 2012). Additionally,
challenges, such as talent shortages, have continued to develop and place further strain on
organizations seeking to remain competitive (Scullion et al., 2010). For example, in 2000,
approximately 90 percent of organizational leaders reported experiencing difficulty attracting
and retaining talented employees (Axelrod, Handfield-Jones, & Welsh, 2001) and as of 2008,
talent was still listed as a top priority of organizations (Beechler & Woodward, 2009). New
issues have also emerged including a demand for organizations to focus on employee-centered
outcomes (e.g., well-being; Van De Voorde, Paauwe, & Veldhoven, 2012). Research on
(e.g., commitment, satisfaction; Nishii & Wright, 2007), but also enhance performance
(Hoffmeister, Gibbons, Schwatka, & Rosecrance, 2015). As a result, organizations must now
attend to a variety of targets and be capable of engaging in effective personnel decision-making
in order to ensure future success.
Objectives of Personnel Decision-Making
Within an organization, personnel decision-making may address a variety of issues
included in the process of attracting, selecting, developing, and retaining talented employees
(Vaiman et al., 2012). For example, leaders within an organization may use data (e.g., an
employee’s tenure and previous performance) to ascertain if an employee should either be sent to training courses or is prepared for a shift into management. Although all personnel decisions can
have a significant effect on both the employee and organization (Singh, Darwish, Costa, &
Anderson, 2012), two specific objectives of personnel decision-making are particularly important
to the workplace for their impact on organizational outcomes. Specifically, both employee
performance (within the context of personnel selection) and employee health are essential to
organizational success. The former objective is considered critical as it characterizes the degree
to which an employee contributes to an organization and serves as the criterion of interest when
selecting new employees. Subsequently, it has been the focus of organizational researchers for
decades (Dunnette & Borman, 1979; Giffin, 1989; Morris, Daisley, Wheeler, & Boyer, 2015). In
contrast, the latter is becoming increasingly more important to organizations as its influence on
performance becomes better understood (Schwartz & Riedel, 2010). Although personnel
selection boasts an extensive history of usefulness within organizations, employers have only
recently begun to embrace the potentially equal importance of employee health (Schultz &
Personnel selection. Personnel selection has played a role in the lives of employees,
organizations, and researchers for nearly 100 years. The overall goal of any personnel selection
system is to produce and maintain high levels of organizational productivity by selecting
individuals who will demonstrate high levels of job performance (Hunter, 1983). This task is
typically accomplished through the application of psychological tests that systematically assess
and predict an individual's potential future performance (Dunnette & Borman, 1979).
Furthermore, practices such as job analysis and construct validation add rigor and accuracy to
this endeavor (Freyd, 1923). Researchers predominately view personnel selection as a means for
making accurate decisions regarding an employee’s expected level of future performance. Present issues surrounding personnel selection include the use of alternative predictors of
employee performance (e.g., personality, emotional intelligence, integrity) and novel methods of
statistical analysis to address differential relationships with a criterion across employees (Sackett
& Lievens, 2008).
Employee health. More recently, employers have begun focusing their attention on
employee health as a mechanism for maintaining high levels of productivity and retaining top
talent (Sears, Shi, Coberley, & Pope, 2013). Not only can physical and mental health affect an
individual’s status with regard to morbidity and health care costs (Harrison, Pope, Coberley, & Rula, 2012), it can also interfere with work-related factors, such as the ability to be present and
perform at an acceptable level (Stewart, Ricci, Chee, & Morganstein, 2003). Although it was
originally established as an important aspect of personnel management via its link with
organizational health care costs (Vickery, Golaszewski, Wright, & McPhee, 1986; Yen,
Edington, & Witting, 1991), the focus on employee health has continued to grow. For example,
organization and are in need of workplace intervention (Schultz & Edington, 2007).
Furthermore, modern interventions, such as changing an organization’s ergonomics climate via
job redesign and elimination of perceived hazards, are being incorporated into the workplace in
an attempt to reduce physical and mental strain and increase employee productivity (Hoffmeister
et al., 2015). The impact of well-being on organizational outcomes and the efficacy of
workplace interventions are also being studied longitudinally in order to better estimate health
costs and inform future interventions (Sears et al., 2013). As with personal selection, issues
regarding the application of novel statistical analyses to issues of employee health must also be
examined. Although the benefits of such analyses may be best demonstrated first within the
context of personnel selection, which serves as the entry point into an organization and
represents a disproportionate amount of empirical research, additional examination within the
context of employee health is critical when identifying benefits for fields of study such as
Occupational Health Psychology (OHP).
Statistical Techniques for Decision-Making
In order to obtain and retain top talent, numerous personnel selection measures have been
developed to help organizations forecast a candidate’s potential job performance (Schmidt &
Hunter, 1981). Such measures include work samples, cognitive ability tests, integrity
assessments, and personality inventories (Sackett & Lievens, 2008; Thornton & Kedharnath,
2013; Van Iddekinge, Roth, Raymark, & Odle-Dusseau, 2012). Following the collection of
candidate data via some or all of these measures, statistical techniques are utilized to develop
predictive models that determine the probability that a given job candidate will demonstrate an
acceptable level of performance. Traditionally, organizational researchers have relied on
Steinhaus, Edwards, & DeLessio, 1991; Stauffer & Ree, 1996). However, research suggesting
that potential improvements can be made with regard to the validity and interpretability of
derived solutions has promoted the use of novel statistical techniques, such as decision tree
analysis (Lemon, Roy, Clark, Friedmann, & Rakowski, 2003; Lewis, 2000; Loh, 2009).
Multiple linear regression is one of the most frequently employed statistical techniques in
the social sciences (Sanders & Brynin, 1998). In general, regression models use information
about a given set of predictor variables to construct a simple linear equation that predicts the
value of a given criterion variable. In order to evaluate the derived solution, researchers use an
R2statistic that indicates the proportion of variance in the criterion explained by the model (Sweet & Grace-Martin, 2012). Multiple linear regression is best used when the outcome of
interest demonstrates the characteristics of continuous, interval-style data. However, if the
criterion is dichotomous, as may often be the case in personnel decision-making, binary logistic
regression is a more appropriate analysis. Although both of these techniques are widely used
within the field of personnel decision-making, each method is characterized by a variety of
important assumptions and potential weaknesses.
One statistical method that demonstrates particular promise for personnel
decision-making is data mining. Data mining procedures, such as decision tree analysis, are currently
utilized within the fields of statistics, medical diagnosis, and fraud detection (Lavanya & Rani,
2011). For example, medical researchers utilize various decision tree analysis techniques, such
as Iterative Dichotomiser 3 (Quinlan, 1986), C4.5 (Quinlan, 1993), and Classification and
Regression Trees (Breiman, Friedman, Olshen, & Stone, 1984), to make important clinical
decisions regarding diagnosis and treatment (e.g., classifying patient risk). Similarly, financial
and Bayesian networks, to detect fraudulent financial transactions and behaviors (e.g.,
manipulation of financial records; Zhou & Kapoor, 2011).
Of particular relevance to making personnel decisions is decision tree analysis. Decision
tree analysis utilizes binary recursive partitioning to construct multi-pathway predictive models
of categorical outcomes. This method is preferred by many researchers for its ability to provide
accurate and interpretable classification solutions in the midst of data characteristics that
typically violate the statistical assumptions of traditional techniques (Karels, Bryant, & Hik,
2004; Lewis, 2000). As with medical data, personnel data can often be non-normal, demonstrate
non-linear relationships, and have a substantial amount of multicollinearity (Schmidt, Ones, &
Hunter, 1992). As a result, traditional modeling techniques may provide predictive solutions
with decreased levels of validity (Lumley, Diehr, Emerson, & Chen, 2002). Furthermore,
traditional techniques may also limit the ability for certain candidates to demonstrate
compensatory abilities, resulting in solutions with increased levels of adverse impact. In
contrast, decision tree analysis is both non-parametric and compensatory (Karels et al., 2004).
Despite such benefits, the use of decision tree analysis in the practice of personnel
decision-making is largely non-existent. Potential reasons for the underutilization of decision
tree analysis include a general lack of understanding and experience with the technique, as well
as the technique’s origin within the field of machine learning, which may be unfamiliar to
individuals who make personnel decisions (Lewis, 2000; Loh, 2011). Furthermore, the statistical
software necessary to conduct decision tree analysis was, until recently, more difficult for
practitioners to obtain (Lewis 2000). However, as there have been substantial gains in both the
understanding of the technique and the accessibility of necessary software in recent years,
Current Study
In the current study, the relative advantages and disadvantages of applying decision tree
analysis to predict employee performance and health were investigated. Specifically, decision
tree analysis was evaluated in comparison to binary logistic regression regarding the ability to
provide organizations with optimal decision-making solutions. By incorporating employee
performance and health, the current study consisted of both a historically significant component
of personnel decision-making, as well as an emerging aspect that is expected to play a growing
role in the success of organizations. Furthermore, the current study included key outcomes of
interest within the field of OHP. In order to compare the efficacy of each technique, a variety of
comparison criteria were utilized (i.e., validity, adverse impact, interpretability). In particular,
decision tree analysis was investigated for its potential to model multiple pathways to
organizational outcomes and provide fair and accurate statistical solutions.
Research Questions
Given the many benefits provided by the use of decision tree analysis in other areas of
study (e.g., statistics, medicine), it is imperative that the technique be investigated for potential
advantages within the context of personnel decision-making. In conducting such an
investigation, the following research questions (RQ) were proposed:
RQ1: In comparison to traditional methods (i.e., binary logistic regression), can the use of
decision tree analysis provide benefits to the practice of personnel decision-making?
RQ2: When modeling key organizational outcomes (i.e., employee performance and
health), what potential benefits to classification accuracy are provided by decision tree
RQ3: When modeling key organizational outcomes (i.e., employee performance and
health), what potential benefits to non-discriminatory hiring (i.e., adverse impact) are
provided by decision tree analysis in comparison to binary logistic regression?
RQ4: When modeling key organizational outcomes (i.e., employee performance and
health), what potential benefits to interpretability are provided by decision tree analysis in
CHAPTER II: LITERATURE REVIEW Personnel Selection
Faced with today’s competitive global environment, organizations are increasingly aware of the impact that personnel decision-making can have on organizational success (Carless, 2009;
Vaiman et al., 2012). Although a variety of decisions and strategies may be used by an
organization to increase the performance of its employees, none may be more important than
efficient and effective personnel selection (Thomas & Scroggins, 2006). Personnel selection is
the process of collecting and utilizing data about a job candidate in order to make important
employment decisions, such as whether or not to extend an initial offer of employment or
whether or not a particular individual should be promoted (Guion & Gibson, 1988). This process
is of critical importance to the success of an organization (Chien & Chen, 2008) as personnel
selection is the primary mechanism for evaluating an individual’s ability to perform a particular
job and placing him or her within the organization (Zhang & Liu, 2011). In comparison,
personnel-related decisions made after selection are largely aimed at improving upon an
employee’s skills, abilities, and performance (Gorman, Thibodeaux, Eisinger, & Overstreet, 2012). However, if an employee does not possess the initial traits, skills, and abilities necessary
for successful performance, such strategies may be misguided and result in failure and wasted
resources (Gowan & Gatewood, 2013). Consequently, it is essential that organizations maximize
personnel decisions prior to the onset of employment.
Fortunately, decades of research on personnel selection have provided organizations with
a wealth of knowledge and guidance (Schmidt & Hunter, 1998). For example, research has
highlighted the importance of first conducting a robust evaluation of the job of interest (i.e., job
skills, and abilities (KSAs) that are necessary for success (Borman, Hanson, & Hedge, 1997).
Following the collection of such information, organizations must identify methods for
determining if a job candidate has the appropriate KSAs required to perform the job effectively
(Robertson & Smith, 2001). Personnel selection research has promoted the use of psychological
assessment devices to assist organizations in accomplishing this task (e.g., Carless, 2009;
Terpstra & Rozell, 1993; Thomas & Scroggins, 2006). The use of psychological assessments
has rapidly increased over time (Anderson, 2005). For example, as of 2004, nearly half of all
Fortune 100 companies reported using some form of personality assessment when making
employment decisions (Erickson, 2004). Moreover, integrity tests, a particular type of
personality assessment aimed at measuring an employee’s predisposition towards dishonesty and counterproductive work behavior (Hogan & Brinkmeyer, 1997), are reportedly given to millions
of job applicants per year in an attempt to ascertain their suitability for employment (Heller,
2005). Additional methods recommended to organizations when making personnel decisions
include structured interviews, work samples, and assessment centers (Borman et al., 1997; Guion
& Gibson, 1988; Robertson & Smith, 2001). Overall, the use of these methods seeks to facilitate
accurate prediction of job performance, improve employee-organization fit, and reduce turnover
(Rothstein & Goffin, 2006).
Despite the rapid growth and success of selection procedures, improvements are still
needed (Sackett & Lievens, 2008). One area in which innovations can benefit the field is in
regard to how personnel decisions are ultimately made. Specifically, relatively little emphasis is
placed on the statistical analysis process of personnel decision-making (Hunsley & Meyer,
Traditional Decision-Making Methods Statistical Methods
Multiple linear regression. Multiple linear regression is one of the most commonly
used statistical methods throughout the social sciences and within personnel selection (Halinski
& Feldt, 1970; Kriska & Milligan, 1982). In general, linear regression uses information about a
given set of independent or “predictor” variables (i.e., X1,X2, X3, …) to predict the value of a given
dependent or “criterion” variable (i.e., Y; Flynn & Peterson, 1972). Although the primary purpose of regression is to predict future values of a criterion variable using only information
about a set of independent variables, in the context of personnel selection, regression models are
commonly first constructed on a concurrent sample that provides information on both predictor
and criterion variables (Peterson & Wing, 2001). In either case, multiple regression models can
be expressed as a simple linear equation:
Y = a + b1X1 + b2X2 + … + b nXn+ e (1)
Within the linear equation, the term, a, represents the intercept, b represents the slope or change
in the criterion variable given a one unit change in a predictor variable, and as previously
mentioned, Y and X represent the criterion and predictor variables, respectively (Sanders &
Brynin, 1998). Values of the intercept and slope are defined in order to minimize the sum of
squared residuals and form the best-fitting line to the sampled data (McCornack, 1970).
Subsequently, values of the criterion variable can be predicted using only the values of a select
number of predictor variables and their estimated intercept and slope coefficients (Halinski &
Feldt, 1970; Sanders & Brynin, 1998).
Unfortunately, predictions based on regression equations are rarely ever void of error. In
is not explained by the linear combination of the included predictor variables (Rossi, 2010).
However, as the strength of the relationships between the predictor variables and Y increases, the
magnitude of error in the model decreases. Moreover, as error, or residuals for each case in the
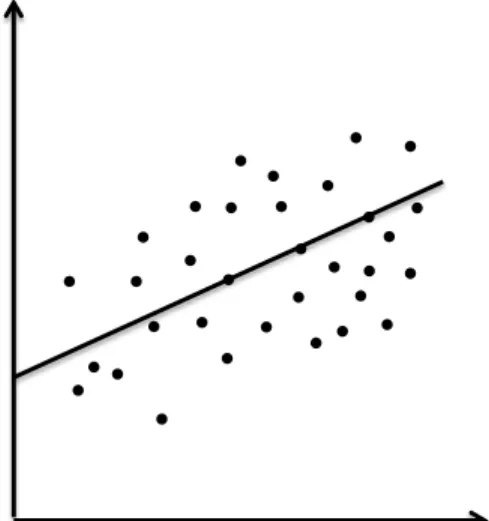
model, becomes smaller, the regression model will be characterized by a tight clustering of cases
around the estimate line, as shown in Figure 1 (Sanders & Brynin, 1998). Lastly, as a
mechanism for evaluating linear regression models, researchers typically utilize the R2 statistic, which ranges from 0 to 1 and indicates the strength of the relationship or proportion of variance
in the criterion variable that is explained by the model (Kriska & Milligan, 1982; Sweet &
Grace-Martin, 2012).
Figure 1. Strong relationship with tight clustering of cases around estimate line (a) and weak relationship with loose clustering of cases around estimate line (b).
When developing a personnel selection system, multiple regression is typically included
in the final stage of data analysis (Sweet & Grace-Martin, 2012). First, job incumbents are
assessed using a battery of selection instruments (i.e., predictor variables) from which predictor
scores are derived (Weissmuller & Damos, 2014). Criterion scores are also collected for each
incumbent during this stage. Next, organizations conduct univariate and bivariate analyses in
X Y (a) X Y (b)
order to assess the assumptions of the linear model and better understand the structure and
distribution of the predictor variables (Rossi, 2010). Following this stage, a multiple regression
model is fit using the least squares method—determining the equation of the best fitting line that
minimizes the sum of squared deviations (McCornack, 1970). If the derived model is
significant, it is then utilized as a predictive model for job candidates (Rossi, 2010). This
process is completed by first assessing job candidates via a battery of selection instruments,
identical to those used to develop the predictive model (Peterson & Wing, 2001). Organizations
then utilize both the predictor variable scores and the linear model’s regression equation to
generate a single predicted criterion score. Finally, selection decisions are made based on each
candidate’s predicted level of job performance (Weissmuller & Damos, 2014).
Strengths and weaknesses. Linear regression is one of the most known and
well-received statistical techniques in organizational psychology (Raju et al., 1991; Stauffer & Ree,
1996). This may be due to the fact that regression allows individuals to statistically support
theoretical explanations for social phenomena (Sanders & Brynin, 1998). Beyond this aspect,
regression boasts a variety of other strengths that help to explain its popularity. For example, it
is characterized by its ability to demonstrate the collective effect of multiple predictors (Sweet &
Grace-Martin, 2012). Specifically, when multiple variables are included in a model, regression
identifies the portion of variance collectively explained by the variables, each variable’s specific effect on the outcome variable (i.e., semi-partial correlation), and the portion of variance that
remains unexplained (Abdi, 2007). Such information is critical to researchers who must measure
the amount of explained variance, in order to develop the most parsimonious model possible and
Furthermore, regression is powerful in its ability to account for the effect of spurious
relationships through the use of control variables (Sweet & Grace-Martin, 2012). By including
control variables, regression is able to determine which predictor variables demonstrate a unique
effect on the outcome and which predictor variables only demonstrate an effect on the outcome
due to their relationship with other variables (Jaccard & Turrisi, 2003). For example, researchers
may control for demographic characteristics, such as gender and age, to ensure that predictor
variables contribute unique amounts of variance and are useful for inclusion in selection systems.
Similarly, researchers may find that although a variable appears to have a particular relationship
with a criterion, in the presence of another variable, the original relationship disappears (Cohen,
Cohen, West, & Aiken, 2003). This facet of regression allows researchers to identify the most
valid and parsimonious model (McCornack, 1970). Overall, regression is a useful tool for
constructing predictive equations that form the best fitting line for, theoretically, all individuals
in a sample. Nevertheless, in addition to regression’s many strengths, there are also several
weaknesses that limit its use.
Although regression performs relatively well when modeling linear relationships, when
data are non-linear or “curvilinear,” regression may fail to identify the most accurate solution
(Sharma, 2005). Specifically, when variables have a linear relationship with a criterion, scores
on the predictor variable will have a consistent relationship with scores on the criterion variable
(Cohen et al., 2003). For example, if positively correlated, low scores on the predictor variable
are associated with low scores on the criterion. Similarly, if negatively correlated, low scores on
the predictor variable are associated with high scores on the criterion. However, not all variables
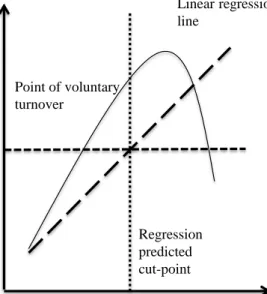
demonstrate linear relationships. One example of a curvilinear relationship is found between
& Estelami, 2007; Stone & Kendall, 1956; Trevor, Gerhart, & Boudreau, 1997). Specifically,
research demonstrates that very high or very low levels of intelligence and job performance are
associated with high risk of turnover for jobs that require average levels of intelligence or present
limited opportunities to above-average employees (Williams & Livingstone, 1994). As a result,
regression may fail to identify the curvilinear relationship and produce an inadequate linear
model. Moreover, advanced regression techniques that can be used to model curvilinear data,
such as polynomial regression, may surpass the capabilities of an organization whose primary
function is not related to statistical analysis.
Figure 2. Sample curvilinear relationship between turnover and performance.
Additionally, regression is limited in its inability to deal with non-normal data, as well as
data that consist of characteristics that violate statistical assumptions made by regression, such as
the assumption of homoscedasticity (Long & Ervin, 2000). Specifically, linear regression
models produce residuals, or deviations between the actual and predicted values of a criterion for
each case, that are non-random. The residuals produced by linear regression assume
homoscedasticity, or a stable and systematic distribution of residuals at all levels of the linear
Job Performance Y T ur nove r Inte ntions Point of voluntary turnover Regression predicted cut-point Linear regression line
combination (Leslie, Kohn, & Nott, 2007). However, some data do not demonstrate such
consistency. Rather, for data that demonstrate heteroscedasticity, regression is much better at
predicting values at a certain point in the distribution than it is at predicting values at other points
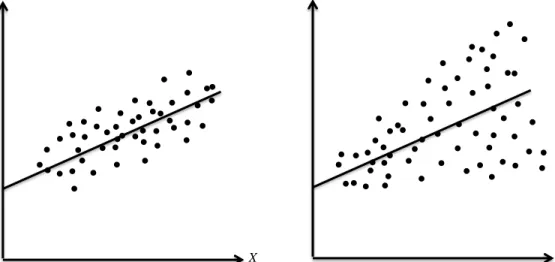
in the distribution (Sweet & Grace-Martin, 2012). For example, the data may produce a “fan
effect” that is characterized by cases that are increasingly less clustered around the regression line at higher values of the criterion than at lower values (see Figure 3). Due to such
characteristics, regression fails to produce the best model of the data and is limited in its ability
to accurately describe and predict the criterion (Long & Ervin, 2000). Nonetheless, linear
regression stands as one of the most common statistical methods for predicting important
organizational outcomes.
Figure 3. Evenly distributed clustering of cases around estimate line, “homoscedastic” (a) and fan-like clustering of cases around estimate line, “heteroscedastic” (b).
Binary logistic regression. In addition to multiple linear regression, researchers may
also utilize binary logistic regression when making important personnel decisions. Logistic
regression has become increasingly popular within the social sciences and is the preferred form
of regression when modeling dichotomous criteria (Aldrich & Nelson, 1984; Pohlmann &
X Y (a)
X Y (b)
linear, are limited when modeling data that consists of heteroscedasticity and nonlinearity. Such
issues can be common when using dichotomous criteria and become even more pronounced
when participants are not evenly split on a criterion (Stauffer & Ree, 1996). Furthermore, when
attempting to clearly classify employee performance as either acceptable or not acceptable, linear
regression is criticized for providing organizations with predicted values that are difficult to
interpret (Raju et al., 1991). In contrast, logistic regression yields predicted values that can be
interpreted as probabilities of success within a fixed 0 to 1 range. Logistic regression is also
capable of being evaluated using easy to understand classification criteria such as accuracy,
specificity, and sensitivity (Stauffer & Ree, 1996).
In general, logistic regression uses information about a given set of predictor variables to
estimate the probability of a binary outcome occurring (Ngo, Govindu, & Agarwal, 2015).
Similar to linear regression, logistic regression can also be expressed via the following equation:
Log [p / (1-p)] = β0 + β 1X1 + β 2X2 + … + β nXn+ e (2)
Within the equation, the term p represents the probability of the outcome, β 0 represents the
intercept, and βi represents the logistic regression coefficient for each predictor variable (Ngo et
al., 2015). In comparison to linear regression, which uses a least squares method to determine
the equation of the best fitting line that minimizes the sum of squared deviations (McCornack,
1970), logistic regression uses maximum likelihood estimation to find the set of coefficients for
which the probability of the observed data is greatest (Czepiel, 2002). Furthermore, by utilizing
a logit transformation, logistic regression is capable of performing such estimation despite the
presence of non-normal data characteristics, such as non-linearity and heterogenous error
Strengths and weaknesses. Binary logistic regression is characterized by a variety of
strengths associated with its relative lack of strict statistical assumptions that limit other forms of
regression (Peng et al., 2002). This leniency makes logistic regression the current technique of
choice when modeling dichotomous outcomes (Ngo et al., 2015). Nevertheless, logistic
regression is still characterized by weaknesses that can limit its overall usefulness to
organizations. For example, as with linear regression, logistic regression is limited when
modeling data that demonstrate multicollinearity (i.e., when two or more predictor variables
included in a model are highly correlated with one another; DeMaris, 2013; Vaughan & Berry,
2005). Unfortunately, personnel data are often comprised of predictors that consist of a
substantial amount of multicollinearity (e.g., the five factor model; Schmidt et al., 1992). As a
result, logistic regression can produce a model that possesses inflated estimates and standard
errors, as well as counterintuitive signs of coefficients (Schaefer, 1986; DeMaris, 2013).
Although the weaknesses of logistic regression are comparatively fewer than linear regression,
areas for improvement still exist in regard to accurate classification results.
Selection Techniques
Cutoff scores. Beyond regression, researchers in personnel selection may employ a
variety of other techniques when developing selection systems. One such technique is the setting
of cutoff scores (Truxillo, Donahue, & Sulzer, 1996). Cutoff scores refer to a specified point on
a distribution of scores, derived from either a single measure or battery of measures, above
which candidates’ scores are considered acceptable and below which they are considered
unacceptable (Cascio, Outtz, Zedeck, & Goldstein, 1995). Such cutoff scores have traditionally
played an important role in personnel decision-making and have assisted practitioners in
Alexander, & Barrett, 1988). Although cutoff scores may be assigned somewhat arbitrarily,
legal and academic trends have placed pressure on organizations to use standardized practices for
setting scores (Maurer, Alexander, Callahan, Bailey, & Dambrot, 1991). Consequently, it is
important to review the importance of cutoff scores, their legal implications, methods for
selecting quality cutoff scores, and their overall strengths and weaknesses.
Although a select number of organizations are required to set cutoff scores by their
governing bodies (Truxillo et al., 1996), most are not. Furthermore, many organizational
researchers (e.g., Schmidt, Mack, & Hunter, 1984) recommend using top-down selection
procedures (i.e., measuring performance as a continuous variable and selecting candidates in
order of their scores). Unfortunately, top-down selection may be complicated by conflicting
organizational goals and responsibilities (e.g., validity, diversity; Cascio, Outtz, Zedeck, &
Goldstein, 1991). As a result of such issues, some researchers recommend the use of statistical
bands within which all candidates can be considered equal and selected upon an additional
unbiased criterion (Cascio et al., 1995). However, banding has also received significant criticism
on both statistical and logical grounds (Schmidt, 1991; Schmidt & Hunter, 1995). Therefore, the
setting of cutoff scores is an important technique for organizations to consider when balancing
valid selection decisions and workforce diversity.
As most organizations are faced with limiting factors, such as a specific number of
vacancies, it is important for researchers to be able to distinguish between candidates who justify
further consideration and those who do not. In order to accomplish this task, organizations may
select cutoff scores that separate desirable candidates from those who are undesirable (Corte,
1995). Furthermore, although many employee outcomes are frequently considered continuous,
failing to meet a pre-specified standard (Farrington & Loeber, 2000). Under such circumstances,
there are a variety of ways in which cutoff scores can be used (Cascio et al., 1988). For instance,
when faced with few vacancies or a low need for new incumbents, organizations can establish a
relatively high cutoff score and only select individuals who exceed the high standard. Next,
when faced with many vacancies and a high need for new incumbents, organizations can
establish a relatively low cutoff score and select all individuals who demonstrate basic
proficiency. In this second instance, the defined cutoff score is of less importance, as job
openings are likely to be filled before reaching the low cutoff score (Cascio et al., 1988).
Finally, organizations may strategically incorporate cutoff scores into a multiple hurdle selection
system that only permits a select group of candidates to proceed to more costly selection
procedures, such as assessment centers and on-site interviews (Weissmuller & Damos, 2014).
For all of these circumstances, cutoff scores are currently the preferred method for determining
which candidates have an adequate level of ability to move forward in the selection process and
which ones do not (Truxillo et al., 1996).
Legally, cutoff scores have received significant attention. Overall, court decisions have
been largely supportive of cutoff scores and place few restrictions on their use. For example, in
Board of Regents of the University of the State of New York v. Tomanio (1980), Justice Stevens
noted that testing “is a permissible method of determining qualifications, and lines must be
drawn somewhere” (p. 446). Furthermore, when questioned on the grounds of constitutional rights and discrimination, courts have consistently upheld the method and support the use of
cutoff scores as long as they are reasonable and are selected with some degree of rationale
(Cascio et al., 1988). For example, classic adverse impact cases, such as Griggs v. Duke Power
(1975), all call into question the selection of cutoff scores that were perceived as exceedingly
stringent or discriminatory. Nevertheless, all organizations involved in such cases were able to
justify the use of the particular cutoff score and the scores were permitted for use, with one
portion of the Griggs v. Duke Power Co. (1971) ruling stating, “an employer may set his qualifications as high as he likes, he may test to determine which applicants have these
qualifications, he may hire, assign, and promote on the basis of test performance” (p. 401).
Despite seemingly vague standards and restrictions surrounding cutoff scores, researchers must
be familiar with techniques for selecting appropriate cutoff scores, as court cases regarding
discrimination and constitutionality have historically had a significant influence on the field of
personnel selection and can be costly to organizations.
Formal recommendations for setting cutoff scores typically lack specificity regarding the
type of procedure or information an organization should consider when making such decisions.
For example, the Uniform Guidelines on Employee Selection Procedures (1978) merely state that
a cutoff score should be both reasonable and consistent with the expectations for acceptable
workforce proficiency (EEOC, 1978). Nevertheless, several general recommendations exist to
help guide organizations in establishing appropriate cutoff scores. First, court cases, such as
Vulcan Pioneers v. New Jersey Department of Civil Service (1985), have established the notion
that cutoff scores should (1) be consistent with information derived from a job analysis, (2)
permit the selection of qualified candidates, and (3) allow an organization to achieve its
workforce diversity goals (Cascio et al., 1988). Next, the creation and implementation of cutoff
scores should always be completed with the assistance of subject matter experts (SMEs; Cascio
cutoff scores that are effective and defensible, standardized methods should be used for setting
the appropriate cutoff score. One such technique is the Angoff method (Angoff, 1971).
The Angoff method is considered to be the best-suited technique for producing cutoff
scores that have a high level of content-related validity, technical adequacy, and practicality
(Maurer et al., 1991). Furthermore, researchers (Berk, 1986; Cascio et al., 1988; Shepard, 1980)
have established the Angoff method as the preferred technique for setting cutoff scores, due to its
high degree of reliability and ease of use. Specifically, the Angoff method requires multiple
raters, who are typically SMEs, to individually rate the probability that a minimally competent
candidate would answer a test item correctly (Maurer et al., 1991). Test items may come from a
variety of different job-related measures used for a selection system. After all raters have
estimated the appropriate probability for each item, a cutoff score is determined by calculating
the sum of the item proportions (i.e., the average of the item proportions multiplied by the
number of test items; Maurer et al., 1991). Lastly, if an organization’s selection system is not
complementary to the Angoff method (e.g., uses a limited number of selection measures
featuring test items), it is recommended that other standardized procedures be used, such as
having SMEs determine an appropriate cutoff score based on a distribution of applicant
performance (e.g., at the mean, one standard deviation above the mean, one standard deviation
below the mean; Cascio et al., 1988).
Strengths and weaknesses. Cutoff scores boast a variety of strengths and are considered
an important tool for personnel decision-making. In general, they are easy to implement, legally
defensible, and useful in categorizing candidates by their level of competence. Furthermore,
cutoff scores help to facilitate the use of multiple hurdle selection systems by eliminating
consideration in the selection process. In turn, cutoff scores can save organizations financial and
time-based resources. Finally, due to the relatively vague standards surrounding the use of cutoff
scores, organizations have the flexibility necessary to modify and select cutoff scores that best
meet their changing needs (Cascio et al., 1988).
Organizations should, however, be aware of the limitations regarding the use of multiple
cutoff scores. Although every attempt should be made to produce valid and reliable cutoff scores
via standardized methods and quality SMEs, cutoff scores can be relatively subjective. As a
result, organizations may find that personnel decisions made using a particular cutoff score are
not well correlated with subsequent job performance. Despite legal guidelines that do not
require mathematical precision or a high degree of accuracy, such issues should still remain
important to personnel decision-makers (Cascio et al., 1988). Lastly, given the recommended
procedure for establishing appropriate cutoff scores (e.g., Angoff method), it can be assumed that
the quality of a cutoff score is a direct reflection of the SMEs who establish the score.
Consequently, organizations should carefully consider each SMEs level of competence and
qualifications for making assessments within the area of interest (Maurer et al., 1991).
Multiple hurdles. Organizations rarely use only one predictor variable when making
important personnel decisions. In turn, they are faced with the task of determining the best
technique for combining candidates’ predictor scores in order to make personnel decisions (Salgado, Viswesvaran, & Ones, 2001). One of the most frequently used techniques for
grouping candidates’ predictor scores and forming selection decisions is the multiple hurdle
system.
Within a multiple hurdle system, job candidates are assessed using a sequential series of
may consist of either a single job predictor (e.g., work sample) or a group of job predictors (e.g.,
cognitive ability and personality measures). Regardless of the number of predictors contained
within each hurdle, when assessed by a multiple hurdle system, job candidates must ultimately
meet the requirements of one hurdle before proceeding to the next (Salgado et al., 2001). Similar
to a multiple cutoff method, multiple hurdle systems assume that a minimum level of ability is
required to perform any particular job (Finch, Edwards, & Wallace, 2009). Consequently, when
designing a multiple hurdle system, organizations must decide both the number and type of
predictors to be nested within each hurdle, as well as the minimum level of acceptable
performance on each hurdle (Finch et al., 2009). Overall, multiple hurdle systems are a useful
and popular tool for incorporating the techniques of multiple regression and multiple cutoffs into
a robust selection system.
Strengths and weaknesses. One strength offered by a multiple hurdle system is the
financial savings it provides to organizations. As most selection assessments vary in cost,
organizations may be hesitant to use certain techniques (e.g., assessment centers) or administer
all selection assessments to an entire candidate pool, which is often very large in comparison to
the number of available positions (Salgado et al., 2001). Fortunately, multiple hurdle systems
allow organizations to sequentially administer selection assessments to candidates and only
utilize expensive techniques on quality applicants who have progressed through the hurdle
system (Mendoza, Bard, Mumford, & Ang, 2004). Additionally, multiple hurdle systems may be
preferred when selecting for positions that demand an applicant to have a particular skill or
ability. For example, when selecting for airline pilots, organizations must ensure that a candidate
has the visual abilities to pilot an aircraft (Temme, Still, & Fatcheric, 1995). If a candidate does
selection measures to the individual (Finch et al., 2009). However, it can be assumed that
currently, such positions are the exception, rather than the rule, and that most modern day
positions require a candidate to display a variety of skills and abilities. It is for such positions
that multiple hurdle systems, as they are presently employed, demonstrate a critical weakness.
Specifically, multiple hurdle systems, as well as multiple cutoff systems, are
non-compensatory. Non-compensatory selection systems assume that all predictor variables are
equally important and thus, a job candidate cannot compensate for a deficit in one trait with
strengths in another (Salgado et al., 2001). Selection techniques such as multiple hurdle systems
are non-compensatory in that they eliminate job candidates for their lack of performance on
specific variables prior to assessing them on additional variables that may allow the individual to
still demonstrate acceptable levels of job performance. Although multiple hurdle systems can
conserve financial resources for an organization if the job is truly non-compensatory, in the
likely case that job performance can be achieved through compensatory means, then multiple
hurdle systems will result in error. Specifically, error occurs in non-compensatory selection
systems when candidates with high scores on initial screening predictors but unexceptional
scores on later hurdles and measures of job performance are selected, whereas candidates with
low scores on initial screening predictors but high scores on later hurdles and measures of job
performance are rejected (Sackett & Roth, 1996).
Given that the majority of modern jobs would in some way facilitate compensatory routes
to job performance, multiple hurdle systems and related non-compensatory techniques (e.g.,
multiple cutoff systems) are potentially inappropriate for continued use. The use of
compensatory systems that combine aptitude-based measures with various other predictors such
validity, decrease adverse impact, and increase utility has been explored in the past (Hoffman &
Thornton, 1997; Sackett & Roth, 1996); however, the use of data analysis techniques that
facilitate compensatory modeling has yet to be adequately investigated. Overall, traditional
selection systems are associated with a variety of strengths, as well as very important
weaknesses. Consequently, it is vital that novel decision-making methods be investigated for
their ability to better model compensatory variables and to provide organizations with valid and
fair selection systems.
Novel Decision-Making Methods
A novel decision-making method that demonstrates particular promise for personnel
decision-making originates from the field of data mining. Data mining techniques have become
increasingly popular in recent years and are currently utilized within the fields of statistics,
medicine, and fraud detection (Lavanya & Rani, 2011). Specifically, decision tree analysis is an
important statistical data mining technique that may prove extremely useful for personnel
selection and the modeling of organizational outcomes. Decision tree analysis is suggested to be
useful within the context of personnel decision-making due to its ability to construct
compensatory, multi-pathway models that overcome the many weaknesses of traditional
techniques. The construction of such compensatory models has the potential to assist
organizations in reaching both their accuracy and workforce diversity goals. Furthermore,
decision tree analysis has become a preferred method of analysis for many clinical researchers
who value the technique’s ability to provide accurate and interpretable solutions, despite the
presence of data characteristics that violate common statistical assumptions (Lewis, 2000).
A defining feature of decision tree analysis is its use of categorical outcomes. Although
dichotomized as either achieving or failing to achieve a predefined standard. Job performance is
an example of such an outcome. Specifically, job performance is often considered a continuous
variable and may be measured via objective performance data (e.g., number of sales) or
subjective supervisor ratings that use multiple scales of performance (Behrman & Perreault,
1982). However, in practice, organizations likely dichotomize job performance. For example,
organizations may classify candidate performance as either “acceptable” or “unacceptable,”
incumbents as either “high performers” or “low performers,” and employees as either displaying
a certain behavior (e.g., counter-productivity) or not (Farrington & Loeber, 2000; Herrero &
Villar, 2013; Stone & Kendall, 1956; Trevor et al., 1997). Furthermore, organizations may use
such classifications to make decisions and take action, such as deciding whether to terminate an
employee who consistently demonstrates poor performance or disruptive behavior (Viswesvaran,
Ones, & Schmidt, 1996).
Consequently, although operationalized as being continuous variables, many
organizational criterion measures may in fact be treated as dichotomous and then not truly have
the continuous, interval-style characteristics required by multiple linear regression. However, as
previously noted, binary logistic regression is specifically designed to model dichotomous
outcomes (Sanders & Brynin, 1998). As a result, binary logistic regression is the most
appropriate statistical method with which to compare to data mining techniques, such as decision
tree analysis.
Decision Tree Analysis
Four primary components are necessary to address any given classification problem.
These include: (1) A categorical outcome variable (e.g., job performance), (2) a set of predictor
sample), and (4) a future data set to which the derived model will be applied (Lewis, 2000). As
with traditional regression, decision tree analysis uses the aforementioned components to
construct a model for predicting values of the outcome variables from specifically defined values
of the predictor variables (Loh, 2011). However, in contrast to the single linear solution
provided by traditional methods, decision tree analysis identifies multiple pathways to a
particular outcome (Lewis, 2000). This solution is not achievable by traditional regression
techniques, which provide single linear combination solutions that assume a homogenous
relationship between predictor and outcome variables across all participants (Breiman, Friedman,
Olshen, & Stone, 1993).
Although this may seem counterintuitive, the identification of multiple pathways
conforms to the general notion that predictors of job performance are compensatory (Rothstein,
Paunonen, Rush, & King, 1994). For example, it is widely accepted in organizational research
that performance is a function of the product of ability and effort (Chan, Schmitt, DeShon,
Clause, & Delbridge, 1997). Thus, individuals with high levels of ability are typically successful
as are individuals who put forth high levels of effort. However, single linear models that find
ability to be most predictive of success may erroneously categorize individuals who have lower
levels of ability as unsuccessful. In contrast, decision tree analyses theoretically have the
capacity to simultaneously identify successful individuals with high levels of ability and
individuals with lower levels of ability who achieve success through high levels of effort or other
compensatory variables (e.g., personality).
Decision tree analysis grows decision trees via binary recursive partitioning, which
recursively splits a data set one predictor variable at a time (Loh, 2011). This process begins
of a predictor variable, a split is made and two binary “child” nodes are created. The recursive
process continues, subsequently converting child nodes into “parent” nodes as additional splits are made in the data. Recursive partitioning of data is often demonstrated geometrically by
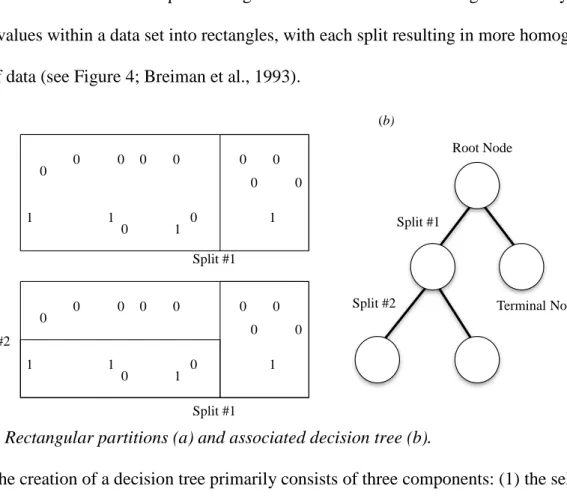
splitting values within a data set into rectangles, with each split resulting in more homogenous
groups of data (see Figure 4; Breiman et al., 1993).
Figure 4. Rectangular partitions (a) and associated decision tree (b).
The creation of a decision tree primarily consists of three components: (1) the selection of
points at which data can be split into nodes, (2) a decision regarding whether to terminate or
continue splitting a node, and (3) the assignment of each node that is terminated (i.e., no longer
split) to a particular outcome class (Breiman et al., 1993; Loh, 2011). Within the first
component, the primary goal is to select a split that produces subsets of data that are “purer” than the data prior to the split. That is, individuals within each new node are better categorized
regarding their status on a particular outcome. At each node, predictor variables are exhaustively
evaluated on the basis of their potential to improve model purity. If a predictor variable is
identified that improves the purity of the data, a split will be made. Within the second
component, in order to determine whether to terminate or continue splitting a node, various Split #1 0 0 1 1 1 0 0 0 0 0 0 0 0 0 1 Split #1 0 0 1 1 1 0 0 0 0 0 0 0 0 0 1 Split #2 Split #1 Split #2 Root Node Terminal Node (a) (b)
decision tree analyses use differing techniques such as stopping criteria and pruning. Pruning
consists of constructing an overly complex tree and then removing splits to minimize the
estimate of misclassification error, whereas, stopping criteria prevents a tree from
over-developing if a pre-specified standard of model improvement is not achieved. Finally, the third
component is easily accomplished by assigning a terminal node the outcome class that has the
fewest misclassifications within the node (Loh, 2008).
Automatic Interaction Detection (AID). Designed by economists to predict economic
events using a series of indicators, Automatic Interaction Detection (AID; Sonquist, Baker, &
Morgan, 1971) was the first decision tree program ever developed (DeVille & Neville, 2013).
The program was designed around the notion that statistical relationships are dependent on the
context in which they exist, including the influence of other relationships within a model. This
notion inspired researchers to attempt to develop a systematic statistical analysis that could take
into account preceding relationships that could influence the presence and specific qualities of
subsequent relationships. Attempts to design such an analysis led to the formation of decision
trees via successively partitioning data to explore the impact of various categorizations on the
outcome variable. In turn, researchers discovered that decision trees tend to outperform
regression models when dealing with interactions and multicollinearity, both of which are
common issues with regression (DeVille & Neville, 2013).
Although initial AID techniques produced decision trees with greater validity than
regression models and higher levels of interpretability regarding complex interactions, several
problems plagued its use (Doyle, 1973; Kass, 1975). Specifically, exhaustive searches of
potential splits across all predictor variables tended to identify anomalous relationships and be
likelihood of identifying a split that demonstrates differences between groups using a variable
with a greater range of observations (DeVille & Neville, 2013). That is, for example, if
differences in a binary outcome are not found between the values of a dichotomized predictor
variable (i.e., 0 and 1) the search will be terminated, whereas if differences are not found
between the first two values of a continuous predictor variable, the search will continue with that
variable until all values are investigated for differences (e.g., 1 and 2+, 1-2 and 3+, 1-3 and 4+,
etc.).
In response to the shortcomings of AID, Kass (1980) designed Chi-Square Automatic
Interaction Detection (CHAID). CHAID improved upon the procedures used in AID by
incorporating significance testing to ensure that only groups of values that were significantly
different from one another and not due to random chance were included as splits. Furthermore,
CHAID conducted Bonferroni adjustments to avoid biased selection of variables with large
numbers of values. Finally, CHAID terminated the decision tree growth process if significant
differences could not be found between groups, thus eliminating the classification procedure’s tendency to identify anomalous relationships (DeVille & Neville, 2013).
Classification and Regression Trees (CART). Following the development of AID and
CHAID, Classification and Regression Trees (CART; Breiman et al., 1984) were developed.
Similar to AID procedures, CART conducts an exhaustive search of all possible splits across all
predictor variables. Moreover, CART produces fully-grown decision trees with all possible
splits using the Gini index of diversity, which attempts to create maximum homogeneity within
nodes and heterogeneity between nodes. They then undergo a pruning process that balances
misclassification estimates and model complexity (Chien & Chen, 2008). Similar to the critiques