ri g h t © 2 0 1 4 , T h e H e a lt h a n d S o c ia l C a re I n fo rm a ti o n C e n tr e . A ll ri g h ts r e s e rv e d
Children’s body mass
index, overweight
and obesity
Gary Boodhna● There is considerable evidence linking childhood overweight and obesity with a number of long-term and immediate physiological and psychological health risks. This chapter examines the patterns of overweight and obesity among children aged 2-15 in 2013, and the relationship between these measures and a number of demographic variables. Children’s own perceptions of their weight and their parents’ perceptions are also examined.
● In both boys and girls aged 2-15, mean body mass index (BMI) increased with age, from 16.8kg/m2for boys and 16.4kg/m2for girls aged 2-4 to 20.8kg/m2for boys and 22.2kg/m2for girls aged 13-15.
● Among children aged 2-15, 16% of boys and 15% of girls were classed as obese, and 14% of both boys and girls were classed as overweight. Overall 30% of boys and 29% of girls were classed as either overweight or obese.
● Levels of obesity varied according to socio-economic status. Among children aged 2-15, levels of obesity were highest in the lowest quintile of equivalised household income (22% of boys and 21% of girls) compared with those in the highest quintile (7% and 6% respectively). Likewise, the prevalence of obesity was higher among those living in the two most deprived quintiles of the Index of Multiple Deprivation, from 17% to 22% for boys and 16% to 21% for girls.
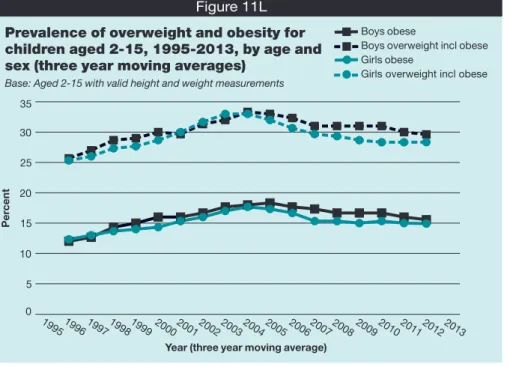
● The prevalence of obesity has increased since 1995, when 11% of boys and 12% of girls aged 2-15 were obese. There was a steady increase up to around 2004 and 2005, where obesity peaked at 18% to 19% among both boys and girls. Levels have been slightly lower than this peak since then. The levels in 2013, at 16% for boys and 15% for girls, were not statistically significantly different from those over the last three or four years.
● There were differences in trends according to age. Among children aged 11-15, the proportion who were obese has remained at a broadly similar level (with some fluctuation) since the peak in 2004/2005. Among those aged 2-10 the proportion who were obese has decreased significantly from 17% of both boys and girls in 2005 to 13% of boys and 12% of girls in 2013.
● When children aged 8-15 were asked about their perception of their weight, 58% of boys and 52% of girls felt that they were about the right weight, while 11% of boys and 15% of girls felt that they were too heavy, and 10% of boys and 4% of girls thought they were too light (21% of boys and 28% of girls were not sure). Just under a quarter of children who thought that they were about the right weight were overweight (15%) or obese (8%).
● The majority of both mothers and fathers of children aged 4-15 thought that their child was about the right weight (80% of mothers, 85% of fathers for boys, and 80% and 78% respectively for girls).
● Most parents who thought their child was about the right weight were correct;
Summary
e H e a lt h a n d S o c ia l C a re I n fo rm a ti o n C e n tr e . A ll ri g h ts r e s e rv e d
however, just under a quarter had a child who was overweight or obese (24% among both mothers and 22% among fathers who thought their child’s weight was ‘about right’).
● The majority of children were not trying to change their weight (71% of boys and 66% of girls). Fewer boys than girls said they were trying to lose weight (20% and 29% respectively), and trying to lose weight was more common among older children for both sexes.
ri g h t © 2 0 1 4 , T h e H e a lt h a n d S o c ia l C a re I n fo rm a ti o n C e n tr e . A ll ri g h ts r e s e rv e d
11.1 Introduction
11.1.1 BackgroundChildhood obesity and its associated risks have been outlined by the government as one of the biggest threats to public health in England.1It continues to provoke national and international concern. Estimates from the Foresight report in 2007, based on HSE data from 1993-2004, suggested that by 2050, 55% of boys and 70% of girls aged under 20 could be overweight or obese.2However, a more recent update on these trends based on HSE data from 2000 to 2007, although not directly comparable, indicated a healthier picture; these suggested that by 2020 13% of boys and 10% of girls aged 2-11 might be obese.3 According to the most recent report on the National Child Measurement Programme (NCMP), based on the 2012/13 school year, over a fifth (22.2%) of children in Reception (aged 4-5 years) were either overweight or obese. This proportion increased to a third (33.3%) for children in Year 6 (aged 10-11years). The percentage of Year 6 children who were classed as obese was more than double that of Reception year children (18.9% and 9.3%).The proportions of overweight and obese children combined in both Reception and Year 6 were lower than in 2011/12. This is the first time since the NCMP began in 2006/07 that overweight and obesity prevalence has reduced for Year 6 children. Data from further years will be required to see if this is the start of a declining trend.4
11.1.2 Government initiatives to tackle obesity
In response to childhood obesity prevalence the National Institute for Health and Care Excellence (NICE) are producing a quality standard covering public health strategies to prevent overweight and obesity as well as interventions for lifestyle management in children and young people aged under 18 years. Several other policies and strategies aimed at tackling obesity have also been introduced over the past few years. These include the White Paper Choosing Health: Making Healthier Choices Easier, which aimed to prevent any further rises in obesity among children under 11.5In November 2010 the government announced an ongoing strategy to improve public health in its White Paper Healthy Lives,
Healthy People: Our Strategy for Public Health in England.1The paper set out key areas to
focus on in its aim to improve the lives of people in England. Included in these was the continued support for school-aged children through the Healthy Child Programme,6and assistance with local services to tackle overweight and obesity through the National Child Measurement Programme.7Following this 2010 white paper, The Public Health
Responsibility Deal8was announced in 2011, with a view to encouraging local businesses and the voluntary sector to support people to live healthier lives by informing their lifestyle choices in areas such as healthy eating and physical activity. Preventative measures were also outlined in the 2009 Change4Life campaign9which focussed on encouraging families to eat healthily and improve levels of physical activity.
In October 2011, these commitments were reinforced by a further pledge to tackle overweight and obesity in the context of the new structure of the NHS and Public Health England. Healthy Lives, Healthy People: a call to action on obesity in England10set out rigorous plans to engage people in healthier lifestyles across all life stages. The degree to which obesity and overweight have become a problem was acknowledged in the paper and recommendations were centred around local and national level partnerships, with a view to reducing excess weight by 2020.
11.1.3 The impact of overweight and obesity
Overweight and obesity are terms that refer to an excess of body fat. Body mass index (BMI) relates to increased weight-for-height and is a frequently used measure of obesity and overweight. The two terms denote different degrees of excess adiposity (body fat), and overweight can be thought of as a stage where an individual is at risk of developing obesity.11The adverse health consequences associated with obesity are mostly related to an increased adiposity rather than increased weight per se12and it is therefore important that any indicator of obesity reflects this increased adiposity.
There is considerable evidence linking obesity with numerous long-term and immediate physiological health risks which highlights the importance of studying early overweight and obesity. Childhood and adolescent obesity can persist into adulthood, where the direct health risks of obesity are severe and well-established. It has been estimated that up to 50% of obese adolescents remain obese in adulthood.13,14Other studies have linked childhood and adolescent overweight and obesity directly to middle-age mortality and a range of chronic diseases in adult life.15,16,17,18,19In addition to the increased risk for health problems in later life, children face immediate health consequences of obesity, including increased risks for an abnormal lipids (fats in blood) profile and elevated blood pressure.20 Associations between childhood obesity and increased asthma prevalence21and the incidence of Type 2 diabetes mellitus22have also been reported.
As well as the physiological health risks that arise as a result of obesity, the psychological effects of obesity are also being increasingly recognised; many of which can continue into adulthood. Studies have shown high levels of dissatisfaction with body size and shape amongst adolescents as well as a desire to be thinner, which increases in line with body mass and is more prevalent among girls.23,24,25Other links to the psychological effects of obesity have been found to include low self esteem or self image,26and depression.27 Symptoms of depression in adolescents have also been linked to higher BMI and low levels of physical activity,24particularly among young women.28
The influence of family is vital to the prevention and treatment of childhood obesity.29Adults play a large role in influencing the content and availability of food, as well as the food choices that children make.30Moreover, studies have highlighted the pattern between the weight status of children and their parents, showing a clear link between the BMI of children and their mother’s BMI.27The need to understand the health consequences of excess weight and to recognise the need for weight management is a pre-requisite for preventing and tackling obesity. Yet evidence suggests that parents who underestimate the weight status of their overweight or obese children may be less likely to provide them with the support they need to achieve a healthy weight.31Studies have shown that, among parents of pre-school children, as many as 90% do not correctly identify their child as overweight when this is the case.32
This chapter examines patterns of obesity and overweight among children aged 2-15, and the relationship between these and demographic and attitude variables. Trend data on key HSE measures, including child obesity, are available in Health Survey for England 2013
trend tables on the Health and Social Care Information Centre website. 33
11.2 Methods and definitions
11.2.1 Methods
Children aged 2-15 had their height and weight measured and BMI was calculated from the valid readings. The calculation uses sex and exact age in six month bands (extracted from the date of interview minus the date of birth). Presentation of the results is based, however, on the age at last birthday, which is the HSE standard. Also in line with the HSE standard for children, none of the results in this chapter have been age-standardised.
Trends from HSE years 1995 to 2013 show BMI, overweight and obesity prevalence calculated for children aged 2-15. Children were first included in the HSE in 1995 and since then weighting has been necessary to compensate for the fact that the number of children interviewed in a household is limited to two (in households with more, two are selected at random). This weighting is used to ensure that the age/sex distribution of selected children matches that of all children in co-operating households. Non-response weighting was also introduced in 2003. The child-selection weighted estimates are shown for 1995-2002 and the non-response weighted estimates (including adjustment for child selection) for
2003-2013. National trend data are presented separately for three age groups: 2-10, 11-15 and e H
e a lt h a n d S o c ia l C a re I n fo rm a ti o n C e n tr e . A ll ri g h ts r e s e rv e d
Questions about children’s perceptions of their own weight and their desire to change their weight have been asked since 2006. Children aged 8-15 were asked as part of a self-completion questionnaire whether or not they thought they were about the right weight and whether they were trying to change their weight. In 2012 and 2013 parents (including legal guardians) of children aged under 16 were asked about their perceptions of their child’s weight. These questions were included in the self-completion booklet for adults, and both mothers and fathers were asked to give their views. This was slightly different from 2011, when (in two parent families) only one parent, usually the mother, was asked about their perception of their child’s weight in a separate booklet relating specifically to the child. Analyses of parents’ perceptions are presented in Tables 11.7-11.9, and it should be noted that there are relatively small numbers of children for whom parent information is also available. Therefore in some cases data for boys and girls have been combined, and margins of error for some of the estimates are wide.
11.2.2 Definitions
Body mass index (BMI), calculated as weight (kg) divided by height squared (m2), has been shown to correlate strongly with adiposity in adults34,35and children.5,36,37It is the key measure of overweight and obesity used in this chapter. The decision to use BMI is supported by recommendations made by the International Obesity Task Force, which concluded that BMI is a reasonable measure of body adiposity in children.38As in previous HSE reports, children’s overweight and obesity prevalence and trends have been produced using the UK National BMI centiles classification.39,40This classification was used to produce obesity trend estimates in the Chief Medical Officer’s 2002 Annual Report.41 Different growth patterns among boys and girls at each age means that a universal
categorisation cannot be used to define childhood overweight and obesity. Overweight and obesity prevalence for children aged 2-15 is therefore estimated using the exact age (categorised in six month bands) and the sex-specific UK National BMI centiles
classification.42,43This classification gives the BMI threshold for each age above which a child is considered overweight or obese. The classification estimates were produced by calculating the proportion of boys and girls who were at or above the 85th (overweight) or 95th (obese) BMI centiles of the 1990 reference population.
11.3 BMI and prevalence of obesity and overweight
11.3.1 BMI, obesity and overweight, by age and sex
Mean body mass index (BMI) was similar for boys and girls aged 2-15, at 18.2 kg/m2and 18.5 kg/m2respectively. As Figure 11A shows, mean BMI increased with age.
16% of boys and 15% of girls aged 2-15 were classed as obese, and 14% of both sexes were overweight. Overall, 30% of boys and 29% of girls were classed as either overweight or obese; the differences between the sexes were not statistically significant. As shown in Figure 11B, the proportion who were obese generally increased with age, though there was less variation by age in the proportion who were overweight. Tables 11.1, 11.2, Figures 11A, 11B
11.3.2 BMI, obesity and overweight prevalence, by equivalised household income
Among children aged 2-15, there was significant variation in the proportion who were obese according to equivalised household income, as shown in Figure 11C. Boys and girls in the lowest quintile were around three times as likely to be obese as those in the highest income
quintile. Table 11.3, Figure 11C
ri g h t © 2 0 1 4 , T h e H e a lt h a n d S o c ia l C a re I n fo rm a ti o n C e n tr e . A ll ri g h ts r e s e rv e d
e H e a lt h a n d S o c ia l C a re I n fo rm a ti o n C e n tr e . A ll ri g h ts r e s e rv e d
Mean body mass index, by age and sex Base: Aged 2-15 with valid height and weight measurements
M e a n B M I ( k g /m 2) Figure 11A 0 5 10 15 20 25 30 Boys Girls 5-7 8-10 2-4 11-12 13-15 Age group
Prevalence of overweight and obesity, by age and sex Base: Aged 2-15 with valid height and weight measurements
P e rc e n t Figure 11B 8-10 2-4 5-7 11-12 13-15 2-4 5-7 8-10 11-12 13-15
Age group Age group
Boys 0 5 10 15 20 25 30 35 40 45 P e rc e n t Girls 0 5 10 15 20 25 30 35 40 45 Overweight Obese
Prevalence of overweight and obesity, by equivalised household income and sex Base: Aged 2-15 with valid height and weight measurements
P e rc e n t Figure 11C 3rd
Highest 2nd 4th Lowest Highest 2nd 3rd 4th Lowest
Equivalised household income quintile Equivalised household income quintile
Boys 0 5 10 15 20 25 30 35 40 45 P e rc e n t Girls 0 5 10 15 20 25 30 35 40 45 Overweight Obese
11.3.3 BMI, obesity and overweight prevalence, by Index of Multiple Deprivation (IMD)
The impact of area deprivation was examined by looking at mean BMI and obesity prevalence by quintiles of the Index of Multiple Deprivation (IMD). Following a similar pattern to household income, levels of obesity were considerably higher for both boys and girls in the two most deprived quintiles compared with those in less deprived quintiles (see Figure 11D).
There was a similar pattern of significant variation by IMD quintiles in mean BMI, with higher
mean BMI in more deprived areas. Table 11.4, Figure 11D
11.4 Child and parent perceptions of weight
11.4.1 Child perceptions of their own weight
In the self completion booklet, children aged 8-15 were asked about their perception of their own weight. Parents of children aged under 16 were also asked about their perceptions of their child’s weight in a self-completion booklet.
More than half of boys and girls aged 8-15 thought that they were about the right weight (58% and 52% respectively). 11% of boys and 15% of girls thought they were too heavy, while 10% of boys and 4% of girls thought they were too light. A substantial proportion of children were not sure whether they were about the right weight (21% of boys and 28% of girls). Figure 11E shows the results among younger and older children. While the pattern was broadly similar across the age groups, a higher proportion of those aged 11-15 than 8-10 thought that they were too heavy.
The mean BMI of children aged 8-15 who thought they were about the right weight was 18.8kg/m2, compared with 26.2kg/m2for those who thought they were too heavy. The majority of children who thought they were too heavy were obese or overweight. Just under a quarter of children who thought that they were about the right weight were overweight or
obese (see Figure 11F). Tables 11.5, 11.6, Figures 11E, 11F
11.4.2 Parent perceptions of their child’s weight
The majority of both mothers and fathers of children aged 4-15 thought that their child was about the right weight (80% of mothers, 85% of fathers for boys, and 80% and 78% respectively for girls). Few parents of children in this age group thought that their child was too heavy (8% of mothers and 5% of fathers for boys, and 12% and 15% respectively for
ri g h t © 2 0 1 4 , T h e H e a lt h a n d S o c ia l C a re I n fo rm a ti o n C e n tr e . A ll ri g h ts r e s e rv e d
Prevalence of overweight and obesity, by Index of Multiple Deprivation and sex
Base: Aged 2-15 with valid height and weight measurements
P e rc e n t Figure 11D 3rd Least deprived 2nd 4th Most deprived 3rd Least
deprived 2nd 4th deprivedMost
Index of Multiple Deprivation quintile Index of Multiple Deprivation quintile Boys 0 5 10 15 20 25 30 35 40 45 P e rc e n t Girls 0 5 10 15 20 25 30 35 40 45 Overweight Obese
girls). Perceptions varied between older and younger children, with a higher proportion of both parents likely to think children aged 11-15 were too heavy than children aged 4-10, as shown in Figures 11G and 11H.
In cases where parents thought that their child was about the right weight, the mean BMI of the children was 18.0/m2(mothers) and 17.80/m2(fathers). In the majority of cases where parents thought their child was too heavy, the child was in fact overweight or obese, as shown in Figure 11I. Most parents who thought their child was about the right weight were correct; however, just under a quarter in this group had a child who was overweight or obese.
Parent perceptions so far have been presented for children aged 4-15. An additional table is provided which shows parental perceptions for the 8-15 age group (Table 11.9), with results therefore for the same age group as for children’s own perceptions in Table 11.6. The patterns in mothers’ and fathers’ perceptions of their child’s weight were very similar for the
4-15 and 8-15 age groups. Tables 11.7-11.9, Figures 11G – 11I
e H e a lt h a n d S o c ia l C a re I n fo rm a ti o n C e n tr e . A ll ri g h ts r e s e rv e d
Child’s perception of own weight, by age and sex
Base: Aged 8-15 with valid height and weight measurements
P e rc e n t Figure 11E 0 10 20 30 40 50 60 70 80 90 100 8-10 11-15 8-10 11-15 Don’t know Too light Too heavy
About the right weight
Age group Age group
Boys Girls
Child’s body mass index status, by perception of own weight Base: Aged 8-15 with valid height and weight measurements P e rc e n t Figure 11F
Too light About the right weight Too heavy Child’s perception of own weight 0 10 20 30 40 50 60 70 80 90 100 Obese Overweight Neither overweight or obese
ri g h t © 2 0 1 4 , T h e H e a lt h a n d S o c ia l C a re I n fo rm a ti o n C e n tr e . A ll ri g h ts r e s e rv e d
Mother’s perception of child’s weight, by child's age and sex
Base: Aged 4-15 with valid height and weight measurements
P e rc e n t Figure 11G 0 10 20 30 40 50 60 70 80 90 100 4-10 11-15 4-10 11-15 Too light Too heavy
About the right weight
Age group Age group
Boys Girls
Father's perception of child's weight, by child’s age and sex
Base: Aged 4-15 with valid height and weight measurements
P e rc e n t Figure 11H 0 10 20 30 40 50 60 70 80 90 100 4-10 11-15 4-10 11-15 Too light Too heavy
About the right weight
Age group Age group
Boys Girls
Child’s body mass index status, by parents’ perception of child’s weight
Base Aged 4-15 with valid height and weight measurements
P e rc e n t Figure 11I 0 10 20 30 40 50 60 70 80 90 100 Mother
Too light About the right weight Too heavy
Father Mother Father Mother Father
Parents’ perception of child’s weight
Obese Overweight Neither overweight or obese
11.4.3 Children trying to change weight
The majority of children were not trying to change their weight (71% of boys and 66% of girls). Fewer boys than girls said they were trying to lose weight (20% and 29%
respectively), and trying to lose weight was more common among older children for both sexes, as shown in Figure 11J.
The mean BMI of children trying to lose weight was 23.6kg/m2, compared with 16.7 kg/m2 for those trying to gain weight and 18.8kg/m2for those who were not trying to change their weight. .Among those who were trying to lose weight 24% were overweight and 47% were obese, while 29% were neither overweight nor obese (see Figure 11K).
Tables 11.10, 11.11, Figures 11 J, 11K e H e a lt h a n d S o c ia l C a re I n fo rm a ti o n C e n tr e . A ll ri g h ts r e s e rv e d
Desire to change weight, by age and sex
Base: Aged 8-15 with valid height and weight measurements
P e rc e n t Figure 11J 0 10 20 30 40 50 60 70 80 90 100 8-10 11-15 8-10 11-15
Trying to gain weight Trying to lose weight Not trying to lose weght
Age group Age group
Boys Girls
Body mass index status, by desire to change weight
Base: Aged 8-15 with valid height and weight measurements P e rc e n t Figure 11K Not trying to
change Trying to loseweight
Trying to gain weight Desire to change weight
0 10 20 30 40 50 60 70 80 90 100 Obese Overweight Neither overweight or obese
11.5 Trends in BMI, overweight and obesity
Mean BMI increased between 1995 and 2013 by 0.5kg/m2among boys aged 2-15 (from 17.7kg/m2to 18.2kg/m2), and by 0.4kg/m2for girls (from 18.1kg/m2to 18.5kg/m2). With fluctuations from year to year, overall increases in mean BMI were evident for both sexes during this period, although for the last few years mean BMI has been slightly lower than the peak around 2004/2005.
Figure 11L shows three-year moving averages from 1995 to 2013 for children aged 2-15 who were obese, and overweight including obese. Childhood obesity in England has increased significantly since 1995, when 11% of boys and 12% of girls were obese. The prevalence of obesity increased steadily in most years up to around 2004 and 2005, where it peaked at 18% to 19% among both boys and girls. Levels have been slightly lower than this peak in the last few years. The levels in 2013, at 16% for boys and 15% for girls, were not statistically significantly different from those over the last three or four years. It should be noted that bases for the last three years are smaller in the absence of a child boost, and margins of error are therefore wider. It will be important to continue to monitor the trends in future, using HSE data to confirm whether this is the beginning of a gradual downward shift or simply fluctuation in the flattening trend.
The proportion of children who were overweight varied less over the period than the proportion who were obese. While there has been a slight increase overall, there have been fluctuations from year to year. Changes in the proportion who were overweight including obese have therefore closely followed the pattern of changes in the proportion who were obese.
There were differences in trends according to age. Figure 11M shows, for the period from 1995 to 2013, the proportion of children aged 2-10 and 11-15 who were obese. Among both age groups and both sexes, there was a similar pattern of increase up to the peak around 2004/2005; since then the proportion who were obese in the 11-15 age group has remained at a broadly similar level (with some fluctuation) among both boys and girls. Among those aged 2-10 the proportion who were obese has decreased from between 2005
and 2013. Tables 11.12-11.14, Figures 11L, 11M
ri g h t © 2 0 1 4 , T h e H e a lt h a n d S o c ia l C a re I n fo rm a ti o n C e n tr e . A ll ri g h ts r e s e rv e d
Prevalence of overweight and obesity for children aged 2-15, 1995-2013, by age and sex (three year moving averages)
Base: Aged 2-15 with valid height and weight measurements
P e rc e n t Figure 11L 0 5 10 15 20 25 30 35 Boys obese
Boys overweight incl obese Girls obese
Girls overweight incl obese
1995199619971998199920002001200220032004200520062007200820092010201120122013 Year (three year moving average)
11.6 Discussion
The findings presented in this chapter showed similar overall BMI for boys and girls aged 2-15. Mean BMI varied across age groups, being lower among younger children and
increasing in older children. Consistent with previous years, children aged 11-15 were more likely to be overweight or obese than younger children aged 2-10.
As with previous HSE findings, inequalities in obesity prevalence were evident by
equivalised household income for children. For both boys and girls, prevalence of obesity was around three times higher in the lowest income quintile than the highest quintile. This reflects the pattern among adults (see Chapter 10), with prevalence of obesity being higher in the lowest two income quintiles for both men and women. In 2013, obesity prevalence was also generally higher among children living in the more deprived areas of England. This disparity between higher and lower income families is a recognised issue amongst policy makers and has been acknowledged by the government’s white paper A Call to Action on
Obesity in England,10which set out to focus on combatting inequalities, and improving the
health of the poorest as a matter of most immediate concern.
Trends over time show that there has been little significant change in the levels of obesity over the last few years among children aged 11-15, after steady increase between 1995 and the early 2000s. However, there has been a significant decrease in the proportion of children aged 2-10 that were obese, from 17% of both boys and girls in 2005 to 13% of boys and 12% of girls in 2013. Nevertheless, there remained a substantial proportion of children aged 8-15 – just under a quarter - who misjudged their weight, considering themselves to be about the right when in fact they were overweight or obese. Correspondingly, 29% of children who reported that they were trying to lose weight were neither overweight nor obese. These findings point towards the need for increased awareness and understanding of what a healthy weight is. Initiatives such as the Healthy Schools Programme44which includes a toolkit to help schools deliver information about health and healthy lifestyles, may play an important role in providing information on healthy choices to children. Just as it is important for a child to be accurate in perceiving their own weight, accuracy among parents is similarly important, since they play an essential part in guiding their child’s behaviours and attitudes towards healthy weight management.26,29According to previous studies,31,45parents of overweight and obese children often do not accurately perceive their
child’s weight status. Since 2011parents interviewed in the HSE have been asked about e H
e a lt h a n d S o c ia l C a re I n fo rm a ti o n C e n tr e . A ll ri g h ts r e s e rv e d
Prevalence of obesity from 1995 to 2013 Base: Aged 2-15 with valid height and weight measurements
P e rc e n t Figure 11M Boys 0 5 10 15 20 25 30 1997 1995 1999 2001 2003 2005 2007 2009 2011 2013 Year P e rc e n t Girls 0 5 10 15 20 25 30 1997 1995 1999 2001 2003 2005 2007 2009 2011 2013 Year Aged 2-10 Aged 11-15
obese. Although base sizes in the HSE are not large enough to detect different patterns between boys and girls, findings from previous studies have indicated that parents of obese and overweight boys were more likely to perceive their child’s weight status inaccurately than parents of obese or overweight girls.46,47Information and guidance for parents is needed to improve understanding and lead to more accurate perceptions of their children’s needs. Campaigns such as Change4Life9can play a role in this, providing parents with information about healthy eating and the importance of physical activity.
References and notes
1 Department of Health. Healthy Lives, Healthy People: Our Strategy for Public Health in England. HMSO, London, 2010.
www.gov.uk/government/publications/healthy-lives-healthy-people-our-strategy-for-public-health-in-england
2 Foresight. Tackling Obesities: Future Choices – Project report. Government Office for Science, 2007. http://webarchive.nationalarchives.gov.uk/+/www.dh.gov.uk/en/Publichealth/Healthimprovement/Obesi ty/DH_079713
3 McPherson K, Brown M, Marsh T, Byatt T. Obesity: Recent Trends in Children Aged 2-11y and 12-19y.
Analysis from the Health Survey for England 1993 – 2007. National Heart Forum, 2009.
4 Health and Social Care Information Centre. National Child Measurement Programme: England, 2012/13
school year. HSCIC, Leeds, 2013.
http://www.hscic.gov.uk/catalogue/PUB13115/nati-chil-meas-prog-eng-2012-2013-rep.pdf 5 Department of Health. Choosing Health: Making Healthier Choices Easier. HMSO, London, 2004.
http://webarchive.nationalarchives.gov.uk/+/dh.gov.uk/en/publicationsandstatistics/publications/public ationspolicyandguidance/dh_4094550
6 Department of Health. Healthy Child Programme from 5 to 19 years old. DH, London, 2009.
http://webarchive.nationalarchives.gov.uk/20130107105354/http://www.dh.gov.uk/en/Publicationsands tatistics/Publications/PublicationsPolicyAndGuidance/DH_107566
7 Health and Social Care Information Centre. National Child Measurement Programme. HSCIC, Leeds, 2010.
www.hscic.gov.uk/ncmp
8 Public Health Responsibility Deal. Department of Health, 2011. https://responsibilitydeal.dh.gov.uk/
9 Change4Life. Department of Health, 2009. www.nhs.uk/Change4Life
10 Department of Health. Healthy Lives, Healthy People: A call to action on obesity in England. HMSO, London, October 2011.
www.gov.uk/government/publications/healthy-lives-healthy-people-a-call-to-action-on-obesity-in-england
11 Barlow S, Dietz WH. Obesity evaluation and treatment: expert committee recommendations. Paediatrics 1998;102:E29.
12 Taylor RW, Jones IE, Williams SM, Goulding A. Body fat percentages measured by dual-energy X-ray
absorptiometry corresponding to recently recommended body mass index cutoffs for overweight and obesity in children and adolescents aged 3-18y. American Journal of Clinical Nutrition
2002;76:1416-1421.
13 Steinbeck K. The importance of physical activity in the prevention of overweight and obesity in childhood:
a review and an opinion. Obesity Reviews 2001;2:117-130.
14 Greater London Authority. Childhood obesity in London, 2011. www.london.gov.uk/sites/default/files/glae-childhood-obesity.pdf
15 Lew EA, Garfinkel L. Variations in mortality by weight among 750,000 men and women. Journal of Chronic Disease 1978;32:563-565.
16 Rhoads GG, Kagan A. The relation of coronary-disease, stroke, and mortality to weight in youth and in
middle-age. Lancet 1983;1:492-495.
17 Gunnell D, Frankel S, Nanchahal K, Peters TJ, Smith GD. Childhood obesity and adult cardiovascular
mortality: a 57-y follow-up study based on the Boyd Orr cohort. American Journal of Clinical
Nutrition1998;67:1111-18.
18 Must A, Jacques PF, Dallal GE, Bajema CJ, Dietz WH. Long-term morbidity and mortality of overweight
adolescents – a follow-up of the Harvard growth study of 1922 to 1935. New England Journal of
Medicine 1992;327:1350-55.
19 Engeland A, Bjorge T, Sogaard AJ, Tverdal A. Body mass index in adolescence in relation to total
mortality: 32-year follow-up of 227,000 Norwegian boys and girls. American Journal of Epidemiology
2003;157:517-523. ri g h t © 2 0 1 4 , T h e H e a lt h a n d S o c ia l C a re I n fo rm a ti o n C e n tr e . A ll ri g h ts r e s e rv e d
20 Freedman D, Dietz WH, Srinivasan S, Berenson GS. The relation of overweight to cardiovascular risk
factors among children and adolescents: The Bogalusa Heart Study. Pediatrics, 1999;103:1175-1182.
21 von Mutius E, Schwartz J, Neas LM, Dockery D, Weiss ST. Relation of body mass index to asthma and
atopy in children: the National Health and Nutrition Examination Study III. Thorax 2001;56:835-838.
22 Fagot-Campagna A, Pettitt DJ, Engelgau MM, Burrows NR et al. Type 2 diabetes among North American
children and adolescents: an epidemiological review and a public health perspective. Journal of
Pediatrics 2000;136:664-672.
23 Braet C, Wydhooge K. Dietary restraint in normal weight and overweight children. A cross-sectional study. International Journal of Obesity 2000:24:314-318.
24 Hill AJ, Draper E, Stack J. A weight on children’s minds: body shape dissatisfactions at 9-years old. International Journal of Obesity 1994;18:383-389.
25 Gustafson-Larson AM, Terry RD. Weight-related behaviours and concerns of fourth-grade children. Journal of American Dietectic Association 1992;92:818-822.
26 Cornette R. The emotional impact of obesity on children. Worldviews on Evidence-Based Nursing 2008;5(3):136-41.
27 Sjoberg RL. Obesity, Shame, and Depression in School-Aged Children: A Population-Based Study. Paediatrics 2005;116(3):389-92.
28 Ball K, Burton NW, Brown WJ. A prospective study of overweight, physical activity, and depressive
symptoms in young women. Obesity 2009;1791:66-71.
29 Dietz WH, Gortmaker, SL. Preventing obesity in children and adolescents. Annual Review of Public Health 2001;22:337-353.
30 Johannsen DL, Johannsen NM, Specker BL. Influence of Parents’ Eating Behaviors and Child Feeding
Practices on Children's Weight Status. Obesity 2006;14;431–439.
31 Carnell S, Edwards C, Croker H et al. Parental perceptions of overweight in 3-5y olds. International Journal of Obesity 2005;29:353-355.
32 Baughcum AE, Chamberlin LA, Deeks CM, Powers SW, Whittaker RC. Maternal perceptions of
overweight preschool children. Paediatrics 2000;106;1380-1386.
33 www.hscic.gov.uk/pubs/hse2013trend
34 Russell-Aulet M, Wang J, Thornton J, Pierson RN. Comparison of Dual-Photon Absorptiometry systems
for total-body bone and soft-tissue measurements: dual-energy X-rays versus Gd-153. Journal of Bone
and Mineral Research 1991;6:411-415.
35 Fernandez JR, Heo M, Heymsfield SB et al. Is percentage body fat differentially related to body mass
index in Hispanic Americans, African Americans, and European Americans? American Journal of Clinical
Nutrition 2003;77:71-75.
36 Lindsay RS, Hanson RL, Roumain J, Ravussin E, Knowler WC, Tataranni PA. Body mass index as a
measure of adiposity in children and adolescents: relationship to adiposity by dual energy X-ray absorptiometry and to cardiovascular risk factors. The Journal of Clinical Endocrinology and Metabolism
2001;86:4061-67.
37 Pietrobelli A, Faith MS, Allison DB, Gallagher D, Chiumello G, Heymsfield SB. Body mass index as a
measure of adiposity among children and adolescents: a validation study. Journal of Pediatrics
1998;132:204-210.
38 Bellizzi MC, Dietz WH. Workshop on childhood obesity: summary of the discussion. American Journal of Clinical Nutrition 1999;70:173S-175.
39 Cole TJ, Freeman JV, Preece MA. Body mass index reference curves for the UK, 1990. Archives of Disease in Childhood 1995;73:25-29.
40 Scholes S, Heeks F. BMI, overweight and obesity. Chapter 2 in Craig R, Mindell J (eds). Health Survey for
England 2006. Volume 2: Obesity and other risk factors in children. Health and Social Care Information
Centre, Leeds, 2008.
www.hscic.gov.uk/pubs/hse06cvdandriskfactors
41 Chief Medical Officer of England. Annual Report 2002. Department of Health, London, 2003.
http://webarchive.nationalarchives.gov.uk/+/www.dh.gov.uk/en/PublicationsAndStatistics/Publications/ AnnualReports/DH_4006432
42 There is no generally agreed definition of childhood obesity, but there are two widely used indicators: the International Classification, based on reference points derived from an international survey; and the UK National Body Mass Index centile classification, based on the UK 1990 reference curves (as used in this report). Although the figures produced by the two different definitions differ considerably (obesity estimates derived using the National Body Mass Index centile classification are much higher than those derived by the international classification), the overall trends are not affected by the definition used. 43 Stamatakis E. Anthropometric measures, overweight, and obesity. Chapter 9 in Sproston K, Primatesta P
(eds). Health Survey for England 2002. The Stationery Office, London, 2003.
e H e a lt h a n d S o c ia l C a re I n fo rm a ti o n C e n tr e . A ll ri g h ts r e s e rv e d
44 Healthy Schools Programme.
http://webarchive.nationalarchives.gov.uk/20130123124929/http://education.gov.uk/schools/pupilsupp ort/pastoralcare/a0075278/healthy-schools
45 Huang JS, Donohue M, Becerra K, Xu R. Relationship between parents’ and children’s weight
perceptions. Results of a survey. Infant, Child & Adolescent Nutrition 2009:1(1);15-20.
46 Jeffery AN, Voss LD, Metcalf BS, Alba S, Wilkin TJ. Parents’ awareness of overweight in themselves and
their children: cross sectional study within a cohort (EarlyBird 21). BMJ 2005:330;23-24.
47 O La De A, Jordan CK, Ortiz K et al. Do parents accurately perceive their child’s weight status? Journal of Paediatric Health Care 2009:23(4);216-221.
ri g h t © 2 0 1 4 , T h e H e a lt h a n d S o c ia l C a re I n fo rm a ti o n C e n tr e . A ll ri g h ts r e s e rv e d
e H e a lt h a n d S o c ia l C a re I n fo rm a ti o n C e n tr e . A ll ri g h ts r e s e rv e d Tables
11.1 Body mass index (BMI), by age and sex
11.2 Overweight and obesity prevalence, by age and sex
11.3 Body mass index (BMI), overweight and obesity prevalence, by equivalised household income and sex
11.4 Body mass index (BMI), overweight and obesity prevalence, by Index of Multiple Deprivation (IMD) and sex
11.5 Child’s perception of own weight, by age and sex
11.6 Body mass index (BMI), overweight and obesity prevalence, by child’s perception of own weight 11.7 Parents’ perception of child’s weight, by child’s
age and sex
11.8 Body mass index (BMI), overweight and obesity prevalence, by parent perception of child’s weight, children aged 4-15
11.9 Body mass index (BMI), overweight and obesity prevalence, by parent perception of child’s weight, children aged 8-15
11.10 Desire to change weight, by age and sex 11.11 Body mass index (BMI), overweight and obesity
prevalence, by desire to change weight 11.12 Trends in body mass index (BMI), overweight
and obesity prevalence among children aged 2-15, 1995-2013, by sex
11.13 Trends in body mass index (BMI), overweight and obesity prevalence among children aged 2-10, 1995-2013, by sex
11.14 Trends in body mass index (BMI), overweight and obesity prevalence among children aged 11-15, 1995-2013, by sex
Notes on the tables
1. The group on which the figures in the table are based is stated at the upper left corner of the table.
2. The data in most tables have been weighted. See Volume 2, Chapter 7 of this report for more detail. Both unweighted and weighted sample sizes are shown at the foot of each table. 3. The following conventions have been used in tables:
- no observations (zero value)
0 non-zero values of less than 0.5% and thus rounded to zero [ ] used to warn of small sample bases, if the unweighted base is less than 50. If a group’s unweighted base is less than 30, data are normally not shown for that group.
4. Because of rounding, row or column percentages may not add exactly to 100%.
5. ‘Missing values’ occur for several reasons, including refusal or inability to answer a particular question; refusal to co-operate in an entire section of the survey (such as the nurse visit or a self-completion questionnaire); and cases where the question is not applicable to the participant. In general, missing values have been omitted from all tables and analyses.
ri g h t © 2 0 1 4 , T h e H e a lt h a n d S o c ia l C a re I n fo rm a ti o n C e n tr e . A ll ri g h ts r e s e rv e d Table 11.1
Body mass index (BMI), by age and sex
Aged 2-15 with valid height and weight measurements 2013 Age group Total
2-4 5-7 8-10 11-12 13-15
Boys
Mean 16.8 16.4 17.7 19.5 20.8 18.2
Standard error of the mean 0.18 0.18 0.28 0.48 0.39 0.15
5th percentilea 14.4 14.0 14.3 14.4 16.3 14.4 10th percentile 14.9 14.0 14.7 15.2 16.8 14.9 15th percentile 15.2 14.4 14.9 15.9 17.1 15.2 Median 16.5 16.0 16.9 19.0 19.6 17.2 85th percentile 18.0 18.0 19.9 23.1 24.3 21.5 90th percentile 18.4 18.8 21.9 24.1 25.2 23.1 95th percentile 19.5 20.1 24.8 28.2 30.1 25.0 Girls Mean 16.4 16.4 17.9 20.2 22.2 18.5
Standard error of the mean 0.15 0.19 0.25 0.42 0.37 0.18
5th percentilea 14.3 14.1 14.3 15.8 16.4 14.4 10th percentile 14.5 14.4 14.7 16.4 17.6 14.7 15th percentile 14.7 14.5 15.1 17.0 18.2 15.2 Median 16.2 16.0 17.3 19.6 21.3 17.5 85th percentile 17.9 18.5 21.1 23.0 26.4 22.0 90th percentile 18.4 19.0 21.8 23.9 28.1 23.7 95th percentile 19.1 20.4 23.4 29.8 30.8 25.9 Bases (unweighted) Boys 158 152 163 105 148 726 Girls 154 151 150 113 157 725 Bases (weighted) Boys 142 153 159 102 171 727 Girls 145 148 140 108 148 689 a
Percentiles show a set of points within a scale from 1-100 which is divided into groups based on order of magnitude. For example, the group of those with a mean BMI that is equal to or less than the value of 5% of those who have valid height and weight measurements is expressed as the 5th percentile.
e H e a lt h a n d S o c ia l C a re I n fo rm a ti o n C e n tr e . A ll ri g h ts r e s e rv e d Table 11.2
Overweight and obesity prevalence, by age and sex
Aged 2-15 with valid height and weight measurements 2013 Age group Total
2-4 5-7 8-10 11-12 13-15
% % % % % %
Boys
Overweighta,b 17 9 15 13 17 14
Obesea,b 9 14 16 26 17 16
Overweight including obese 25 23 31 39 34 30
Girls
Overweighta,b 12 14 12 17 17 14
Obesea,b 9 11 16 16 22 15
Overweight including obese 22 25 28 33 39 29 Bases (unweighted) Boys 158 152 163 105 148 726 Girls 154 151 150 113 157 725 Bases (weighted) Boys 142 153 159 102 171 727 Girls 145 148 140 108 148 689
a Categories are mutually exclusive, i.e. overweight does not include those who are obese.
b Overweight was defined as at or above the 85th but below the 95th UK National BMI centile; obese was defined as at or above the 95th UK National BMI centile.
BMI status
Table 11.3
Body mass index (BMI), overweight and obesity prevalence, by equivalised household income and sex
Aged 2-15 with valid height and weight measurements 2013 Equivalised household income quintile
Highest 2nd 3rd 4th Lowest
Boys
Mean BMI 17.4 17.6 18.3 18.1 18.7
Standard error of the mean 0.28 0.31 0.39 0.35 0.38
Median BMI 16.7 16.7 17.1 17.3 17.5
% overweighta,b 10 12 10 16 16
% obesea,b 7 10 16 14 22
% overweight including obese 17 22 26 30 38
Girls
Mean BMI 17.5 18.3 18.2 19.2 19.2
Standard error of the mean 0.32 0.30 0.30 0.43 0.49
Median BMI 16.6 17.4 17.2 18.0 17.8
% overweighta,b 11 14 12 23 14
% obesea,b 6 11 13 17 21
% overweight including obese 16 25 25 40 35 Bases (unweighted) Boys 83 122 133 112 180 Girls 100 119 139 127 154 Bases (weighted) Boys 77 120 137 114 182 Girls 92 107 136 126 146 a BMI (kg/m2) and BMI status
ri g h t © 2 0 1 4 , T h e H e a lt h a n d S o c ia l C a re I n fo rm a ti o n C e n tr e . A ll ri g h ts r e s e rv e d Table 11.4
Body mass index (BMI), overweight and obesity
prevalence, by Index of Multiple Deprivation (IMD)a
and sex
Aged 2-15 with valid height and weight measurements 2013 IMD quintile
Least 2nd 3rd 4th Most
deprived deprived
Boys
Mean BMI 17.7 18.0 18.7 18.0 18.6
Standard error of the mean 0.28 0.29 0.43 0.32 0.37
Median BMI 16.9 17.2 17.3 17.0 17.5
% overweightb,c 14 15 17 8 16
% obeseb,c 8 12 18 17 22
% overweight including obese 23 28 34 26 38
Girls
Mean BMI 18.1 18.2 18.4 18.6 19.4
Standard error of the mean 0.27 0.37 0.30 0.34 0.56
Median BMI 17.2 17.4 17.7 17.5 17.9
% overweightb,c 10 11 16 17 17
% obeseb,c 9 12 15 16 21
% overweight including obese 20 23 30 33 38 Bases (unweighted) Boys 136 140 143 148 159 Girls 157 131 151 136 150 Bases (weighted) Boys 136 143 146 143 160 Girls 146 125 146 128 145 a
The Index of Multiple Deprivation 2010 (IMD) combines a number of indicators, chosen to cover a range of economic, social and housing issues, into a single deprivation score at the small area level in England.
b
Categories are mutually exclusive, i.e. overweight does not include those who are obese.
c
Overweight was defined as at or above the 85th but below the 95th UK National BMI centile; obese was defined as at or above the 95th UK National BMI centile.
BMI (kg/m2) and
BMI status
Table 11.5
Child’s perception of own weight, by age and sex
Aged 8-15 2013 Age group Total
8-10 11-15
% % %
Boys
About the right weight 60 56 58
Too heavy 6 13 11
Too light 11 10 10
Don’t know 23 21 21
Girls
About the right weight 52 53 52
Too heavy 6 20 15 Too light 5 4 4 Don’t know 37 24 28 Bases (unweighted) Boys 161 257 418 Girls 151 281 432 Bases (weighted) Boys 160 273 434 Girls 137 266 403 Child’s perception of own weight
e H e a lt h a n d S o c ia l C a re I n fo rm a ti o n C e n tr e . A ll ri g h ts r e s e rv e d Table 11.6
Body mass index (BMI), overweight and obesity prevalence, by child’s perception of own weight
Aged 8-15 with valid height and
weight measurements 2013 Child’s perception of own weight
About Too Too
the right heavy light
weight
Mean BMI 18.8 26.2 16.3
Standard error of the mean 0.15 0.54 0.25
Median BMI 18.5 24.7 16.3
% neither overweight or obese 76 14 97
% overweighta,b 15 18 3
% obesea,b 8 68
-% overweight including obese 24 86 3 Bases (unweighted) 424 102 52 Bases (weighted) 418 98 57
a Categories are mutually exclusive, i.e. overweight does not include those who are obese.
b Overweight was defined as at or above the 85th but below the 95th UK National BMI centile; obese was defined as at or above the 95th UK National BMI centile.
BMI (kg/m2) and
BMI status
Table 11.7
Parent perception of child’s weight, by child’s age and sex
Parents of children aged 4-15 with valid height and
weight measurements 2013 Mother’s Father’s
perception perception
Child’s age Total Child’s age Total
group group
4-10 11-15 4-10 11-15
% % % % % %
Boys
About the right weight 86 72 80 88 82 85
Too heavy 4 14 8 2 9 5
Too light 10 13 12 9 9 9
Girls
About the right weight 84 74 80 80 76 78
Too heavy 9 17 12 11 19 15 Too light 7 9 8 9 5 7 Bases (unweighted) Boys 300 209 509 193 126 319 Girls 300 217 517 196 143 339 Bases (weighted) Boys 300 217 517 164 118 282 Girls 282 205 487 162 120 282 Parent perception of child’s weight Table 11.8
Body mass index (BMI), overweight and obesity prevalence, by parent perception of child’s weight, children aged 4-15
Parents of children aged 4-15 with valid height and weight measurements 2013 Mother’s perception Father’s perception
About Too Too About Too Too
the right heavy light the right heavy light
weight weight
Mean BMI 18.0 25.3 16.4 17.8 [24.9] [15.8]
Standard error of the mean 0.13 0.64 0.25 0.15 [0.66] [0.30]
Median BMI 17.3 23.7 16.0 17.2 [24.6] [15.3]
% neither overweight or obese 76 6 95 79 [5] [98]
% overweighta,b 16 11 2 15 [14] [0]
% obesea,b 9 83 3 6 [81] [2]
% overweight including obese 24 94 5 22 [95] [2] Bases (unweighted) 693 81 81 433 48 45 Bases (weighted) 673 80 85 449 51 47
a Categories are mutually exclusive, i.e. overweight does not include those who are obese.
b Overweight was defined as at or above the 85th but below the 95th UK National BMI centile; obese was defined as at or above the 95th UK National BMI centile.
[ ] Results in brackets should be treated with caution because of the small base size.
BMI (kg/m2) and BMI
ri g h t © 2 0 1 4 , T h e H e a lt h a n d S o c ia l C a re I n fo rm a ti o n C e n tr e . A ll ri g h ts r e s e rv e d Table 11.9
Body mass index (BMI), overweight and obesity prevalence, by parent perception of child’s weight, children aged 8-15
Parents of children aged 8-15 with valid height and weight measurements 2013 Mother’s perception Father’s perception
About Too Too About Too Too
the right heavy light the right heavy light
weight weight
Mean BMI 19.0 26.4 16.9 18.6 [26.0] [16.2]
Standard error of the mean 0.17 0.66 0.29 0.19 [0.65] [0.38]
Median BMI 18.4 25.0 16.4 18.1 [25.5] [15.9]
% neither overweight or obese 75 4 95 78 [6] [97]
% overweighta,b 17 9 1 16 [14]
-% obesea,b 8 87 4 6 [81] [3]
% overweight including obese 25 96 5 22 [94] [3] Bases (unweighted) 436 68 64 278 40 33 Bases (weighted) 427 67 68 292 42 36
a
Categories are mutually exclusive, i.e. overweight does not include those who are obese. b
Overweight was defined as at or above the 85th but below the 95th UK National BMI centile; obese was defined as at or above the 95th UK National BMI centile.
[ ] Results in brackets should be treated with caution because of the small base size.
BMI (kg/m2) and BMI
status
Table 11.10
Desire to change weight, by age and sex
Aged 8-15 2013 Age group Total
8-10 11-15
% % %
Boys
Not trying to change weight 76 68 71
Trying to lose weight 13 24 20
Trying to gain weight 10 9 9
Girls
Not trying to change weight 73 63 66
Trying to lose weight 20 33 29
Trying to gain weight 8 4 5
Bases (unweighted) Boys 163 254 417 Girls 151 282 433 Bases (weighted) Boys 162 271 433 Girls 137 266 404 Desire to change weight Table 11.11
Body mass index (BMI), overweight and obesity prevalence, by desire to change weight
Aged 8-15 with valid height and weight measurements 2012 Desire to change weight
Not Trying Trying
trying to to
to lose gain
change weight weight
Mean BMI 18.8 23.6 16.7
Standard error of the mean 0.15 0.31 0.35
Median BMI 18.2 22.9 16.4
% neither overweight or obese 76 29 92
% overweighta,b 13 24 5
% obesea,b 11 47 3
% overweight including obese 24 71 8 Bases (unweighted) 516 198 55 Bases (weighted) 516 186 56
a
Categories are mutually exclusive, i.e. overweight does not include those who are obese.
b
Overweight was defined as at or above the 85th but below the 95th UK National BMI percentile; obese was defined as at or above the 95th UK National BMI percentile.
BMI (kg/m2) and BMI
e H e a lt h a n d S o c ia l C a re I n fo rm a ti o n C e n tr e . A ll ri g h ts r e s e rv e d
Trends in body mass index (BMI), overweight and obesity prevalence among children aged 2-15, 1995-2013, by sex
Aged 2-15 with valid height and weight measurements 1995-2013 Survey year 1995 1996 1997 1998 1999 2000 2001 2002 2003a 2004 2005 2006 2007 2008 2009 2010 2011 2012 2013 Boys Mean 17.7 17.7 17.8 17.9 18.2 18.0 18.2 18.3 18.5 18.6 18.6 18.4 18.4 18.4 18.3 18.2 18.3 18.1 18.2 Standard error of the mean 0.08 0.07 0.06 0.08 0.15 0.14 0.08 0.07 0.12 0.15 0.13 0.07 0.06 0.08 0.09 0.08 0.16 0.16 0.15 Median 17.0 17.1 17.0 17.1 17.3 17.0 17.4 17.4 17.5 17.5 17.7 17.5 17.5 17.4 17.5 17.4 17.4 17.1 17.2 % Overweightb,c 13 15 13 15 15 13 15 14 15 14 16 13 14 15 15 14 15 14 14 % Obeseb,c 11 12 13 13 17 15 16 17 17 19 18 18 17 17 16 17 17 14 16 % Overweight including obese 24 27 26 28 32 27 31 31 32 33 35 31 31 31 31 31 31 28 30 Girls Mean 18.1 18.1 18.1 18.4 18.2 18.5 18.6 18.8 18.8 19.3 18.9 18.7 18.7 18.7 18.5 18.3 18.6 18.4 18.5 Standard error of the mean 0.09 0.10 0.07 0.10 0.15 0.14 0.10 0.07 0.12 0.20 0.14 0.08 0.08 0.08 0.10 0.09 0.18 0.17 0.18 Median 17.3 17.2 17.3 17.4 17.3 17.4 17.6 17.8 17.8 18.1 17.8 17.6 17.7 17.7 17.5 17.4 17.5 17.3 17.5 % Overweightb,c 13 12 13 14 14 13 16 14 15 17 13 14 14 14 13 14 13 15 14 % Obeseb,c 12 12 13 14 14 14 15 17 16 18 19 15 16 15 15 15 16 14 15 % Overweight including obese 26 24 26 28 28 27 31 32 32 35 32 29 31 29 28 29 28 28 29 Bases (unweighted) Boys 1697 1874 3275 1754 857 864 1490 3250 1417 635 1166 3029 3255 3030 1733 2303 678 664 726 Girls 1672 1758 3288 1657 789 846 1532 3140 1416 578 1191 2950 3090 3068 1607 2219 660 657 725 Bases (weighted) Boys 1918 2130 3061 1980 977 875 1652 3744 1452 623 1102 2821 2885 2880 1526 2079 687 680 727 Girls 1901 2013 3068 1872 950 841 1698 3634 1392 581 1091 2668 2792 2740 1464 2033 666 642 689 a
Data for all years have been weighted to correct for the probability of selection. From 2003, non-response weighting has also been applied. b
Categories are mutually exclusive, i.e. overweight does not include those who are obese. c
Overweight was defined as at or above the 85th but below the 95th UK National BMI centile; obese was defined as at or above the 95th UK National BMI centile.
BMI (kg/m2)
and BMI status
ri g h t © 2 0 1 4 , T h e H e a lt h a n d S o c ia l C a re I n fo rm a ti o n C e n tr e . A ll ri g h ts r e s e rv e d
Trends in body mass index (BMI), overweight and obesity prevalence among children aged 2-10, 1995-2013, by sex
Aged 2-10 with valid height and weight measurements 1995-2013 Survey year 1995 1996 1997 1998 1999 2000 2001 2002 2003a 2004 2005 2006 2007 2008 2009 2010 2011 2012 2013 Boys Mean 16.7 16.7 16.7 16.9 17.2 16.9 17.0 17.1 17.2 17.2 17.3 17.1 17.2 17.1 17.0 17.0 16.8 16.7 17.0 Standard error of the mean 0.06 0.06 0.05 0.08 0.15 0.10 0.08 0.06 0.12 0.13 0.12 0.07 0.06 0.07 0.08 0.07 0.11 0.11 0.14 Median 16.4 16.4 16.4 16.5 16.6 16.4 16.6 16.6 16.5 16.6 16.7 16.6 16.7 16.5 16.5 16.6 16.5 16.2 16.4 % Overweightb,c 13 14 13 15 14 14 16 14 15 15 16 12 13 14 16 14 15 13 14 % Obeseb,c 10 11 11 12 17 12 14 16 15 16 17 17 16 14 14 15 12 11 13 % Overweight including obese 23 25 25 27 31 26 30 29 31 31 34 30 30 28 30 30 27 24 26 Girls Mean 16.9 16.8 16.9 17 17 17 17.1 17.3 17.2 17.3 17.4 17.1 17.2 17.2 17.1 16.9 17.0 16.8 16.9 Standard error of the mean 0.08 0.08 0.05 0.07 0.13 0.12 0.09 0.07 0.11 0.14 0.13 0.07 0.07 0.07 0.09 0.08 0.17 0.13 0.12 Median 16.4 16.4 16.5 16.5 16.6 16.4 16.6 16.7 16.6 16.8 16.7 16.5 16.7 16.6 16.5 16.4 16.3 16.3 16.3 % Overweightb,c 13 11 12 13 14 12 15 14 14 15 13 13 14 13 12 13 9 12 13 % Obeseb,c 11 11 11 12 13 12 13 16 13 13 17 14 15 13 15 14 16 10 12 % Overweight including obese 23 22 23 25 27 24 27 30 27 28 30 27 29 26 27 27 24 23 25 Bases (unweighted) Boys 1113 1234 2159 1185 563 582 913 2036 864 404 707 1875 2006 1863 1086 1466 458 432 473 Girls 1114 1178 2222 1082 535 537 980 1948 869 338 731 1845 1921 1909 1020 1453 453 424 455 Bases (weighted) Boys 1261 1418 2005 1336 633 570 1035 2364 878 379 664 1737 1766 1762 934 1293 434 415 454 Girls 1266 1365 2081 1215 628 523 1094 2290 857 346 674 1635 1746 1701 916 1298 420 394 433 a
Data for all years have been weighted to correct for the probability of selection. From 2003, non-response weighting has also been applied. b
Categories are mutually exclusive, i.e. overweight does not include those who are obese. c
Overweight was defined as at or above the 85th but below the 95th UK National BMI centile; obese was defined as at or above the 95th UK National BMI centile.
BMI (kg/m2)
and BMI status
e H e a lt h a n d S o c ia l C a re I n fo rm a ti o n C e n tr e . A ll ri g h ts r e s e rv e d
Trends in body mass index (BMI), overweight and obesity prevalence among children aged 11-15, 1995-2013, by sex
Aged 11-15 with valid height and weight measurements 1995-2013 Survey year 1995 1996 1997 1998 1999 2000 2001 2002 2003a 2004 2005 2006 2007 2008 2009 2010 2011 2012 2013 Boys Mean 19.7 19.7 19.7 19.9 20.1 19.9 20.1 20.3 20.5 20.8 20.5 20.3 20.2 20.5 20.3 20.3 21.0 20.2 20.3 Standard error of the mean 0.15 0.16 0.11 0.15 0.24 0.24 0.16 0.12 0.19 0.27 0.23 0.12 0.11 0.12 0.15 0.14 0.29 0.29 0.30 Median 19.1 19.2 19.1 19.1 19.2 19.2 19.4 19.7 19.7 20.2 19.4 19.7 19.6 19.6 19.5 19.6 20.2 19.4 19 % Overweightb,c 14 15 13 15 15 10 14 15 14 13 15 15 16 16 14 14 15 15 15 % Obeseb,c 14 14 16 17 18 19 19 20 20 24 21 18 18 21 20 20 24 19 20 % Overweight including obese 28 29 29 31 33 29 33 35 35 37 36 33 34 36 34 34 38 34 36 Girls Mean 20.6 20.8 20.7 21.0 20.5 21.0 21.2 21.2 21.5 22.2 21.4 21.1 21.1 21.2 20.8 20.8 21.3 20.9 21.3 Standard error of the mean 0.16 0.18 0.13 0.17 0.28 0.24 0.19 0.13 0.20 0.33 0.21 0.13 0.13 0.11 0.19 0.15 0.29 0.27 0.32 Median 19.9 20.2 20.1 20.4 20.1 20.6 20.6 20.6 20.8 21.3 20.8 20.5 20.4 20.3 20.1 20.2 20.4 20.4 20 % Overweightb,c 14 14 16 16 14 15 18 15 17 20 14 17 15 16 15 17 19 18 17 % Obeseb,c 16 16 16 18 16 19 18 20 22 27 21 17 19 18 15 17 17 19 19 % Overweight including obese 30 30 32 34 29 33 36 35 39 46 36 34 34 34 31 33 36 37 36 Bases (unweighted) Boys 584 640 1116 569 294 282 577 1214 553 231 459 1154 1249 1167 647 837 220 232 253 Girls 558 580 1066 575 254 309 552 1192 547 240 460 1105 1169 1159 587 766 207 233 270 Bases (weighted) Boys 658 713 1056 644 343 305 617 1380 573 244 438 1084 1120 1117 593 786 253 265 274 Girls 635 648 987 657 322 318 604 1343 535 235 417 1033 1046 1039 548 734 245 248 256 a
Data for all years have been weighted to correct for the probability of selection. From 2003, non-response weighting has also been applied. b
Categories are mutually exclusive, i.e. overweight does not include those who are obese. c
Overweight was defined as at or above the 85th but below the 95th UK National BMI centile; obese was defined as at or above the 95th UK National BMI centile.
BMI (kg/m2)
and BMI status