The use of paradata to monitor and manage survey data collection
Frauke Kreuter∗, Mick Couper†, Lars Lyberg‡
Abstract
Paradata are automatic data collected about the survey data collection process captured during computer assisted data collection, and include call records, interviewer observations, time stamps, keystroke data, travel and expense information, and other data captured during the process. Increasingly such data are being used in real time to both monitor and manage large scale data collection processes. In this paper we use a statistical process control perspective to describe how such data can be used to monitor the survey process. Process control charts and statistical models can be used to identify areas of concern during data collection, and can lead to further investigation of the problem and (if necessary) intervention. We describe the data and analyses that are available and present several case studies of paradata use in different types of surveys and organizations.
Key Words: Paradata, Process Control, Survey Management
1. Introduction
Researchers all around the world nowadays use computer assisted methods in one form or another to collect survey data. Such computer assistance is obvious in web surveys, but is equally present in telephone surveys supported by automated call schedulers or mail surveys that take advantage of logs provided by postal services. All of these systems produce auxiliary data about the survey process as by-products. While discussing the use of keystroke data, Couper (1998) originally coined the term paradata as a general notion of such by-product process data produced by a computer-assisted data collection system. Since then survey methodologists have broadened the paradata concept to other aspects of the survey process and other modes of collection (Couper and Lyberg, 2005; Scheuren, 2005; O’Reilly, 2009), to include call records, interviewer observations, time stamps, travel and expense information, and other data captured during the process. In fact, paradata are a subset of the broader class of process data that in some agencies have been used for decades to control various survey processes including for example listing, data collection, data capture, editing, coding, and printing (Mudryk et al., 2001; Minton, 1969; Lyberg, 1981).
Data about processes allow statistically informed evaluation, monitoring and managing of such processes. And as the survey world moves towards the imple-mentation of quality metrics, measures for quality improvements and cost savings (Biemer and Caspar, 1994; Lyberg et al., 1997; Aitken et al., 2004; Couper and Ly-berg, 2005), such data become valuable tools. Both data users and data producers are aware of the potential benefits of paradata and this has been reflected in several sessions at not only the Joint Statistical Meetings (JSM), but also at the bi-annual conferences of the European Survey Research Association (ESRA) as well as the Quality conferences, co-organized by Eurostat.
∗JPSM University of Maryland, USA & IAB, Germany
†University of Michigan, USA & JPSM University of Maryland, USA
In this paper we will first review a set of increasingly common uses of para-data following survey para-data collection, and then discuss the possibilities of a more concurrent use of paradata in the spirit of statistical process control. Examples primarily from the National Survey of Family Growth will be given to show how process control charts and statistical models can be used to identify areas of concern during data collection, and can lead to further investigation of the problem and (if necessary) intervention. Web and telephone survey examples for monitoring and interventions will also be discussed.
2. Paradata and their Post-Survey Use
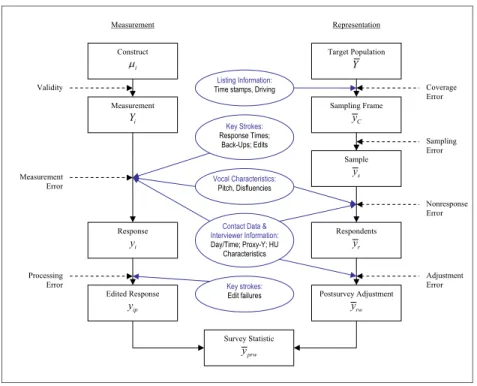
To date, most examples in which paradata have been used, can be characterized as post-survey assessments or post-survey corrections of errors common in the survey process. Kreuter and Casas-Cordero (2010) modified the display of the total survey error framework (Groves et al., 2004) to visualize the various paradata used to address each of the error sources (see Figure 1).
Paradata fromcall records, which typically include the time of contact (day and time), as well as the outcome of a call (non-contact, refusal, ineligible, interview, appointment etc.), are for example often used to evaluate and reduce nonresponse error (Heerwegh et al., 2007; Blom et al., 2010). Call record data are available for both respondents and non-respondents in a survey and thus are prime candidates to study nonresponse bias.
Using such call record data in post-survey level-of-effort analyses, early respon-dents are compared to late responrespon-dents under the assumption that late responrespon-dents are more similar to nonrespondents than early respondents (Stinchcombe et al., 1981; Smith, 1984; Schnell, 1998; Kennickell, 1999; Chiu et al., 2001; Duhart et al., 2001; Lynn et al., 2002; Lynn, 2003; Wang et al., 2005; Stoop, 2005; Voogt and Saris, 2005; Billiet et al., 2007); for a meta-analysis of the results see Olson (2010). With the goal of assessing net quality gains, researchers use call record data to ex-amine the relationship between nonresponse and measurement error (Green, 1991; Yan et al., 2004; Olson, 2006; Peytchev and Peytcheva, 2007; Yu and Yan, 2007). In other applications, call record data from one survey are used to determine optimal call schedules for subsequent surveys or survey waves (Weeks et al., 1987; Greenberg and Stokes, 1990; Stokes and Greenberg, 1990; Matsuo et al., 2006). The possibility of using call record data for nonresponse adjustment as been discussed for quite some time (Drew and Fuller, 1980; Potthoff et al., 1993; Groves and Couper, 1998), and current papers demonstrate the relationship between detailed information in call records and the probability to respond to a survey request (Beaumont, 2005; Biemer and Wang, 2007; Blom, 2009; Kreuter and Kohler, 2009).
A second set of data subsumed under the concept of paradata is collected during the initial phase of establishing contact and convincing sample units to participate in the survey. These paradata are observations made by the interviewer. Inter-viewers are charged with collecting observations of neighborhoods and housing unit characteristics in a number of surveys usually along the lines suggested by Cam-panelli et al. (1997), Groves and Couper (1998), and Lynn (2003). Other sets of interviewer observations made at the door-step are those capturing the interaction between interviewer and respondent and respondents’ reasons for refusal (Campan-elli et al., 1997; Bates and Piani, 2005; Bates et al., 2008). Interviewer observations of variables close to the survey – such as the presence of children in a fertility survey (Lepkowski et al., 2010) or indicators of age or disability in a health survey (Couper
Construct i Measurement i Y Response i y Edited Response ip y Postsurvey Adjustment rw y Target Population Y Sampling Frame C y Sample s y Respondents r y Survey Statistic prw y Listing Information:
Time stamps, Driving
Vocal Characteristics:
Pitch, Disfluencies
Contact Data & Interviewer Information: Day/Time; Proxy-Y; HU Characteristics Key Strokes: Response Times; Back-Ups; Edits Validity Measurement Error Processing Error Coverage Error Sampling Error Nonresponse Error Adjustment Error Measurement Representation Key strokes: Edit failures
Figure 1: Total Survey Error components and paradata for their assessment
(Kreuter and Casas-Cordero, 2010)
et al., 1994; Groves et al., 1995) – can complement call record data in response propensity models due to their likely stronger relationship to survey variables of interest (Kreuter et al., 2010), although difficult issues in modeling may arise when strong predictors of response are combined with strong predictors of survey outcome variables (Kreuter and Olson, 2010).
Audio recordings of the interaction between interviewer and respondent, and in particular thevocal characteristics of the respondent and interviewer are a third set of paradata used to examine survey nonresponse (Groves et al., 2007; Best et al., 2009) as well as measurement error (Jans, 2010). Recordings become more common as digital storage becomes less expensive (Couper, 2005; Herget et al., 2005; Thissen et al., 2007). However the post-processing of such recordings into usable paradata is a large task and has been undertaken in only a few methodological studies (Jans, 2010; Conrad et al., 2010).
Most data collection software records the time to complete a question, a set of questions or the whole interview (response times), and capture keystrokes, with which researchers can, for example, measure how often a respondent backed up and changed an answer and whether supplementary definitions are used (Couper, 1998). Response times and keystroke measures have been used to study aspects of the response process (Bassili and Fletcher, 1991; Kreuter, 2002; Heerwegh, 2003; Kaminska and Billiet, 2007; Yan and Tourangeau, 2008; Couper et al., 2009; Lenzner et al., 2009; Peytchev, 2009), to evaluate interviewers (Couper et al., 1997; Mockovak and Powers, 2008), and to review the performance of questions in pretests (Couper, 2000; Stern, 2008; Hicks et al., 2009).
However, all these share one common feature. The analyses are conducted after the survey is completed and the results are available to survey designers only for subsequent surveys. Consequently, concurrent data collections are largely unaffected by the lessons learned. Thus we will briefly summarize in the next section the statistical process control perspective, which offers another use of paradata.
3. Paradata in a Process Control Perspective
It has been recognized that good survey quality in terms of small error rates for spe-cific error sources, small mean squared errors for selected estimates or other product characteristics depends on the design and maintenance of the underlying processes that generate the products. Statistical agencies have always been concerned with quality but in many of them a clear perspective of the link between process and product has been missing. By controlling and possibly adjusting the processes, the survey goals are more easily reached and often at a lower cost than expensive rework due to failed quality goals. This approach to survey quality also has an em-bedded element of continuous quality improvement since any process analysis can identify root causes of problems that, once eliminated, contribute to a decreased process variation, which in turn leads to a decreased variation in survey product characteristics.
Some survey organizations, including Statistics Canada (Mudryk et al., 2002), the U.S. Census Bureau (Bushery et al., 2006), Westat Inc. (Morganstein and Hansen, 1990), Institute for Social Research at the University of Michigan (Couper and Lyberg, 2005; Groves and Heeringa, 2006) and Statistics Sweden (Lyberg, 1981; Japec, 2005), have applied theories and methods for quality control to some of their processes. These theories and methods were originally developed for industrial applications but it turns out that they can be used in administrative settings as well. The literature on statistical quality control is very extensive and discusses the use of statistical methods and other problem-solving techniques to improve the quality of products (see (Pierchala and Surti, 2009; Montgomery, 2005; Juran and Gryna, 1980) for examples). The techniques for quality improvement range from simple histograms, Pareto charts, scatter plots and process flow diagrams to more elaborate tools such as experiments, cause-and-effect diagrams, acceptance sampling and Shewhart’s famous control chart. The control chart is used to distinguish between common and special cause process variation, and the basic philosophy is to start any process investigation by eliminating any special cause variation so that the process only has common cause variation. If the common cause variation is deemed too large, an attempt is made to improve the process so that the natural process variability decreases.
One way of controlling the survey processes is to identify key process variables. This can be done for almost any process directly or indirectly affecting survey qual-ity. The goal is to identify those variables that are most likely to affect the product characteristics resulting from the particular process. Examples of processes that easily lend themselves to this exercise include the aforementioned data collection, editing, data capture and coding but also administrative processes such as compe-tence development and budgeting (Morganstein and Marker, 1997). Examples of key process variables for editing and coding are given in (Biemer and Lyberg, 2003). The measurement of process variables results in process data.
As mentioned before, in 1998 Couper introduced the term paradata for those process data that are confined to the data collection process. Paradata is part of
Couper’s trilogy: data, metadata, paradata. The concept of paradata can for other survey-support processes be called process data. In our context we call all process data paradata, and in this spirit we will present several examples of paradata being used for concurrent monitoring and managing of surveys.
4. Paradata used in Monitoring and Managing of Ongoing Surveys
Inspired by continuous quality improvement methods (Imai, 1986; Deming, 1986), in which measures about the process are taken along the way, so that error sources can be located and interventions can be targeted, researchers suggested the use of such strategies to the process of survey operations (Biemer and Caspar, 1994; Morganstein and Marker, 1997). Paradata as we discuss them here can play an im-portant role in the application of such strategies. The European Statistical System has developed a handbook on improving quality through the analysis of paradata (Aitken et al., 2004). However these guidelines are only a starting point and in-dividual surveys might do well to identify key process variables for their specific circumstances (Couper and Lyberg, 2005).
A focus on key process variables rather than set outcomes is warranted in the context of responsive designs. Groves and Heeringa (2006) point out that surveys increasingly face large uncertainties at the design stage and the beginning of data collection, such as the effectiveness of measures taken to establish contact with households, identify eligible persons, select a respondent, gain that person’s coop-eration, and complete the interview. These uncertainties threaten the ability of survey organizations either to meet targeted response rates or to stay within a pre-specified budget (Wagner, 2010). Thus rather than relying on pre-pre-specified targets, a set of key process variables is monitored continuously and allows for targeted interventions (Groves and Heeringa, 2006). This monitoring heavily relies on the timely availability of suitable paradata. Each of the following sections presents one or more examples of the current use of paradata in responsive survey designs.
4.1 Example: Field work interventions using call record data
The U.S. National Survey of Family Growth (Lepkowski et al., 2010) has made extensive use of paradata for ongoing survey operations. The paradata are used both to monitor key indicators (effort, cost, response rates, etc.) and to intervene as necessary. The NSFG is a continuous cross-sectional survey with each quarter of data collection being a separate replicate. This unique design permits tracking of key performance and quality metrics across quarters. The NSFG also employs a two-phase design; a sample of nonresponding cases in the tenth week are sampled for additional effort in the remaining two weeks of data collection. The paradata are being used in three key ways in the NSFG:
1. Active management of ongoing data collection activities, in which performance and production metrics are fed back to survey managers and field staff to help them identify areas of concern (“out of control” processes in the SPC context) and target interviewers and areas for attention.
2. Responsive design during Phase 1, in which a variety of paradata are used to identify specific cases for attention. These cases are then flagged as priority cases for interviewers, with the goal of redressing imbalances in the sample based on key indicators. Many of these interventions have been done experi-mentally to explore the efficacy of alternative approaches.
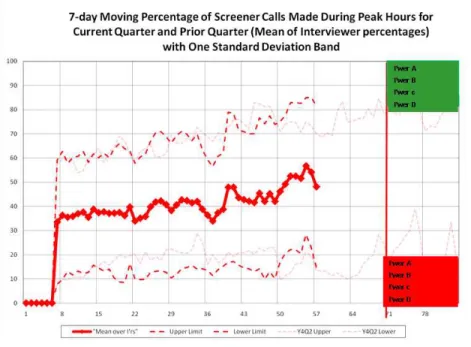
Figure 2: NSFG Dashboard Example: Interviewer Performance
3. Two-phase sampling, in which propensity models based on Phase 1 paradata are used to identify and subsample cases for the second phase of data col-lection. Extra interviewer effort and increased incentives are used in Phase 2.
One of the key process indicators identified for NSFG is the number of calls placed. Paradata from daily updates of call records are used to produce these process indicators. NSFG thus monitors these data on a daily basis through a dashboard. Since there is a great deal of variation across days (interviewers tend to not work on Mondays), NSFG usually displays the process indicators as seven-day moving average. This smooths the differences by day. Figure 2 shows the 7-day moving average of the percentage of screener calls made during peak hours for the current quarter and prior quarters of NSFG data collection. This example of a sta-tistical process control chart also includes identification of high- and low-performing interviewers (top 4 and bottom 4 are identified in green and red respectively) and build the basis for interventions.
In order to keep the focus on unscreened cases, the NSFG management team instituted a “screener” week. During this week, interviewers are encouraged to focus on their unscreened cases.
4.2 Examples: Monitoring of sample composition and interventions
us-ing interviewer observations
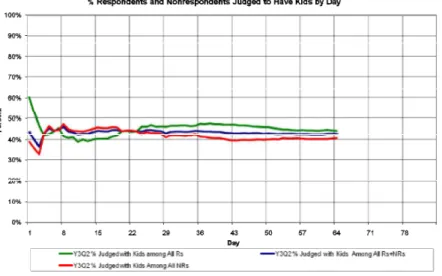
Similar paradata informed interventions are made by the NSFG management team to ensure a balanced respondent pool. To give an example of one of the variables where balance is desired, consider the item asking respondents about the number of sexual partners they have had in the past year. This variable is a key indicator for NSFG. From past cycles and quarters NSFG knows that there is a significant difference in the proportion of respondents having two or more sexual partners in the past year between respondents with and without young children. Unlike
Figure 3: NSFG result of intervention: data set balance
the number of sexual partners, the presence of children can be observed by the interviewer during a screener call. These interviewer observations of the presence of children can therefore be used to monitor the sample composition. When the nonrespondent pool becomes imbalanced on the interviewer observations of the presence of children, an intervention can be launched to increase effort on those cases. Interviewers get those cases flagged as they download their daily assignments from the case management system.
Figure 3 show that the intervention does indeed lead to an increased balance with respect to the interviewer observation of the presence of children in the household. The success of paradata-driven management of ongoing data collection has been successfully demonstrated in a continuous cross-sectional survey like NSFG. Similar efforts are underway to apply these ideas to panel surveys and to RDD telephone surveys.
At Statistics Netherlands, Barry Schouten, Fanny Cobben, and Jelke Bethle-hem (2009) suggested a series of indicators (R-Indicators) to statistically capture such an imbalance (or increasing balance) using sampling frame data and paradata. These measures reflect the similarity between sample and respondents. Using such measures to field intervention is directly related to reduction of nonresponse bias on an item level. The quality of such measures does however depend on the quality of the paradata used and to what extent it is possible to capture, via paradata, proxy variables of the outcomes of interest. Frame data are usually too general.
A step further in this direction is James Wagner’s (2009) suggestion to use the fraction of missing information to guide fieldwork decisions. The fraction of miss-ing information is a measure of our uncertainty about the values we would impute for missing elements. In this line of thinking, the sample is conceptualized as a data matrix, with current nonrespondents as missing values. The most straightfor-ward method for estimating this statistic is creating multiple imputations under an assumed model. A higher quality dataset would have less uncertainty about the imputed values. Monitoring between-imputation variance seems then like a natural choice for monitoring the uncertainty about nonresponse bias in an ongoing produc-tion process. The imputaproduc-tions can be done by condiproduc-tioning on the complete data on the sampling frame and the paradata.
4.3 Examples: Call schedule interventions
Most intervention in face-to-face area probability surveys are confronted with the challenge that intervention suggestions have to take the segment level into account. And for that matter many of the paradata reflect segment level interviewer behav-ior rather than interviewer behavbehav-ior that is tailored to a single sample case. Phone surveys allow much more flexibility in the use of paradata. Cases can be delivered directly to available interviewers at appropriate times based on real-time algorithms. Interviewer case assignments or prior involvement of an interviewer with a certain case can – with the exception of panel surveys – largely be ignored. Thus survey organizations have for years used features of automated call schedulers to create op-timal calling patterns (though seldom experimentally tested). Similar interventions currently tested for field surveys as well.
4.4 Examples: Keystroke based interventions
Response times and keystroke measures have been used to guide interventions in Web surveys in real time. For example, Conrad and colleagues (2009) have ex-perimented with interventions based on the speed with which respondents answer questions, with a goal of improving data quality. If a respondent answers a question faster than the typical minimum reading time, they are prompted with a message to encourage more careful consideration of the question. They found that prompting does slow down completion time on subsequent questions and reduces straightlining in grid questions for those respondents who are responsive to the prompts.
A variety of other time- and keystroke-based measures are possible in self-administered surveys. For example, prompting for unanswered questions has been shown to significantly reduce missing data (e.g., de Rouvray and Couper, 2002). However, it is not known how many prompts should be given before there is a possible backfire effect, with respondents abandoning the survey. Keystroke data could be used to keep track of the number of prompts received and the respon-dent’s reaction to such prompts, to determine whether prompts should continue, or some other intervention is necessary. Similarly, the time taken to click through a question that is not answered may identify the difference between a “refusal” and a “do not know,” which in turn may lead to different follow-up questions. Willis and Rohwedder (2010) examine respondent effort on complex financial questions, and speculate on ways to get respondents to commit more effort to answer such questions in Web surveys. These early studies suggest the potential for direct in-terventions in self-administered surveys (both Web and CASI) based on paradata collected during the survey. Paradata are also being widely used to evaluate the quality of self-administered survey data after the fact, as noted earlier.
5. Challenges
As pointed out by Couper (1998) and Bushery and McGovern (2010), paradata col-lection and analysis should be goal-driven so that the analyst is not overwhelmed by the amount of data that can be obtained so easily, quickly and cheaply as automatic byproducts. The selection of process variables should be restricted to those that are key to the important product characteristics. As soon as it is discovered that a process variable doesn’t have much impact on important product characteristics it should be abandoned and possibly replaced be some other variable. The selection of these key process variables is a process in itself that is in need of standardization.
The involvement of interviewers in the process of paradata collection poses an additional challenge. Interviewers are not trained to collect paradata and their pri-mary task is quite different and almost at odds with the task of collecting paradata. While for the survey data collection we want the interviewer not to let their per-sonal opinions and observations influence the interview, in the collection of paradata interviewer judgement is explicitly asked for. The collection of observational data must be made simple for the interviewers, and the development of such measures should be done with the same amount of scrutiny as one would give to items in the primary data collection.
The theory and methodology of statistical quality control offers a myriad of plotting and analysis techniques. We need to study this theory and methodology in more detail so that it can be adapted and used to its full potential in survey quality work. Paradata are multivariate in nature. Sometimes we need observations of several variables to discover whether a process is in control or not.
It is important that once we sit with the dashboard in front of us with lots of opportunities to react or not to react we must know if the variation displayed is due to common cause or special cause. In all paradata analysis there is an exploratory element and a production element. The latter must be based on collections that have sufficient sample sizes and where observations have been plotted correctly and where the control chart chosen is appropriate for the analysis chosen. Also we need to learn how to use paradata to intervene in the process as needed. We do not want to waste resources ”chasing ghosts” because we are not using statistical process control tools to distinguish between different types of process variation that in turn require different actions. Other outstanding issues include the creation of paradata archives to allow reanalysis so that our understanding of what is key can grow or change. There is also potential of partnership across organizations and to find ways of communicating paradata with users.
Finally so far most applications of paradata use in ongoing survey production are applications in which data is collected repeatedly, either in a panel survey or with continuous interviewing. Moving forward we need to pay attention to how process control charts can be employed in a meaningful way for first time cross sectional data collections.
References
Aitken, A., J. H¨orngren, N. Jones, D. Lewis, and M. J. Zilh˜ao (2004). Handbook on improving quality by analysis of process variables. Technical report, Eurostat. Bassili, J. N. and J. F. Fletcher (1991). Response-time measurement in survey research a method for CATI and a new look at nonattitudes. Public Opinion Quarterly 55(3), 331–346.
Bates, N., J. Dahlhamer, and E. Singer (2008). Privacy concerns, too busy, or just not interested: Using doorstep concerns to predict survey nonresponse. Journal of Official Statistics 24(4), 591–612.
Bates, N. and A. Piani (2005). Participation in the National Health Interview Sur-vey: Exploring reasons for reluctance using contact history process data. In Pro-ceedings of the Federal Committee on Statistical Methodology (FCSM) Research Conference.
Beaumont, J. (2005). On the use of data collection process information for the treat-ment of unit nonresponse through weight adjusttreat-ment. Survey Methodology 31(2), 227–231.
Best, H., G. Bauer, and L. Steinkopf (2009). Interviewer voice characteristics and productivity in telephone surveys. Paper presented at the European Survey Re-search Association (ESRA) Conference, Warsaw, Poland.
Biemer, P. and R. Caspar (1994). Continuous quality improvement for survey op-erations: Some general principles and applications. Journal of Official Statis-tics 10(3), 307–326.
Biemer, P. and K. Wang (2007). Using callback models to adjust for nonignorable nonresponse in face-to-face surveys. In Proceedings of the Section on Survey Research Methods af the American Statistical Association.
Biemer, P. P. and L. E. Lyberg (2003). Introduction to Survey Quality. John Wiley. Billiet, J., M. Philippens, R. Fitzgerald, and I. Stoop (2007). Estimation of non-response bias in the European Social Survey: Using information from reluctant respondents. Journal of Official Statistics 23(2), 135–162.
Blom, A. (2009). Nonresponse bias adjustments: What can process data contribute? Iser working paper 2009-21, Institute of Social research (ISER), Essex University. Blom, A., P. Lynn, and A. J¨ackle (2010). Understanding cross-national differences in unit non-response: The role of contact data. In J. A. Harkness, B. Edwards, M. Braun, T. P. Johnson, L. E. Lyberg, P. P. Mohler, B.-E. Pennell, and T. Smith (Eds.), Survey Methods in Multinational, Multiregional, and Multicultural Con-texts. New York: John Wiley and Sons.
Bushery, J. and P. McGovern (2010). Measuring process quality and performance at statistical organizations. Paper presented at the 2010 European Conference on Quality in Official Statistics, Helsinki Finnland.
Bushery, J., P. McGovern, P. S. Marck, and H. Hogan (2006). Quality audits at the u.s. census bureau. Proceedings of the European Conference on Quality in Survey Statistics.
Campanelli, P., P. Sturgis, and S. Purdon (1997). Can you hear me knocking: An investigation into the impact of interviewers on survey response rates. Technical report, The Survey Methods Centre at SCPR, London.
Chiu, P., H. Riddick, and A. Hardy (2001). A comparison of characteristics between late/difficult and non-late/difficult interviews in the National Health Interview Survey. InProceedings of the Section on Survey Research Methods af the American Statistical Association.
Conrad, F., J. Broome, J. Benki, R. Groves, F. Kreuter, and D. Vannette (2010). To agree or not to agree: Effects of spoken language on survey participation decisions. Paper to be presented at the Annual Conference of the American Association of Public Opinion and Research (AAPOR), Chicago, IL.
Conrad, F., M. Couper, R. Tourangeau, M. Galesic, and T. Yan (2009). Interactive feedback can improve accuracy of responses in web surveys. Paper presented at the European Survey Research Association (ESRA) Conference, Warsaw, Poland.
Couper, M. (1998). Measuring survey quality in a CASIC environment. In Pro-ceedings of the Section on Survey Research Methods af the American Statistical Association.
Couper, M. (2000). Usability evaluation of computer-assisted survey instruments. Social Science Computer Review 18(4), 384–396.
Couper, M. (2005). Technology trends in survey data collection. Social Science Computer Review 23, 486–501.
Couper, M., R. Groves, and W. Rodgers (1994). Cost implications and predictors of unit nonresponse in ahead. In Paper presented at the AHEAD Early Results Workshop, Ann Arbor, September.
Couper, M., S. Hansen, and S. Sadosky (1997). Evaluating interviewer performance in a CAPI survey. In L. Lyberg, P. Biemer, M. Collins, E. DeLeeuw, C. Dippo, N. Schwarz, and D. Trewin (Eds.),Survey Measurement and Process Quality, pp. 267–285. New York: John Wiley.
Couper, M. and L. Lyberg (2005). The use of paradata in survey research. In Proceedings of the 55th Session of the International Statistical Institute, Sydney, Australia.
Couper, M., R. Tourangeau, and T. Marvin (2009). Taking the audio out of Audio-CASI. Public Opinion Quarterly 73(2), 281–303.
Deming, W. (1986). Out of the Crisis. Cambridge: Cambridge University Press. deRouvray, C. and M. Couper (2002). Designing a strategy for capturing
‘respon-dent uncertainty’ in web-based surveys. Social Science Computer Review 20, 3–9.
Drew, J. and W. Fuller (1980). Modeling nonresponse in surveys with callbacks. In Proceedings of the Section on Survey Research Methods af the American Statistical Association.
Duhart, D., N. Bates, B. Williams, G. Diffendal, and P. Chiu (2001). Are late/difficult cases in demographic survey interviews worth the effort? A review of several federal surveys. In Proceedings of the Federal Committee on Statistical Methodology (FCSM) Research Conference.
Green, K. E. (1991). Relunctant respondents: Differences between early, late and nonrespondents to a mail survey.Journal of Experimental Education 56, 268–276. Greenberg, B. and S. Stokes (1990). Developing an optimal call scheduling strategy
for a telephone survey. Journal of Official Statistics 6(4), 421–435.
Groves, R. and M. Couper (1998). Nonresponse in Household Interview Surveys. New York: John Wiley.
Groves, R., F. Fowler, M. Couper, R. Tourangeau, and J. Lepkowski (2004). Survey Methodology. New York: John Wiley.
Groves, R. and S. Heeringa (2006). Responsive design for household surveys: Tools for actively controlling survey errors and costs. Journal of the Royal Statistical Society, Series A 169(3), 439–457.
Groves, R., T. Raghunathan, and M. Couper (1995). Evaluating statistical ad-justments for unit nonresponse in a survey of the elderly. In Paper presented at the Sixth International Workshop on Household Survey Nonresponse, Helsinki, October.
Groves, R., J. Wagner, and E. Peytcheva (2007). Use of interviewer judgments about attributes of selected respondents in post-survey adjustment for unit nonresponse: An illustration with the National Survey of Family Growth. InProceedings of the Section on Survey Research Methods af the American Statistical Association. Heerwegh, D. (2003). Explaining response latencies and changing answers using
client-side paradata from a web survey. Social Science Computer Review 21(3), 360–373.
Heerwegh, D., K. Abts, and G. Loosveldt (2007). Minimizing survey refusal and noncontact rates: Do our efforts pay off? Survey Research Methods 1(1), 3–10. Herget, D., P. Biemer, J. Morton, and K. Sand (2005). Computer audio recorded
interviewing (CARI): Additional feasibility efforts of monitoring field interview performance. In Paper presented at the U.S. Federal Conference on Statistical Method.
Hicks, W., B. Edwards, K. Tourangeau, L. Branden, D. Kistler, B. McBride, L. Harris-Kojetin, and A. Moss (2009). A system approach for using CARI in pretesting, evaluation and training. Paper presented at the FedCasic Conference, Delray Beach, FL.
Imai, M. (1986). Kaizen: The Key to Japan’s Competitive Success. New York: McGraw-Hill.
Jans, M. (2010). Verbal Paradata and Survey Error: Respondent Speech, Voice, and Question-Answering Behavior Can Predict Income Item Nonresponse. Ph. D. thesis, University of Michigan, United States.
Japec, L. (2005). Quality issues in interview surveys:some contributions. PhD dissertation, Stockholm university, Department of Statistics.
Juran, J. and F. J. Gryna (1980). Quality planning and analysis: From product development through use. McGraw-Hill.
Kaminska, O. and J. Billiet (2007). Satisficing for reluctant respondents in a cross-national context. Paper presented at the European Survey Research Association (ESRA) Conference, Prague, Czech Republic.
Kennickell, A. (1999). What do the ‘late’ cases tell us? Evidence from the 1998 Survey of Consumer Finances. Paper presented at the International Conference on Survey Nonresponse, Portland, OR.
Kreuter, F. (2002).Kriminalit¨atsfurcht: Messung und methodische Probleme. Leske and Budrich.
Kreuter, F. and C. Casas-Cordero (2010). Paradata. Working paper, German Council for Social and Economic Data.
Kreuter, F. and U. Kohler (2009). Analyzing contact sequences in call record data. Potential and limitation of sequence indicators for nonresponse adjustment in the European Social Survey. Journal of Official Statistics 25(2), 203–226.
Kreuter, F. and K. Olson (2010). Multiple auxiliary variables in nonresponse ad-justment. manuscript under review.
Kreuter, F., K. Olson, J. Wagner, T. Yan, T. Ezzati-Rice, C. Casas-Cordero, M. Lemay, A. Peytchev, R. Groves, and T. Raghunathan (2010). Using proxy measures and other correlates of survey outcomes to adjust for nonresponse: Ex-amples from multiple surveys. Journal of the Royal Statistical Society, Series A.
Lenzner, T., L. Kaczmirek, and A. Lenzner (2009). Cognitive burden of survey questions and response times: A psycholinguistic experiment. Applied Cognitive Psychology.
Lepkowski, J., W. Axinn, N. Kirgis, B. T. West, S. N. Kruger, W. Mosher, and R. Groves (2010). Use of paradata in a responsive design framework to manage a field data collection. NSFG Survey Methodology. Working Papers. Report 10-012. Lyberg, L. (1981).Control of the coding operation in statistical investigations: Some contributions. PhD dissertation, Stockholm university, Department of Statistics. Lyberg, L., P. Biemer, M. Collins, E. De Leeuw, C. Dippo, N. Schwarz, and D. Trewin (1997). Survey Measurement and Process Quality. New York: John Wiley.
Lynn, P. (2003). PEDAKSI: Methodology for collecting data about survey non-respondents. Quality and Quantity 37(3), 239–261.
Lynn, P., P. Clarke, J. Martin, and P. Sturgis (2002). The effects of extended interviewer efforts on nonresponse bias. In D. Dillman, J. Eltinge, R. Groves, and R. Little (Eds.), Survey nonresponse. New York: John Wiley.
Matsuo, H., G. Loosveldt, and J. Billiet (2006). The history of the contact procedure and survey cooperation - Applying demographic methods to European Social Survey contact forms round 2 in belgium. Louvain-la-Neuve, Belgium. Paper presented at the Quetelet Conference.
Minton, G. (1969). Inspection and correction error in data processing, Volume 64. Mockovak, W. and R. Powers (2008). The use of paradata for evaluating interviewer
training and performance. In Proceedings of the Section on Survey Research Methods af the American Statistical Association.
Montgomery, D. (2005).Introduction to statistical quality control. 5th edition. Wiley. Morganstein, D. and M. Hansen (1990). Survey operations processes: The key to quality improvement. In G. Liepinks and V. Uppuluri (Eds.), Data Quality Control. Marcel Dekker.
Morganstein, D. and D. Marker (1997). Continuous quality improvement in sta-tistical agencies. In L. Lyberg, P. Biemer, M. Collins, E. De Leeuw, C. Dippo, N. Schwarz, and D. Trewin (Eds.), Survey Measurement and Process Quality. New York: John Wiley.
Mudryk, W., B. Bougie, P. Xiao, and A. Yeung (2001).Statistical methods in quality control at Statistics Canada. Course Reference Manual. Statistics Canada. Mudryk, W., B. Bougie, and H. Xie (2002). Some guidelines for data analysis in
quality control. Statistics Canada technical report.
Olson, K. (2006). Survey participation, nonresponse bias, measurement error bias, and total bias. Public Opinion Quarterly 70(5), 737–758.
Olson, K. (2010). When do nonresponse follow-ups improve or reduce data quality? A synthesis of the existing literature. manuscript.
O’Reilly, J. (2009). Paradata and Blaise: A review of recent applications and research. Paper presented at the International Blaise Users Conference (IBUC), Latvia.
Peytchev, A. (2009). Survey breakoff. Public Opinion Quarterly 73(1), 74–97. Peytchev, A. and E. Peytcheva (2007). Relationship between measurement error and
unit nonresponse in household surveys: An approach in the absence of validation data. InProceedings of the Section on Survey Research Methods af the American Statistical Association.
Pierchala, C. and J. Surti (2009).Control Charts as a Tool for Data Quality Control, Volume 25.
Potthoff, R., K. Manton, and M. Woodbury (1993). Correcting for nonavailabil-ity bias in surveys by weighting based on number of callbacks. Journal of the American Statistical Association 88(424), 1197–1207.
Scheuren, F. (2005). Paradata from concept to completion. In Proceedings of the Statistics Canada Symposium. Methodological Challenges for Future Information Needs.
Schnell, R. (1998).Besuchs- undBerichtsverhalten derInterviewer. In Statistisches Bundesamt (Ed.),Interviewereinsatz und -qualifikation, pp. 156–170.
Schouten, B., F. Cobben, and J. Bethlehem (2009). Indicators for the representa-tiveness of survey response. Survey Methodology 35(1), 101–113.
Smith, T. (1984). Estimating nonresponse bias with temporary refusals.Sociological Perspectives 27(4), 473–489.
Stern, M. (2008). The use of client-side paradata in analyzing the effects of visual layout on changing responses in web surveys. Field Methods 20(4), 377–398. Stinchcombe, A., C. Jones, and P. Sheatsley (1981). Nonresponse bias for attitude
questions. Public Opinion Quarterly 45, 359–375.
Stokes, S. and B. Greenberg (1990). A priority system to improve callback success in telephone surveys. In Proceedings of the Section on Survey Research Methods af the American Statistical Association.
Stoop, I. (2005).The Hunt for the Last Respondent. The Hague: Social and Cultural Planning Office.
Thissen, R., S. Sattaluri, E. McFarlane, and P. P. Biemer (2007). Evolution of audio recording in field surveys. In Paper presented at The American Association for Public Opinion Research (AAPOR) 62th Annual Conference.
Voogt, R. and W. Saris (2005). Mixed mode designs: Finding the balance between nonresponse bias and mode effects. Journal of Official Statistics 21, 367–387. Wagner, J. (2009). Adaptive contact strategies in a telephone survey. In
Pro-ceedings of the Federal Committee on Statistical Methodology (FCSM) Research Conference.
Wagner, J. (2010). The fraction of missing information as a tool for monitoring the quality of survey data. Public Opinion Quarterly 74(2), 223–243.
Wang, K., J. Murphy, R. Baxter, and J. Aldworth (2005). Are two feet in the door better than one? using process data to examine interviewer effort and nonresponse bias. InProceedings of the Federal Committee on Statistical Methodology (FCSM) Research Conference.
Weeks, M., R. Kulka, and S. Pierson (1987). Optimal call scheduling for a telephone survey. Public Opinion Quarterly 51, 540–549.
Willis, R.J. Couper, M. and S. Rohwedder (2010). Can survey respondents do bet-ter? respondent effort and data quality in hrs, cogecon and alp. Paper presented at the HRS Internet Workshop, Munich, March.
Yan, T. and R. Tourangeau (2008). Fast times and easy questions: The effects of age, experience and question complexity on web survey response times. Applied Cognitive Psychology 22(1), 51–68.
Yan, T., R. Tourangeau, and Z. Arens (2004). When less is more: Are reluctant respondents poor reporters? In Proceedings of the Section on Survey Research Methods af the American Statistical Association.
Yu, M. and T. Yan (2007). Are nonrespondents necessarily bad reporters? Using imputation techniques to investigate measurement error of nonrespondents in an alumni survey. In Proceedings of the Section on Survey Research Methods af the American Statistical Association.