Optimizing Cellular Network Analysis with a
Mobile Device
Niclas Fagerholm
Master’s Thesis at KTH ICT
Supervisor & examiner: Johan Montelius
Abstract
This Master Thesis deals with developing an application for cell analysis and optimization. When network operators gradually move from 2G networks to 3G networks there is an increased need for efficient cell optimizations. RAT is a PC application that does post analysis of gathered field data in order for engineers to improve their systems. I have been asked to develop an application for a mobile device called RAT-UE that gathers the information required by the RAT PC application.
In order to understand what the RAT-UE application should be capable of relevant concepts within cellular radio systems and architectures are explained and discussed. The design of a typical Symbian C++ is explained as it will be the foundation for developing the RAT-UE application. The performance of the application is evaluated to be adequate and the data that it acquires through a proprietary API is also evaluated to be adequate for certain circumstances. The final application is able to provide the RAT PC application with relevant data, although the precision and number of data-types could be improved. The application thus allows the user to quickly assess the situation of the network and to later generate coverage maps of the collected data and conduct cell optimizations.
Acknowledgements
I want to express my gratitude towards the kind and helpful employees at Webconnect and Network Expertise, who all have been a great inspiration for me. I also want to thank my tutor at KTH, Johan Montelius, who has provided me with key insight in the area of telecommunications and helped me conduct my research. Finally I want to thank my family who has always been there for me.
Contents
1 Introduction 1 1.1 Background . . . 1 1.2 Related work . . . 2 1.3 Problem statement . . . 2 1.4 Approach . . . 3 1.5 Thesis outline . . . 32 Cellular radio systems 5 2.1 Second generation . . . 5
2.1.1 Multiple access . . . 5
2.1.2 Frequencies . . . 6
2.1.3 Base Station Identification . . . 6
2.1.4 Signal strength . . . 7
2.1.5 Signal quality . . . 8
2.2 Third generation . . . 8
2.2.1 Multiple access . . . 8
2.2.2 Frequencies . . . 9
2.2.3 Spreading and despreading . . . 9
2.2.4 Scrambling Code . . . 9 2.2.5 Handovers . . . 9 2.2.6 State . . . 10 2.2.7 Signal strength . . . 10 2.2.8 Signal quality . . . 10 2.2.9 Rake receiver . . . 11
3 Cellular network architectures 13 3.1 Cell planning . . . 13
3.1.1 GSM . . . 13
3.1.2 UMTS . . . 14
3.2 Co-location and co-siting . . . 15
3.3 GSM and UMTS interoperation . . . 15
3.4 Cell optimization . . . 16 3.4.1 Initial tuning . . . 16 3.4.2 Continuous optimization . . . 16 3.5 Field testing . . . 17 3.5.1 UE testing tools . . . 17 3.5.2 Scanners . . . 17
3.5.3 Common principles and practices . . . 18 vii
viii Contents
4 Design and implementation 19
4.1 Choices in hardware and software . . . 19
4.2 Typical Symbian C++ design . . . 20
4.2.1 Graphical User Interface . . . 21
4.2.2 Engine . . . 21
4.3 System overview . . . 21
4.3.1 AppUi class . . . 22
4.3.2 Observer classes . . . 22
4.3.3 Network data gatherer . . . 22
4.3.4 GPS positioning module . . . 24
4.3.5 File operations . . . 24
4.3.6 Graphical User Interface . . . 25
5 Results 27 5.1 The application . . . 27 5.1.1 First screen . . . 27 5.1.2 Second screen . . . 29 5.1.3 Third screen . . . 29 5.2 Fields of use . . . 30 5.2.1 Standalone . . . 30
5.2.2 Together with a RAT server . . . 31
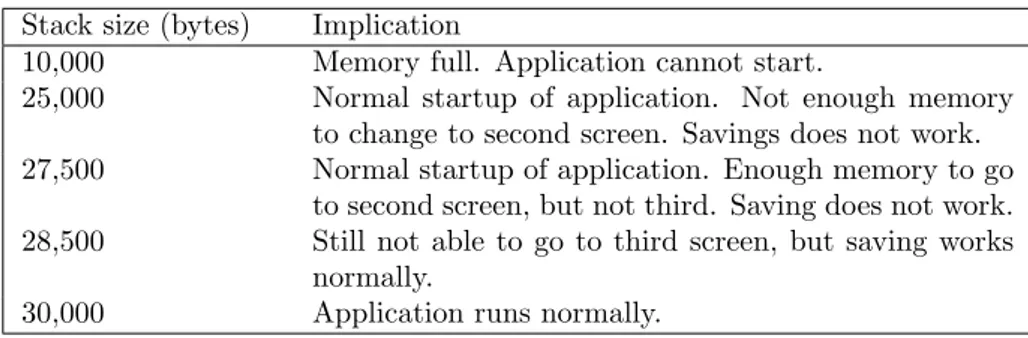
5.2.3 Shortcomings . . . 31 6 Evaluation 33 6.1 Memory . . . 33 6.1.1 Stack . . . 33 6.1.2 Heap . . . 34 6.2 CPU . . . 35
6.2.1 Performance of network data gathering module . . . 35
6.2.2 Performance of GPS location module . . . 36
6.2.3 Performance of write operations . . . 36
6.3 Usability of collected data . . . 39
6.3.1 Precision . . . 39
6.3.2 Type . . . 39
7 Conclusions and future work 41 7.1 Feasibility of application . . . 41
7.2 Feasibility and usability of collected data . . . 41
7.3 Future work . . . 41
List of Figures
2.1 TDMA multiple access method . . . 6 2.2 Cellular concept with reuse factor 5 . . . 7 2.3 WCDMA multiple access method with three different codes . . . 8 2.4 RSSI and RSCP comparision . . . 11 4.1 Typical class diagram of Symbian C++ application . . . 20 4.2 Class diagram of RAT-UE . . . 23 6.1 Aproximation of a GPS location with two adjacent locations. . . 37 6.2 Time taken to write to file on a logarithmic scale . . . 38 6.3 Time taken to write to file on a linear scale . . . 38
List of Tables
4.1 Comparision of parameters for GSM and UMTS . . . 23
5.1 UMTS parameters listed on the first screen. . . 28
5.2 GSM parameters listed on the first screen. . . 28
5.3 UMTS parameters listed on the second screen. . . 29
5.4 GSM parameters listed on the second screen. . . 30
5.5 Information available on third screen . . . 30
6.1 Memory usage for different components in the stack, in bytes . . 34
6.2 Speed and intervalls between save points when saving at different sampling rates . . . 36
List of Abbreviations
1G First Generation2G Second Generation 3G Third Generation
API Application Programming Interface
ARFCN Absolute Radio Frequency Channel Number AT Attention
BS Base Station
BSIC Base Station Identity Code CDMA Code Division Multiple Access CellID Cell Identity
CPU Central Processing Unit dB deci Bell
dBm deci Bell milli Watt Eb/No Energy to bit / Noise Ec/No Energy to chip / Noise GPS Global Positioning System
GSM Global System for Mobile communication GUI Graphical User Interface
IDE Integrated Development Environment LAC Locaiton Area Code
MCC Mobile Country Code MNC Mobile Network Code OS Operating System
OVSF Orthogonal Variable Spreading Factor PDC Personal Digital Cellular
QoS Quality of Service RAT Radio Analyzing Tool
RAT-UE Radio Analyzing Tool - User Equipment RF Radio Frequency
RNC Radio Network Controller RRU Radio Resource Utilization RSCP Received Signal Code Power RSSI Received Signal Strength Indicator RxLev Received Signal Level
RxQual Reveived Signal Quality SC Scrambling Code
SIM Subscriber Identity Module TDMA Time Dvivision Multiple Access
xiv List of Abbreviations UARFCN UTRA Absolute Radio Frequency Channel Number UE User Equipment
UMTS Universal Mobile Telecommunications System UTRA UMTS Terrestrial Radio Access
Chapter 1
Introduction
In this chapter a brief introduction on the subject is presented. Background information on the subject and motivation for the project is presented in 1.1, prior related work is mentioned 1.2, the problem statement is introduced in 1.3, a general approach for the project is handled in 1.4 and finally a thesis outline is given in 1.5.
1.1
Background
The world of telecommunication is constantly evolving and more and more complex systems are always emerging. Second and third generation networks are gradually beginning to get old, but there will still be a high demand for systems such as these for long time and neither is quite obsolete. Planning and maintaining these systems are of utmost importance for keeping a good system in smooth operation. Traditionally there has been a lot of different research regarding phenomena and complications that arise in integration of 2G/3G systems and there are a lot of tools that try to help cell planning engineers in their work.
The evolution from 2G to 3G has not been without problems, and when it comes to cell planning there are a lot of inherent differences between these two systems. An easy solution is to do co-location for 2G and 3G base station sites, which simply means that you use your old 2G architecture and real world location as a template for building your new 3G system. But due to the different situations that might arise in 3G compared to 2G networks this is not an optimal solution. Nevertheless, this is a quite extensively used technique due to its cost effectiveness [4]. This is one of the reasons why field testing and analysis of 3G systems are vital procedures in constructing and maintaining these networks.
Operators and service providers are also interested in the performance of their networks for more reasons than the maintenance of them. In order to attract customers coverage maps are usually provided in order to assure good service. The problem with these coverage maps is that they are more often than not mathematically estimated and are not actually made up from gathered field data[15]. The precision of these estimates can be very fluctuating and it would be beneficial to get actual gathered data. By gathering real world information about the systems better and more accurate coverage maps can be created.
2 CHAPTER 1. INTRODUCTION RAT, Radio Analysis Tool [28], is a newly developed application that allows for easy but powerful analysis of 2G/3G systems. Gathered field data in the form of log files are imported to the tool and plotted on maps so that the analyst can discover problematic areas in the cellular system (both 2G and 3G) and deal with them accordingly. The tool itself is a good alternative to other tools on the market, but it is however still dependant on proprietary data gathering devices such as Ericsson TEMS. The RAT application would benefit greatly from a dedicated data gathering device, preferably hand held in nature.
My thesis will deal with how to develop such an application and whether or not the achieved result is a feasible solution for the high demands of telecommunication analysis.
1.2
Related work
There has been a lot of interesting work regarding the different fields of telecommunications, but due to the natural elusiveness of telecommunication things evolve fast and new topics constantly need to be researched. However, this thesis will not handle development of new technologies as such, but rather it will handle the analysis of current systems and how to optimize them.
A good comparison between simulated and real life network data in 3G WCDMA systems was conducted by Lars N¨aslund in [17]. This study showed that with a little bit of effort it is possible to simulate a real life scenario with a tool like Matlab, but that there are a lot of factors that might affect the result. This study clearly shows that there are a lot of different factors that can affect a simulation, and if possible it would be beneficial to use real life data. As I mentioned previously it is usually favorable with real world data when making coverage maps for 2G and 3G systems, but it is still valuable to be able to make simulations as well. Other studies such as [13] explain how data can be gathered and imported into an analysis application.
1.3
Problem statement
The problem statement for this thesis will include two different but related topics.
The first topic that is to be handled is whether or not it is possible to develop an application for a hand held device, such as a mobile phone, that gathers network data for further analysis. The main problem is to identify a suitable environment and develop the application with the required capabilities. The application should be able to gather network information regarding the current cellular network and also to acquire a current location through a GPS module. The gathered data should be combined and time stamped. The application should also be able to interact with the RAT application so that more detailed analysis can be conducted at a later time. For this to be possible a joint file format must be used, and the application must be able to gather data at a satisfying intensity. The application is to be evaluated in respect to memory foot print and overall performance.
The second topic that will be handled is whether or not the data gathered from the application in the first topic is good enough for accurate system
1.4. APPROACH 3 analysis. The problem is to find out if the data gathered has enough precision and if it is relevant to the overall analysis. Different mobile phones usually have a wide range of different RF-chipsets in use and it can possibly be a problem to acquire the correct data from the specific chipset. Gathered data is to be evaluated in respect of precision and type.
1.4
Approach
The approach of this thesis is to study what kind of data that is required in the analysis of 2G and 3G systems. In order to gather the relevant data from the mobile phone, necessary knowledge about both hardware and software is required. By developing an application in an established environment it is easier to get the required APIs and documentation to complete the task. My approach will thus be to develop the application in a well-established environment having acquired extensive knowledge about cellular systems.
1.5
Thesis outline
In Chapter 2 a theoretical background for the processed technologies and systems are explained. Both second generation and third generation are covered. An explanation of cellular architectures and strategies for cell planning and optimization is covered in Chapter 3. In Chapter 4 I describe the method for development and the design of the applicaiton, and in Chapter 5 I explain the resulting application. Finally the application is evaluated in Chapter 6 and some conclusions are given in Chapter 7.
Chapter 2
Cellular radio systems
In this chapter I explain the history of the different telecommunication technologies in use today. The focus will lie on explaining radio communication between a handset and base station. I also explain how they are used and what parameters are important. In section 2.1 regarding second generation technolo-gies I describe GSM, even though there are other competing technolotechnolo-gies in use. Likewise, in section 2.2 regarding third generation technologies I will be focusing on describing UMTS and WCDMA as they are the most commonly used technologies today.
2.1
Second generation
The second generation of cellular phones got its main breakthrough with the Global System for Mobile communication (GSM) system. It was a joint operation between several large companies and official entities in Europe and it came to unify the telecommunication that had been so scattered before. Instead of using different technologies in different countries a cooperational and globally compatible system was wanted. The system was a lot more complex than any previous versions of telecommunication systems (1G), and it had to follow a strict specification if it was to be successful. In some parts of the world different standards were adopted instead of the GSM system, which can still be seen as problematic today. For instance in Japan the Personal Digital Cellular (PDC) was developed and chosen by the government. The PDC system closely resembles the GSM system in many aspects, but the systems are still not interoperable. This has lead to incompatibility issues between users of second generation systems since users of GSM and PDC technologies ca not use each others’ systems. [10, 16]
2.1.1
Multiple access
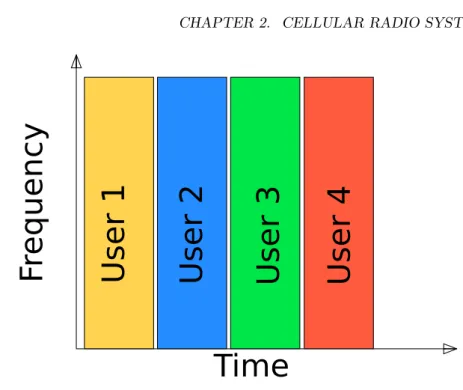
GSM uses Time Division Multiple Access (TDMA) for its multiple access method. This allows several speakers to communicate on the same frequency and it is a good way to allow for the multiple access necessary in second generation cellular networks. TDMA divides the speakers into separate time slots and allows them to speak in turns. This requires that the speakers know when they
6 CHAPTER 2. CELLULAR RADIO SYSTEMS
Figure 2.1: TDMA multiple access method
are supposed to speak so they have to able to synchronize with the base station. As depicted in Figure 2.1 we can see that several different users can share the allotted frequency spectrum.
2.1.2
Frequencies
The GSM system depend on a set of different parameters to operate, which of the signal quality and signal strength are the most important ones. To allow for several operators to offer services GSM is divided into different frequency scopes. These frequency scopes are controlled by the operator of a network. The operator further divides its frequency scope into sub-frequency scopes, so called Absolute Radio Frequency Channel Number (ARFCN). This allows the operators to differentiate between one another, and it also allows the operator to differentiate between its own base stations.
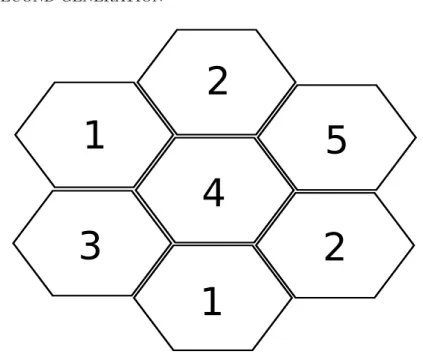
The frequency scopes needs to be carefully planned in order to have a functional network and they are ordered into a grid as depicted in Figure 2.2. The frequency planning is further explained in 3.1.1.
2.1.3
Base Station Identification
To be able to allow efficient handovers in the GSM system the mobile phone, or User Equipment, has to be able to listen to several base stations at the same time. These different base stations are identified by their Cell Identification (CellID), which can tell the UE1 in what area and network it is currently in.
The UE chooses the base station that it deems to be best and changes if it finds
2.1. SECOND GENERATION 7
Figure 2.2: Cellular concept with reuse factor 5
a new and better one. The Base Station Identity Code (BSIC) is a color code that is used by the system to differentiate between different cells.
In order to utilize the available frequency spectrum to the fullest but still be able to differentiate between neighboring cells different BSIC are reused after a certain reuse factor. In Figure 2.2 a schema with a reuse factor of 5 is presented. As seen we will be able to utilize the frequency scope with color code 1 in cells that are past the cells with codes 3 and 4.
2.1.4
Signal strength
To determine how strong a received signal is the parameter Received Signal Level (RxLev) is used. RxLev is used by the UE to determine whether or not the base station has a signal that is strong enough. It constantly monitors the available GSM BSs’ RxLev values and will use this information as a basis for changing its currently active connection. If it sees a base station that has substantially better signal strength it will change to it.
The RxLev parameter can also be described in a logarithmic unit. It is conventionally presented in dBm and can be defined as
P(dBm) = 10∗log Pin
0,001 (2.1)
wherePinis in W.
RxLev can also be presented in a more easily read version
8 CHAPTER 2. CELLULAR RADIO SYSTEMS
Figure 2.3: WCDMA multiple access method with three different codes
2.1.5
Signal quality
The Received Signal Quality (RxQual) on the other hand is the parameter that describes the signal quality. This is only applicable on the currently active connection, so there can only be one neighbor that has a measureable RxQual parameter. [16, 27, 3, 5, 14]
2.2
Third generation
Many companies and entities wanted to unify the telecommunication world and when a new system was to be developed the Third Generation Partnership Program was created. The 3G project of course wanted to improve the overall performance of the cellular network, but it also strived to be more globally compatible than the prior GSM system. Universal Mobile Telecommunications System (UMTS) was chosen as the standard and Wideband Code Division Multiple Access (WCDMA) is the most common underlying air interface for it. [10]
2.2.1
Multiple access
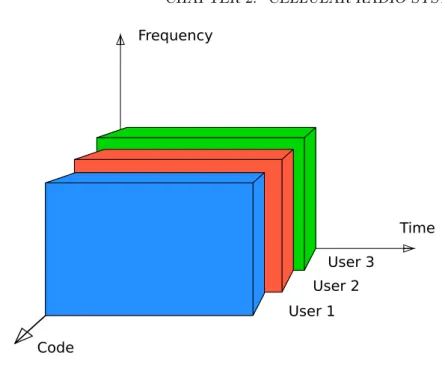
UMTS and WCDMA use Code Division Multiple Access as its multiple access method which is depicted in Figure 2.3. This allows all the speakers to communicate at once and they do not have to wait until their time slot to communicate. The different speakers are divided by codes so that the different signals can still be understood. When different speakers utilize the same frequency at the same time there will be interference however, and this will be further explained in section 2.2.8.
2.2. THIRD GENERATION 9
2.2.2
Frequencies
Similarly to GSM, UMTS also has the need to differentiate between different fre-quencies to allow for different operators to provide their different services. These frequency allocations are called UTRA-Absolute Radio Frequency Channel Number (UARFCN), where UTRA stands for UMTS Terrestrial Radio Access. A single operator can have up to three UARFCNs within its network, but is commonly preferable to not interchange between them since soft handovers are not possible between two different UARFCNs. In WCDMA a frequency band is 5 MHz wide. WCDMA, as previously described, uses code division for its multiple access mechanism which allows for several users to use the whole available frequency spectrum at once. The shared resource between UEs is the output power from the base station and the combined interference coming from the mobile phones.
2.2.3
Spreading and despreading
To better facilitate different senders and receivers utilizing the same frequency scope the process of spreading and despreading is performed on the signal. Bits from the original signal are spread into so called chips which is then despread back into bits at the receiver end. If for example a bit is spread into 8 chips you say that you have a spreading factor of 8. By spreading the signal with a selected spreading factor the signal gets distributed over the bandwidth and is more easily differentiated from other signals. The sender applies a spreading code to the signal that it wants to send, and the receiver applies the same spreading code in order to get the original signal. The despreading works in such a way that it decreases non-matching spreading codes, whilst it enhances the matching code and amplifies it with a factor of the chip rate. This factor is called the process gain.
2.2.4
Scrambling Code
Since there are usually a lot of different speakers at the same time, different Scrambling Codes (SC) has to be used on top of the spreading code. By assigning each user with a unique scrambling code from an Orthogonal Variable Spreading Factor tree (OVSF tree), several different signals can be sent and received at the same time and still be differentiable. This means that one can differentiate a handset from other handsets and a base station from other base stations.
2.2.5
Handovers
One major upgrade from the GSM system is the possibility to have so called soft and softer handovers. In GSM a handover occurred when the UE evaluated another BS to be better in terms of signal power, also called the RxLev factor. In WCDMA it is possible for the UE to be attached and be actively communicating with several BSs simultaneously. This means that there will be no gap in the communication when an old BS is getting out of range and new one is chosen instead. If there are no other BSs that will be able to continue the communication it will still work as the old GSM system. A soft handover occurs when the UE detects a better cell from another base station and switches to
10 CHAPTER 2. CELLULAR RADIO SYSTEMS it, staying in the same frequency. A softer handover (observe the difference in name between soft and softer handover) occurs when the cell to which the UE switches belongs to the same BS as the old cell. However, the hard handover method that is used in GSM is of course still usable in WCDMA systems to facilitate inter-frequency handovers and also inter system handovers (WCDMA to GSM or vice versa).
2.2.6
State
To facilitate for the handovers in section 2.2.5 the UE has to be able to determine with which base station that it is actively talking to. A notion of Active Set, Monitored Neighbor and Detected Neighbor is used. The Active Set is a set which is maintained by the RNC2 in the network and contains all the base
stations that is good enough for the UE to have an active communication with. The monitored neighbor is a list of base stations that the network offers to the UE and will be monitored. When a base station in the Monitored Set gets good enough quality it will be added to the Active Set and it can be used for communication. This list of base stations that constitutes the Monitored Neighbor list is a selection of base stations that the network considers to be of interest for the UE, but ultimately it is the UE that determines which base stations are good enough to be in the Active Set. However, every now and then the UE can detect base stations that are not in this list and that it is not supposed to be able to communicate with. These are included in a Detected Neighbor list.
2.2.7
Signal strength
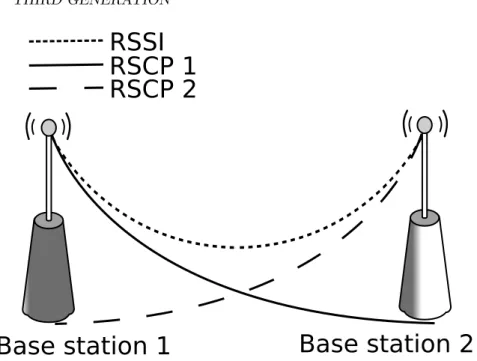
Due to the fact that you have many speakers communication at the same time there will be unwanted interference when trying to listen to a specific signal. The signal code power that the UE perceives for a given base station is called Received Signal Code Power (RSCP), which is not to be confused with Received Signal Strength Indication (RSSI) which is the sum of the signals from all base stations. We can see in Figure 2.4 that the RSSI is an accumulative value of the measurable RSCPs in the vicinity. The RSSI and RSCP are both important to take into considerations when planning a system, since too much signal power from different base stations will invariably lead to poor performance.
2.2.8
Signal quality
The ratio between the wanted signal coming from the base station that we are talking to and the distorting signals coming from other base stations including white noise3 is called Energy to Bit over Noise, or Eb/N0. This is a parameter
that is important to CDMA systems and that we need in WCDMA in order to determine the best current base station. The Eb/N0 is the best indication of signal quality for the UE. This is equivalent with how much noise we perceive, and the UE will change to another base station if it deems that there is too much
2Radio Network Controller, a node that is responsible for one or several base stations. 3White noise is the ever-present and ubiquitous static on the frequency spectrum coming
2.2. THIRD GENERATION 11
Figure 2.4: RSSI and RSCP comparision
interference. The new base station will hopefully have a better RSSI/RSCP ratio and thus the interference will be lower.
The Eb/N0 is the Energy to Bit over Noise ratio for the actual signal, whilst Ec/No is the Energy to Chip over Noise ratio after the spreading of the code. This means that the Ec/No is a better way of estimating the quality of the current base station since no despreading has taken place. Either the Energy to Bit or the Energy to Chip ratio is usable for determining how much the current base station, which we are communicating with, is being affected by noise coming from other scrambling codes (base stations) or white noise.
2.2.9
Rake receiver
There are a lot of different things that can happen in the propagation of a signal. Multipath fading and phase shifting can cause temporal but significant spots of weak signal strength. To estimate the propagation of a signal the Okumura-Hata propagation model or a derivate thereof is commonly used[8]. To reduce the effects of such problems one can use what is called a Rake receiver. By combining the input from several fingers in the rake it is possible to estimate a better signal when fractions of the signal are coming from different places. It is beneficial to do this to any signal that arrives to a UE.
Today several augmentations of the WCDMA system have been developed and the 3G technology together with these improvements has been dubbed 3,5G. [23, 11, 7, 6, 8]
Chapter 3
Cellular network
architectures
The GSM and UMTS networks that are rolled out in the world today are usually tightly interconnected and work in a similar fashion in order to ease interoperability. This chapter will deal with theory behind the architectures in which the radio technologies explained in Chapter 2 are used.
3.1
Cell planning
Planning a modern cellular network takes patience and a great deal of skill. There are a lot of things to take into consideration and there are also a lot of steps which a cell planner has to go through before good network architecture can be rolled out into the real world. In [12, pp 293] it is written that
The aim of radio network planning is to design networks that enable effective use of the existing spectrum and equipment at a reasonable cost
which sums it up pretty well. Whilst the process of doing cell tuning and optimizations improve currents network, the cell planning process is needed for initial release. This is not a topic that will be handled to a great extent in this thesis, but it is still very important to understand the process if one is to be able to improve it.
There are many fundamental and general things that you have to take into consideration in the cell planning process and that apply to both second and third generation networks, but since the systems are inherently different in the way they function there are also a lot of things that are not the same.
3.1.1
GSM
Cell planning for GSM in second generation network is quite different from planning networks in third generation networks since you have to take frequency planning into consideration. Third generation cellular networks have a great advantage in that they work on a single frequency scope, whilst second generation networks have to able to operate on several frequency sub-scopes
14 CHAPTER 3. CELLULAR NETWORK ARCHITECTURES at once. It is important to take the parameters in chapter 2 into account when planning and designing the initial network, but it is easier to make amends after initial rollout thanks to the fact that you can tweak the frequency planning later on.
In GSM networks, coverage planning and capacity planning are independent whilst in WCDMA they are correlated due to that the interference is the shared resource. This makes it easier to plan and tune a GSM network after initial rollout. Planning for coverage simply means that you have to plan so that you have sufficient RxLev signal power to be able to serve the specific cell. The signal power is directly dictating how large the cell coverage will be so it is important to plan neighboring cells signal power correctly and cohesively.
Capacity planning deals with how to allocate frequencies in an effective manner. By using different frequency sub-scopes for the different adjacent cells we can differentiate between them, something that is handled with Scrambling Codes in WCDMA. The number of frequencies between reuses is called the frequency reuse factor. One main thing to avoid in GSM networks is the phenomena of so called ping-pong base station handovers. This occurs when there are two or more base stations with relatively equal RxLev signal power output. This will offer the UE with several eligible choices in main base station which might lead to that it does more handovers than is actually necessary.
When you have correctly planned a good GSM network you will have cells that utilize as much of the frequency scope as possible, whilst still being able to provide good and consistent coverage.
3.1.2
UMTS
The main thing that has to be in mind when it comes to planning WCDMA networks is the power planning. As described in Chapter 2, the power controls how much Eb/No (interference) we will get in the system so it is crucial that we have correct power levels for the base stations. If we do not have correct power planning, we can experience phenomena such as dominant base stations that lead to poor capacity for other base stations in the area. Other phenomena such as cell breathing can be crucial and they have to be able to be handled by the system.
In contrast to GSM, WCDMA systems need to take both coverage and capacity planning into consideration at once and no differentiation between the two is possible. We can see that they correlate and that a higher interference in the system leads to a smaller cell coverage as well as a smaller capacity.
Since we use the CDMA multiple access method in WCDMA that utilizes Scrambling Codes to differentiate between speakers we can utilize the whole frequency spectrum at once. This means that unlike GSM we do not have to worry about frequency planning. The thing that we will have to worry about when it comes to frequency scopes is that each operator can have several UARFCNs as explained in section 2.2.2. This means that in certain areas we can have a GSM-like hard handover between the frequencies as explained in section 2.2.5. Similarly to GSM the re-use factor indicates at what frequency the cell identities are reused, but now of course it applies to the Scrambling Codes instead of the Frequency sub-scopes.
Instead of worrying about frequency planning the system only has to worry about the power output from the base stations. This might sound like it is much
3.2. CO-LOCATION AND CO-SITING 15 simpler to plan a WCDMA system, but thanks to a number of other factors it is still considered more complex to deal with WCDMA systems. The system will automatically try to adapt to the active users so the amount of available output power from the base station will vary as it tries to lower the interference whilst still providing good enough power. This can lead to massive fluctuations in the system called cell breathing where the amount of output power from a base station rapidly oscillates, and thus contracting and expanding the coverage area.
The subsequent configuration is more difficult to alter in UMTS networks compared to GSM, but [19] concludes that it is quite possible to amend configurations e.g. by changing antenna directions. [12, 24]
3.2
Co-location and co-siting
Co-location is when you share a physical location for UMTS and GSM hardware. It is usually practically easier and cheaper to have all or most of your hardware at once physical location as it will ease maintenance and configuration.
Co-siting on the other hand is when you both share the location and the equipment being used. This means that the same antenna and the same hardware will be in charge of both technologies at once.
The practice of co-siting sites is not always optimal because of the differences between the GSM and UMTS systems. This is however a common practice because of economical feasibility and as we have seen in section 3.1.1 it is quite possible to amend the site later. We will also see that due to frequent practice of co-location and co-siting we will invariably have to do a lot of cell optimization with field tests after initial rollout. Cell optimization will be handled in section 3.4 and field testing will be described in section 3.5.
3.3
GSM and UMTS interoperation
The main strategy for most operators around the world is to build a new 3G network on top of an old well structured 2G network. This means that initially 3G systems will mostly be seen in highly utilized urban areas. But to still be able to serve the customers 2G service is provided outside of the 3G areas. This means that the system has to be built on top of each others, and that they need to able to interoperate flawlessly.
Handovers between 3G and 2G systems are called inter-system handovers. It is crucial that this is handled as smoothly as possible and though it is perhaps not as unproblematic as a soft or softer handover in a WCDMA it must still be able to accommodate a speech call without dropping the call.
This interoperability is feasible mainly due to the similar architectures of the UMTS and GSM system described in 3. We see that the fundamental features such as routing stations and information bases about the users’ current active cells are the same. This means that both an operator can utilize these architectures for both GSM and UMTS services which provides interoperability between the systems.
For this purpose it is usually good for a network operator to have joint plans for both GSM and UMTS networks. [25]
16 CHAPTER 3. CELLULAR NETWORK ARCHITECTURES
3.4
Cell optimization
With the potentially flawed systems that we end up with after an initially planned cellular network it is usually necessary to do some tuning and optimization. In doing so the provider can keep running a good running network and provide customers with the services they need. We have seen in 3.1 that most networks usually need continuous maintenance due to complexity in the network and we will briefly go through the different benefits that come with cell optimizations.
3.4.1
Initial tuning
After initially constructing a network but before actually rolling it out to the public initial tuning of the original plan has to be performed. Simulations and propagation models will not always predict the reality with good enough precision so it of course important to amend for these imperfections. However important, this initial procedure will not be analyzed further in this thesis since the process itself is so similar to the cell optimizations performed at a later stage.
3.4.2
Continuous optimization
To be able to maintain a good cellular network that probably is expanding it is important to continuously analyze the system. This can be done either by gathering actual network data from the system itself and building a model that estimates the coverage and capacity and so on. But when the problems get to complex it is always better to have a real life overview of the system. By doing field testing and getting readings from actual hot spots one can better see when and where problems arise. This allows engineers to rapidly assess the situation and act upon it. [12, pp 395] describes it as:
The rapid transition from prediction-based performance estimation to measured facts about the network and service performance are the essence of operational efficiency.
With the rapid and extensive change from second to third generation of networks there are quite few new things that have to be considered when it comes to cell optimization as well. The most important of which is the frequent change into packet based data with a lot of different kinds of services. Parameters such as QoS1 for each of the different services are things that the operator wants to focus on to able to optimize the earnings for a specific traffic profile. There are different kinds of situations that the different operators want to be able to handle. For example one operator could be focusing on good coverage whilst another one tries having better quality and faster links in order to compete and gain customers.
The Radio Resource Utilization (RRU) is a theoretical term that describes the utilization of the radio spectrum. The operator’s role is to optimize its network within the RRU in order to get the feature that it wants, for instance better coverage. When the operator adds new base stations or new services it is
3.5. FIELD TESTING 17 of course important to keep the focus on the kind of quality and coverage that it wants to offer. [12]
3.5
Field testing
Today there are a number of different field testing tools from different companies, many of which have been around for a long time. The main purpose of a field testing tool is to gather a lot of real life traffic data from the networks that you operate in order to spot problems and of course to do general cell optimizations as described in section 3.4. Perhaps the easiest way of doing this is to go by car and driving around the area of interest while constantly logging the network and saving it together with a GPS-location stamp and a time stamp.
3.5.1
UE testing tools
A field testing tool can take many shapes, ranging from entire vans to simple handsets. What I will focus on in this thesis is the UE simple handset type of testing tool. Most of the new modern cellular phones released today have a built in field engineer mode or a field test mode, which can aid the manufacturer of the phone to discern if the phone is of good quality or not. This information however is not always sufficient for network operators since they usually need more extensive information and the capabilities of saving the gathered data together with a GPS location stamp. For this purpose there are a handful of developers that specialize in making analyzing tool aimed for operators that want to analyze and optimize their networks.
In order to be able to do the optimizations described in section 3.4 there are a lot of information that has to be gathered. The continuous feedback loops usually only needs rather general information such as the signal quality and signal strength in a given sector, but if a more specific problem in the network occurs it is favorable with detailed information about what happened. Information such as dropped call percentage and event information on lower layers help provide the person doing the analysis to come up with the reason for the problem and hopefully a way of mending it.
Since the cellular network is a rather complex of base stations and controllers it might be insufficient to only rely on field testing data to completely improve the entire network. Irregularities observed at individual base stations can be the result of deeper and more complex problems, such as improper spreading factors etc.
Nonetheless, the extensive deployment of field engineers with field testing tools remains an important part of the overall network maintenance and of course to the cell optimization process.
3.5.2
Scanners
A scanner does exactly what it sounds like, it scans the networks. These kinds of tools are perhaps not as useful in many cases as the normal UE type of scanning devices because pure scanner devices do not interact with the network. This means that phenomena that would occur when using a UE tool will not be able to occur. Because scanners do not have to register on the network like typical
18 CHAPTER 3. CELLULAR NETWORK ARCHITECTURES UE handsets do it can be useful to use a scanner when you want to observe the network as a whole. Although scanners can be useful they are not that frequently in use anymore as most problems that need solving can be analyzed with the help of UE handsets. For this reason scanners will not be handled further in this thesis.
3.5.3
Common principles and practices
Due to the random nature of the users of cellular phones it is important to do field testing that also tests randomly and evenly distributed over the network. By gathering more and more data it is also easier to get a good overview of the network as the utilization generally change over time. By following local traffic and high density commuter lines one can get good readings as it can be assumed that these areas are also more likely to utilize the cellular network.
Chapter 4
Design and implementation
This chapter deals with the overall design problems that were encountered when developing the RAT-UE application and the resulting design ready for implementation. In order to develop such a specialized application as a network data gatherer for GSM/UMTS networks one has to pay respect to the constraints and the possibly limited number of options in the development process. Access to a specific radio chipset is not something that is readily available for normal developers without approved partnership programs with the vendor, so in order to be able to develop anything at all one has to consider the possibilities of gaining access to the radio chipset.4.1
Choices in hardware and software
Initially a number of different hardware architectures were considered for the development of the RAT-UE application because naturally all cellular phones have access in one way or another to the required data that I wanted. This data is used by the handset in order to operate on the network and it uses parameters such as Ec/No and RSCP to determine which base station to communicate with. But it is not for certain that this information is available at all to a programmer, and in fact some open source platforms such as Google Android phones use a dedicated locked and unavailable CPU for radio communication so that no network data can be accessed. [9]
Vendors usually have their own versions of field testing tools that access this kind of data. By having such an application the vendor can use it to check the hardware for flaws.
So, the choice in hardware really becomes dependent on the software that is run on that specific hardware. One needs to gain access to the network data layer through the use of hardware specific APIs. This means that as long as the developer does not have specific requirements when it comes to hardware anything can be suitable as long as details on how to obtain the required data is available.
I have analyzed and tested a range of different mobile phones to see which were suited for this kind of application development and I concluded that any modern phone with reasonable performance is acceptable.
The usage of the Java programming language in some cases can ease simple 19
20 CHAPTER 4. DESIGN AND IMPLEMENTATION
Figure 4.1: Typical class diagram of Symbian C++ application
tasks and standardized parameters such as the Cell Information parameter. Like AT-commands1, these commands have been standardized to allow for ease of access. The problem with the more advanced parameters are hardware specific, so using Java or C-sharp like programming languages are not going to help unless you already have obtained an Application Programming Interface (in which case the programming language is irrelevant).
We were fortunate enough to obtain an API from Nokia to develop for Symbian S60 Feature Pack 2 devices so I decided to go with Nokia phones in developing my application. Unfortunately, the API is classified and cannot be discussed further in this public domain thesis.
What can be discussed is the platform on which the API is run and how to design an appropriate system that deals with this kind of data.
4.2
Typical Symbian C++ design
Applications developed in Symbian C++ for Nokia phones are known to be safe and secure when it comes to resource allocation. It is also very secure when it comes to certificates and all complex applications with privileged features must go through the Symbian Signed process.[26] The development process can however be considered to be a bit complicated and it has quite a long learning curve with many important differences in how a normal C++ application is written. The respect for memory allocation and possible memory shortage problems constantly has to be kept in mind by the programmer.
Nokia has released an IDE for programming in Symbian C++ called Carbide++ and is available for free at [20]. This is a derivate from the popular Eclipse IDE and has a lot of extensions to allow for the requirements posed by Symbian C++.
4.3. SYSTEM OVERVIEW 21
4.2.1
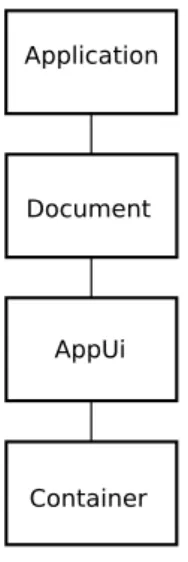
Graphical User Interface
The typical Graphical User Interface application in Symbian C++ comes with a set of standardized classes that cannot easily be modified. They form a hierarchy with the AppUi-class at the bottom from which so called containers are created. A container is a visual element onto which information can be displayed. When the Carbide++ IDE starts a new project it will generate the necessary classes and if the programmer follows the paradigms it should not be too much of a hustle to develop a typical Symbian C++ application, although problems can arise if the coding conventions are not followed.
4.2.2
Engine
Symbian C++ recommends using an engine-class that does most of the computation that is later returned to the main AppUi object. From here information can be sent to the container-object to be displayed graphically. By doing so the complexity of the application is moved away from the AppUi and the standard Symbian C++ classes. This allows for code that is more easily overviewed by other programmers and helps in migration to possible succeeding developers. [2, 1]
4.3
System overview
For my application I have tried to conform to the recommended programming paradigms, and I have aimed to develop a program as similar as possible to the described application in section 4.2. The most important thing that I had to focus on was the network data gatherer and the GPS module and of course how to process the collected data. The network data gatherer and the GPS module are two different classes, both instantiated from the typical engine-class. This collected data has to be presented to both a graphical user interface as well as written to a file for later analysis.
The main goals for this design are thus;
1. To obtain network data through the usage of a proprietary API. 2. To obtain location information through the usage of a public API. 3. To merge the above information and write it together with a time stamp
to an exterior file.
All of these three steps are equally important in the creation of an application that will be able to interoperate with the RAT software. An application that does not use the GPS positioning is very interesting however and could be of great use in locations where no GPS signal is available such as subways. This will however not be considered further in this thesis and the GPS module is considered to always be in use.
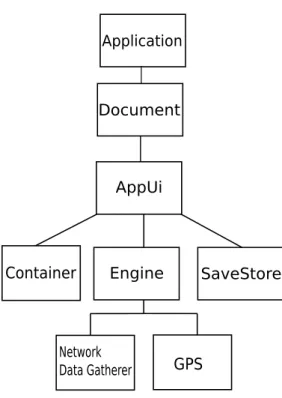
The engine class uses Symbian C++ Active Objects, which are schedulable entities within the current thread. This means that we can have thread-like operation in the application and thus allow for the network data gatherer and GPS module to operate in parallel. Symbian C++ coding paradigms strongly advice not to create new threads from within an application due to the limited
22 CHAPTER 4. DESIGN AND IMPLEMENTATION resources, but Active Objects is a good substitute. As seen in Figure 4.2, the actual class hierarchy is fairly similar to the typical Symbian C++ application with exception for the SaveStore class for file operations which is separated from the engine. [22]
4.3.1
AppUi class
The AppUi class can be seen as to contain the main central entry function, although there are other Symbian C++ generated classes higher in the hierarchy. These are the Document class and the Application-class which contain Symbian specific information for the phone such as locale and settings. From the AppUi a number of options regarding the application can be modified. Different commands such as what should happen when a certain button is pressed are also handled in the AppUi-class.
Since the AppUi-class acts as the entry point of the application we need to instantiate our objects from it. The parallel running network data gatherer and the GPS module are both so called Observer objects which will return values on a periodic interval. Most of the complexity of the application should be contained in the Engine-class however but we still need to instantiate other objects that we are going to use including the SaveStore-class and the different Containers for the graphical user interface. The Network Data Gatherer-class and the GPS location-class, both of which are contained in the Engine-class, are handled in section 4.3.3 and section 4.3.4 respectively. The SaveStore-class which handles file operations is handled in section 4.3.5, and the Graphical User Interface with all of its classes is handled in 4.3.6.
4.3.2
Observer classes
Observer classes are classes that have an associated observer. This allows us to acquire data asynchronously as the Symbian Active Object will run on an event driven manner. The frequency that the Active Objects will run and alert the Observer class can be configured. The Active Objects notion is a scheduling mechanism that allows us to run parallel code so that we do not have to worry about in which order we want to obtain data.
The engine acts as the observer for both the Network Data Gatherer and the GPS so that when either of these returns a result it will run the appropriate handler function.
4.3.3
Network data gatherer
The network data gatherer is one of the key modules in this application and it is instantiated from the engine class as depicted in Figure 4.2. This module will acquire data regarding the GSM or UMTS network that it is attached to and return the results to the AppUi class.
According to Chapter 2, the most important parameters that we want to gather are those relating to signal power, signal quality and a list of neighbors with those corresponding parameters. These are similar in 2G GSM and 3G UMTS, and the similarities are listed in Table 4.1.
The network data gatherer systematically and periodically goes through all of the available frequency scopes in a loop. Within each frequency scope loop
4.3. SYSTEM OVERVIEW 23
Figure 4.2: Class diagram of RAT-UE
Table 4.1: Comparision of parameters for GSM and UMTS
Technology GSM UMTS
Signal Strength RxLev RSCP
Signal Quality RxQual Ec/No
Frequency scope ARFCN UARFCN
Base station differentiation BSIC Scrambling Code
Timing Advance TA N/A
an additional nested loop goes through each available scrambling code. From this nested loops we get all the potential base stations. The potential base stations that provide us with some information are obviously present in the real world and we store the information for later use, whilst the ones that lack any information are merely unused scrambling codes in the OVSF tree and no base stations are present there.
As seen in Table 4.1 we can see that many of the parameters can be considered equivalent which eases the handling of the network data gathering process. Additionally the general information such as Cell ID and Mobile Network Code etc will obviously be handled in the same fashion for both 2G and 3G.
24 CHAPTER 4. DESIGN AND IMPLEMENTATION
4.3.4
GPS positioning module
With the introduction of Feature Pack 2 to the third generation of the Symbian S60 operating systems it got easier for developers that wanted to create applications that utilize location services. The GPS module in my application is based on a simple example application that queries the GPS for a GPS location update. The frequency of which this can be done can be changed but is theoretically supposed to be the same as the frequency of which the data is acquired in the network data gatherer. At an initial stage this frequency will be set to one second, but whether or not this is optimal will be evaluated in section 6.2.2.
There are a large number of parameters that the GPS location interface can provide, such as bearing and speed, but in the RAT-UE application only the Longitude and Latitude will be required. Also obtaining and saving the Latitude would of course present us with a 3 dimensional representation of where the phone has been, but since the RAT PC application only handles Longitude and Latitude this data is irrelevant. More extensive GPS data can however be obtained through a menu option in the RAT-UE application for a more pleasant user experience.
Due to the fact that both the previously explained Network Data Gatherer-class and the GPS-Gatherer-class are both Active Objects with a dedicated Observer they can operate independently. The application is designed so that these two classes are queried at the same frequency, but the functionality could very well be extended to read for example three times from the network data gatherer for every GPS position acquired. This is however not evaluated further. [18]
4.3.5
File operations
The file operations necessary for this application are handled in the SaveStore class. The key features are to be able to create a new file and append data from the network data gatherer and the GPS location. Also error prevention and basic file operation assistance such as naming a file with a desired file name is handled here.
This class is directly attached to the AppUi class and can therefore easily be accessed from menu options and such. Although it is not included in the Engine class as proper Symbian C++ coding paradigm would have suggested it is still easily managed.
In order to be able to create a usable file, the data from the network data gatherer and the GPS location module has to be combined. This can prove to be problematic in the sense that both modules have to be able to deliver results to the SaveStore at the same frequency. We would not want to have the same location for two different readings from the network data gatherer unless we are not moving.
It is also necessary to have a correct file format in the output if the RAT PC application is to be able to process the data and analyze it. In our file format we statically add the parameters from 2G and 3G together with a GPS location and a time stamp. The static nature of this solution means that we are going to have empty fields for the columns that are not in use leading to an unnecessary large file size. A dynamic solution is briefly discussed in the future work section 7.3.
4.3. SYSTEM OVERVIEW 25
4.3.6
Graphical User Interface
The graphical user interface plays an important role in the overall user experience. It is the single entity that supplies the end user with information and naturally has to be able to present the relevant data so that it is easy to understand it. The application will utilize many of the standard Symbian S60 visual elements, such as tabs, label texts and menus.
To better accommodate the different types of data from the network data gatherer a set of views will be used. These are incorporated into the tabs so that switching between the views will be as simple as possible. The main view will contain general information about the phone and the primary cell to which the phone is communicating with. In an additional view the neighbor list will be displayed and in a third there will be general application information such as version number etc.
Chapter 5
Results
In this chapter I show the final RAT-UE application and what it is capable of. I will present how the implementation actually turned out. The short comings that were not implementable and the reasons for them not being implemented are discussed.
5.1
The application
The final application that was designed and implemented in the previous chapter is a tool for gathering data about the cellular network to which one is connected. This can be either a GSM or UMTS network and the application can be used either as a standalone device for engineers that is using it when they are out in the field, but it can also be used in conjunction with the RAT PC application for advanced post processing. Depending on the SIM-card used it will show the information for that operator’s network and should the engineer want to acquire information about another network a corresponding SIM-card has to be used.
5.1.1
First screen
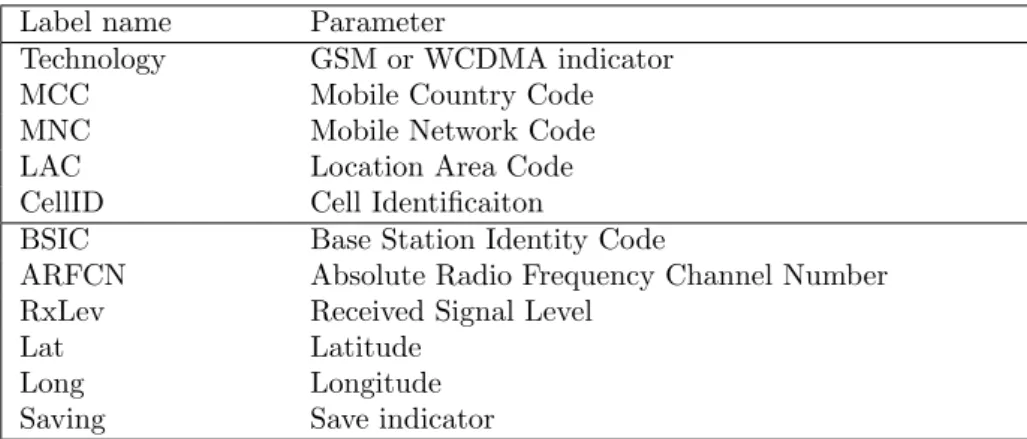
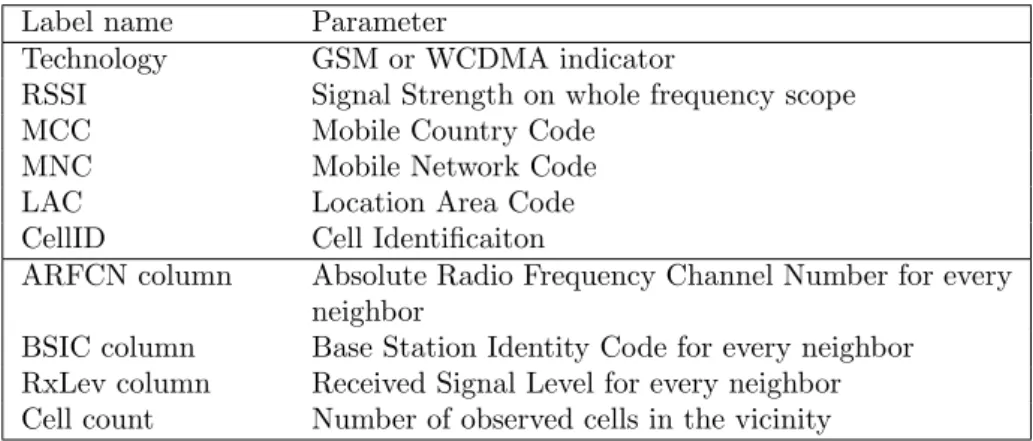
Since the application is built for the Symbian S60 operating system it is similar to other such applications. It has a set of tabs for navigation and menus for options. To switch between the tabs the Right or Left button is pressed. The first screen shows the user relevant information about the hand set status and its directly connected neighbor. The application automatically switches between UMTS and GSM operational mode once it detects it. If one technology is preferred this has to be set in the Symbian OS itself, a feature that is not always available. The parameters that are shown on the first view of the application for UMTS are presented in Table 5.1.
For GSM operations the same fields are used and mapped according to the design in section 4.3.3 The corresponding parameters are shown in Table 5.2.
There are also two graphs displayed on the first tab when in UMTS mode. They respectively display recent EcNo and RSCP activity for the last 24 entries and are color coded. The color codes are taken from an arbitrary color gradient ranging from green to red as the values deteriorate. Since the application gathers a new value every second, the graphs show a new value each second as they get
28 CHAPTER 5. RESULTS
Table 5.1: UMTS parameters listed on the first screen. Label name Parameter
Technology GSM or WCDMA indicator
RSSI Signal Strength on whole frequency scope
MCC Mobile Country Code
MNC Mobile Network Code
LAC Location Area Code
CellID Cell Identificaiton
PSC Primary Scrambling Code
UARFCN UTRA Absolute Radio Frequency Channel Number EcNo Energy to Chip over Noise ratio
RSCP Received Signal Code Power
Lat Latitude
Long Longitude
Saving Save indicator
Table 5.2: GSM parameters listed on the first screen. Label name Parameter
Technology GSM or WCDMA indicator
MCC Mobile Country Code
MNC Mobile Network Code
LAC Location Area Code
CellID Cell Identificaiton
BSIC Base Station Identity Code
ARFCN Absolute Radio Frequency Channel Number RxLev Received Signal Level
Lat Latitude
Long Longitude
Saving Save indicator
updated. When new values are showed old ones are pushed to the side, and once they get past the final position in the graph it will be removed. This allows the user to see the values for the last 24 seconds and it simplifies the process of identification and to assess recent activity or hotspots. These graphs are not available in GSM mode.
The options available from the options menu are accessible with a press on the left options button. There are options for starting and stopping the saving of the data and the option of naming the save file. There is also an option for including a Filemark into the save file which works as a personal note if the user wants to save a note for later referral. The filemark will be saved together with the other data, so the application has to have started to save before it can be used. Other options for the save operations include which drive that is going to be used and information about how much memory is remaining. Through the Graph option menu the user can choose whether to show the graph or not. From the GPS option menu the user can choose to reinitialize the GPS acquisition.
5.1. THE APPLICATION 29 Finally there is an exit option that exits the application. Exiting the application will also stop the saving process so the user does not have to manually stop to save.
5.1.2
Second screen
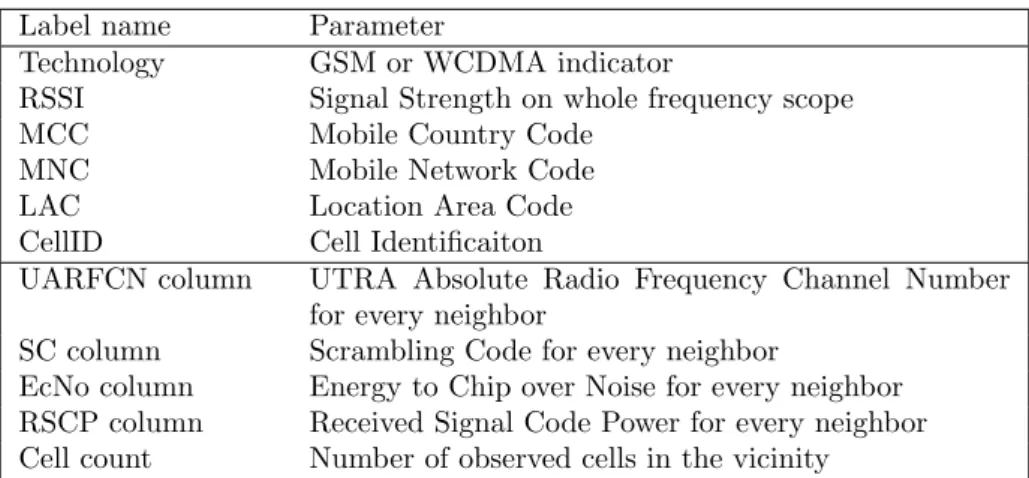
The second screen shows the neighboring cells. The data is presented in a list and the values are updated every second from the Network Data Gatherer module. This view is particularly interesting for field engineers as it displays the currently active neighboring cell on top and the rest of the cells sorted according to best EcNo value. In UMTS mode, one can see for instance if there is a lot of interference on our primary neighbor coming from other neighbors. The general network information from the first screen is also displayed on this screen. The parameters that are presented on this screen in UMTS mode is presented in Table 5.3. There are no options in the option menu on this screen.
Table 5.3: UMTS parameters listed on the second screen. Label name Parameter
Technology GSM or WCDMA indicator
RSSI Signal Strength on whole frequency scope
MCC Mobile Country Code
MNC Mobile Network Code
LAC Location Area Code
CellID Cell Identificaiton
UARFCN column UTRA Absolute Radio Frequency Channel Number for every neighbor
SC column Scrambling Code for every neighbor
EcNo column Energy to Chip over Noise for every neighbor RSCP column Received Signal Code Power for every neighbor Cell count Number of observed cells in the vicinity
The GSM mode is again handled similarly with the general network information remaining and the other parameters mapped according to the design in section 4.3.3. Table 5.4 shows the available parameters on the second screen.
5.1.3
Third screen
The third and final screen displays general information about the application. The contents are listed in Table 5.5.
When the application is first started the user is prompted whether to start saving or not. If choosing to do so, the saving of network data and the GPS modules will be started. This can also be started manually later. Since initial GPS acquisition can take some time the user is alerted to this. The user is graphically shown on the first screen whether or not the saving is initiated with a color bar. Similarly a bar indicates whether or not the GPS is in use.
30 CHAPTER 5. RESULTS
Table 5.4: GSM parameters listed on the second screen. Label name Parameter
Technology GSM or WCDMA indicator
RSSI Signal Strength on whole frequency scope
MCC Mobile Country Code
MNC Mobile Network Code
LAC Location Area Code
CellID Cell Identificaiton
ARFCN column Absolute Radio Frequency Channel Number for every neighbor
BSIC column Base Station Identity Code for every neighbor RxLev column Received Signal Level for every neighbor Cell count Number of observed cells in the vicinity
Table 5.5: Information available on third screen Label name Meaning
Version Current version number
GPS The status of the GPS module. Indicates either ”Active” or ”Not active”.
No. of Saved Entries Number of saved entries since start of a new file. This will be reset once a new file is started
MemCard Remaining
Remaining memory on the memory card (if present) Phone memory
Re-maining
Remaining memory on the phones internal memory
5.2
Fields of use
There are two primary fields of use for the RAT-UE application. The first one is for field use when an engineer actively analyses the information displayed through Graphical User Interface. The second is for post processing in the RAT application in which case the device does not have to be monitored when gathering data.
5.2.1
Standalone
As a standalone application the RAT-UE allows the user to quickly gain access to information about the cellular network. Depending on the SIM-card used the monitored network can be changed. The engineer can then easily observe the status of the network at the current location. Hotspots can be saved with the use of filemarks so that the interesting spot is not forgotten. The graphs will pedagogically allow even untrained users to assess whether the current signal quality and signal strength is good or bad. For the more advanced users and for the field technicians the cell listing on the second screen will allow the user to detect areas that may need attention and further cell optimization. If during a field test the engineer deems the hotspot to be of interest he can order a more
5.2. FIELDS OF USE 31 extensive cell analysis.
The tool is also useful for assurance of adequacy in locations with ques-tionable quality. This can be done within a company’s own premises or at a customer’s location. By just bringing the RAT-UE enabled device to the questionable location one can promptly see if the quality is adequate or not.
When utilizing RAT-UE in this manner the GPS feature might not be considered to be a fundamental part as the user normally knows where he or she is. But for further analysis with the RAT pc application it is essential.
5.2.2
Together with a RAT server
When the RAT-UE application is used in conjunction with a RAT pc application the graphical user interface is not as important as the interoperability between the RAT-UE and the RAT pc application. The RAT-UE enabled device will assumingly be placed in a fixed location for a long time so graphical presentation is not necessary. By placing the UE in a taxi or in some other form of public transport such as trains or buses a large amount of data can be obtained with little effort.
To view field test done with a RAT-UE on the RAT pc application one simply has to import the generated files. With the longitude and latitude the measurements are plotted on a map and the user can easily see the quality for different areas. All the different parameters that are saved by RAT-UE can be assessed and plotted unto the map with appropriate color coding.
The GPS acquisition is much more essential when operation together with a RAT-server. If you do not save the position where you did you measurements it is in many cases not valuable data as the location of the potential troublesome spots is crucial. There are exceptions however, for instance when doing measurements underground or inside buildings. For this purpose the filemark feature is very helpful. It allows the user to distinguish places of interests and it can be used to save land marks such as subway station names. Another use case is when doing indoor readings when filemarks can be mapped to locations on a predefined map of the building. In this case the sequential filemarks can represent sequential readings of different rooms in the building.
Using RAT-UE together with the RAT pc application also allows the user to generate coverage maps for the cellular network. This can be interesting for competing operators that want to assure their coverage of their services. Traditional coverage maps that are provided are based prediction models and are naturally not always accurate. By actually measuring the quality and signal strength more accurate coverage maps can be presented.
5.2.3
Shortcomings
The developed application strives to be true to the design in the previous chapter. However, there are some things that could not be completed and must be addressed. The implications of these shortcomings will be evaluated in Chapter 6.
The first and most substantial shortcoming is the lack of state information in the WCDMA information. This State-parameter is described in section 2.2.6 and would show us which kind of neighbors we have. These different kinds of WCDMA neighbors can be either Active Set, Monitored Neighbor or
32 CHAPTER 5. RESULTS Detected Neighbor and supplies the user with more extensive information about the system. In GSM systems this parameter is not applicable since we only have one neighbor belonging to the would-be Active Set, namely the neighbor we are communicating with.
The signal quality indicator for GSM, RxQual, is also not available. This means that we cannot perform accurate signal quality analysis, but as mentioned in section 2.1.5 this is not as important as in the WCDMA case. The implications of this short coming will be evaluated in Chapter 6.
The last substantial shortcoming that the application suffers from is associated with the GPS hardware. The subsystem is only able to supply us with location updates once every second. Since the final output is a merge consisting of network data from the network data gatherer module and the location data from the GPS location acquisition module we could potentially get output files with several entries with the same GPS location data.