Faculty of Applied Sciences
Advanced Interactive
Visualization Approach for
Component-Based Software
Ing. Jaroslav ˇ
Snajberk
Doctoral Thesis
in partial fulfillment of the requirements
for the degree of
Doctor of Philosophy
in specialization
Computer Science and Engineering
Supervisor:
Doc. Ing. Pˇremysl Brada, MSc. Ph.D.
Fakulta aplikovan´
ych vˇ
ed
Advanced Interactive
Visualization Approach for
Component-Based Software
Ing. Jaroslav ˇ
Snajberk
Disertaˇcn´ı pr´
ace
k z´ısk´
an´ı akademick´eho titulu
doktor
v oboru
Informatika a v´
ypoˇcetn´ı technika
ˇ
Skolitel:
Doc. Ing. Pˇremysl Brada, MSc. Ph.D.
Pˇredkl´ad´am t´ımto k posouzen´ı a obhajobˇe disertaˇcn´ı pr´aci zpracovanou na z´avˇer doktorsk´eho studia na Fakultˇe aplikovan´ych vˇed Z´apadoˇcesk´e univer-zity v Plzni.
Prohlaˇsuji t´ımto, ze tuto pr´aci jsem vypracoval samostatnˇe, s pouˇzit´ım odborn´e literatury a dostupn´ych pramen˚u uveden´ych v seznamu, jenˇz je souˇc´ast´ı t´eto pr´ace.
V Plzni dne ... Ing. Jaroslav ˇSnajberk
This thesis deals with the topic of component-based application structure visualization. Use of components can improve organization and clarity of application architectures by encapsulating the implementation details. Soft-ware architects can thus work on higher level of abstraction, where they cre-ate new applications by simply assembling them from smaller parts. How-ever in recent research only a small amount of focus was given to how these component-based applications could be visualized.
This thesis offers a solution to this deficiency in the form of a new visualiza-tion approach called AIVA (Advanced Interactive Visualizavisualiza-tion Approach), targeted specifically to software components. It works with a sufficient amount of detail about them that can help architects understand all compo-nents in an architecture more deeply. At the same time it is focused on how to show these details without increasing the complexity of the final compo-nent diagram. Various interactive techniques are used to lower the diagram complexity below a standard level used in other diagramming approaches while providing more information. These techniques are also used to provide all information as soon as possible, resulting in a faster learning process. As part of this work, the new visualization approach was evaluated using a case study concerning the complexity of the resulting diagrams and by a user study of its performance. The results of these studies showed that AIVA leads to less complex diagrams with a structure that is better readable than what UML can offer. It also proved that users are able to work faster in AIVA when analyzing component-based applications: they find answers three times faster in AIVA than in UML.
Tato dizertaˇcn´ı pr´ace se zab´yv´a probl´emem zobrazov´an´ı struktury kompo-nentov´ych aplikac´ı. Pouˇzit´ım komponent se d´a zlepˇsit uspoˇr´ad´an´ı a ˇcitelnost architektury aplikace d´ıky zapouzdˇren´ı implementaˇcn´ıch detail˚u. Softwarov´ı architekti tak mohou pracovat na vyˇsˇs´ı ´urovni abstrakce, na kter´e mohou vytv´aˇret nov´e aplikace jednoduch´ym skl´ad´an´ım z menˇs´ıch ˇc´ast´ı. Ve v´yzkumu je vˇsak vˇenov´ano jen velmi m´alo ´usil´ı tomu jak tyto komponentov´e aplikace zobrazit.
Tato pr´ace nab´ız´ı ˇreˇsen´ı tohoto nedostatku formou nov´eho pˇr´ıstupu k zob-razov´an´ı nazvan´eho AIVA (Advanced Interactive Visualization Apprach – Pokroˇcil´y interaktivn´ı pˇr´ıstup k zobrazov´an´ı), kter´y je specificky navrˇzen pro zobrazov´an´ı softwarov´ych komponent. AIVA pracuje s dostateˇcn´ym mnoˇ z-stv´ım detail˚u, kter´e mohou architekt˚um pomoci porozumˇet vˇsem kompo-nent´am v´ıce do hloubky. Z´aroveˇn se AIVA zamˇeˇruje na to, jak tyto infor-mace zobrazit bez toho, aby se zv´yˇsila komplexita v´ysledn´eho komponen-tov´eho diagramu. AIVA k tomuto ´uˇcelu se vyuˇz´ıv´a kombinace rozd´ıln´ych interaktivn´ıch technik, kter´e umoˇznily sn´ıˇzit nepˇrehlednost diagram˚u jeˇstˇe pod standardn´ı ´uroveˇn jin´ych zobrazovac´ıch pˇr´ıstup˚u. Nav´ıc AIVA posky-tuje v´ıce informac´ı o zobrazen´ych komponent´ach. Tyto interaktivn´ı tech-niky z´aroveˇn zpˇr´ıstupˇnuj´ı vˇsechny informace co nejrychleji, coˇz zrychluje cel´y uˇc´ıc´ı proces.
V r´amci t´eto pr´ace probˇehla evaluace tohoto nov´eho pˇr´ıstupu k zobra-zov´an´ı vytvoˇren´ım pˇr´ıpadov´e studie, kter´a se zab´yv´a sloˇzitost´ı v´ysledn´ych diagram˚u, a uˇzivatelsk´e studie testuj´ıc´ı rychlost tohoto pˇr´ıstupu. V´ysledky tˇechto studi´ı uk´azaly, ˇze AIVA produkuje m´enˇe komplikovan´e diagramy s l´epe ˇcitelnou strukturou aplikace, v porovn´an´ı s t´ım, co m˚uˇze nab´ıdnout UML. Z´aroveˇn se prok´azalo, ˇze uˇzivatel´e jsou schopn´ı pracovat rychleji v n´astroji AIVA. Pˇri anal´yze komponentov´ych aplikac´ı nach´azeli odpovˇedi tˇrikr´at rychleji v n´astroji AIVA neˇz pˇri pouˇzit´ı UML.
1 Introduction 1
1.1 Problem Definition – Motivation . . . 2
1.2 Aims of the Dissertation Thesis . . . 3
1.3 Structure of the Thesis . . . 4
2 Component-Based Software Engineering 5 2.1 Component . . . 7
2.2 Component Model . . . 10
2.3 Component Framework . . . 13
2.4 Blackbox and Other Boxes . . . 13
3 Software Visualization 15 3.1 Human-Computer Interaction . . . 16
3.2 The Path of Information . . . 17
3.3 Principles for Creation of a Mental Model . . . 18
3.4 Visually Enabled Reasoning . . . 19
3.5 Interactive Visualization . . . 21
4 State of the Art of Component-Based Application Visual-ization Approaches 25 4.1 Requirements of Component Visualization . . . 26
4.2 General Visualization of Components . . . 27
4.2.1 UML 2 . . . 27
4.2.2 Layered UML . . . 30
4.2.3 Area of Interest in UML . . . 31 iv
4.3.1 SaveCCM Visualization . . . 33
4.3.2 Palladio Visualization . . . 34
4.4 Summary of Current Visualization Approaches . . . 35
5 Meta-models for the Description of Component-Based Ap-plications 37 5.1 Research Models . . . 39
5.2 UML 2 Meta-Model . . . 39
5.2.1 Components . . . 40
5.2.2 Profiles . . . 41
5.3 The ENT Meta-Model . . . 42
5.3.1 Overview of the Meta-Model . . . 43
5.3.2 Classification System . . . 44
5.3.3 The Component Model Level . . . 45
5.3.4 Application Level . . . 48
5.3.5 Structuring Level: Category sets . . . 53
6 Advanced Interactive Visualization Approach 54 6.1 Research Challenge . . . 55
6.1.1 Complexity of Diagrams . . . 55
6.1.2 Complexity of Components . . . 56
6.1.3 Problems with CBSE . . . 57
6.2 Conceptual Structure . . . 57
6.3 Visual Notation of Components . . . 59
6.3.1 Interactive Features of Component Notation . . . 61
6.4 Diagram Filtering by Category sets . . . 62
6.5 Inter-Component Bindings . . . 63
6.5.1 Interactive Features to Reveal Relations . . . 65
6.5.2 Element Oriented Connections . . . 66
6.6 Composite Components . . . 67
6.9 Other Features . . . 71
6.10 When It Is Better To Use AIVA Than UML . . . 72
7 Component Application Visualizer 74 7.1 Conceptual Structure . . . 75
7.2 ComAV GUI . . . 75
7.3 Structure of ComAV . . . 76
7.3.1 Loader extension point . . . 78
7.3.2 Visualization extension point . . . 80
7.4 Supported Component Models . . . 82
7.4.1 OSGi . . . 82
7.4.2 EJB 3 . . . 84
7.4.3 SOFA 2 . . . 86
8 AIVA - The Implementation 88 8.1 Visual Editors . . . 88
8.1.1 Creating New Category Sets . . . 88
8.1.2 Condition Editor . . . 89
8.2 Structure of the AIVA . . . 91
8.3 JGraphBasic Plug-in . . . 92
8.3.1 Connecting the ENT Structure with JGraphX . . . . 92
8.3.2 Node overlays . . . 95
8.4 AIVA Plug-in . . . 96
8.4.1 Action listeners . . . 97
9 Evaluation of the Proposed Approach 100 9.1 Overview of Used Tools and Technologies . . . 101
9.1.1 RSA . . . 101
9.1.2 Technological Background . . . 101
9.2 Case Study on Structure Readability . . . 104
9.2.3 Generalization . . . 110
9.3 User Study on User Performance . . . 111
9.3.1 Design of the study . . . 111
9.3.2 Technical details of the study . . . 113
9.3.3 Results . . . 114
9.3.4 Discussion . . . 118
9.4 Conclusion of Evaluation . . . 120
10 Conclusion 121 10.1 Evaluation of Thesis Goals . . . 121
10.2 Current State of Work . . . 122
10.3 Future Work . . . 123
10.3.1 Future Research Challenge . . . 123
A Author’s Publications 131 B ENT Models of Component Models 134 B.1 The OSGi Component Model . . . 134
B.1.1 Component Types . . . 134
B.1.2 Trait Definitions . . . 134
B.1.3 Tag Definitions . . . 136
B.2 The SOFA2 Component Model . . . 138
B.2.1 Component Types . . . 138
B.2.2 Trait Definitions . . . 138
B.2.3 Tag Definitions . . . 139
B.3 The EJB3 Component Model . . . 140
B.3.1 Component Types . . . 140
B.3.2 Trait Definitions . . . 140
B.3.3 Tag Definitions . . . 142
C Full Sized Images from Comparison Case Study 145
2.1 Component development in Visual Studio IDE . . . 9 3.1 Diagram of visual reasoning [34] . . . 20 3.2 A screen shot of Visual Thesaurus [71] . . . 22 3.3 Attribute Explorer style display: (a) before changing limits
and (b) after changing the lower limit [71] . . . 23 4.1 A view on OSGi application in Eclipse dependency visualization 27 4.2 A component diagram with OSGi profile . . . 28 4.3 An example UML class diagram of java-player taken from
http://java-player.sourceforge.net . . . 29 4.4 Multiple views in one UML diagram [15] . . . 30 4.5 Several Areas of Interest in a component diagram [9] . . . 31 4.6 SoftVision visualizing architecture on different layouts [54] . . 32 4.7 SaveIDE – architecture and behavioral editor [51] . . . 34 4.8 Palladio – system editor [51] . . . 35 5.1 MOF abstraction levels mapped on the component domain . 38 5.2 The role of common core [38] . . . 40 5.3 Classes defined for Component diagram [39] . . . 41 5.4 Classes defined in Profile [38] . . . 42 5.5 Component application example — Parking Lot (OSGi
ap-plication) . . . 48 5.6 Manifest file for Gate bundle . . . 49 5.7 Theimported packagestrait of theGatebundle in ENT
rep-resentation . . . 51
5.9 The servicecz.zcu.kiv.parkinglot.gatebound to bundleDesk
in ENT representation . . . 52
5.10 The ENT category set . . . 53
6.1 OSGi component called “Gate” in all representation styles used by AIVA. . . 59
6.2 How would AIVA represent a CORBA component. . . 60
6.3 Two info boxes used interactively . . . 61
6.4 Filtering ENT visualization by category sets. . . 62
6.5 Part of a simple OSGi application after the user requested the information. . . 64
6.6 Connection representation that emphasizes elements. . . 66
6.7 The expand principle of composite components. . . 67
6.8 Simple structure view over several components . . . 69
6.9 OpenWMS application highlighted with different conditions. . 70
7.1 ComAV workspace . . . 76
7.2 Information flow in ComAV application . . . 78
7.3 Main menu, where new loader plug-ins are added . . . 79
7.4 Context menu, where new visualization plug-ins are added . . 81
8.1 Editor used to create new category sets . . . 89
8.2 Editor used to create and manage different condition rules. . 90
9.1 Workspace of RSA . . . 102
9.2 UML profile of OSGi component model . . . 103
9.3 ParkingLot in UML . . . 106
9.4 ParkingLot in AIVA, with one connection (Gate – Configu-ration) selected . . . 107
9.5 Complete CoCoME visualized with UML . . . 108
9.6 Complete CoCoME visualized with AIVA . . . 109
9.7 Comparison of average results . . . 117
C.1 ParkingLot in UML . . . 146 C.2 ParkingLot in AIVA, with one connection (Gate –
Configu-ration) selected . . . 147
Introduction
The overall size and complexity of current software systems is much higher than in the past. As the performance of computers rises, progressively more complex problems are algorithmized and added to software systems. For example, simple accounting systems evolved through years into highly inte-grated management systems offering everything from storage management or line control to enterprise resource planning and customer relationship management. This evolution of complexity is a permanent problem which did not changed from 1992, when Garlan [20] said:
As the size and complexity of software systems increases, the design problem goes beyond the algorithms and data structures of the computation: designing and specifying the overall system structure emerges as a new kind of problem.
One of the answers to the problem of increasing complexity is Component-based software engineering (CBSE) - a new field of computer science. In CBSE software systems are composed by using components with the goal to maximize the reuse of written code, minimize the cost and the time needed for development and provide quality assurance by using certified components.
The history of components is dated back to 1968, when Mcilroy [32] firstly mentioned the concept of component. In 1987 William Atkinson, an engineer at Apple, designed HyperCard, an interactive programming tool with strong user-interface features. The concept behind this tool created the foundation for the visual component-based programming and rapid application devel-opment (RAD). It was the first time when objects became components to accelerate the development process of new software units. Microsoft adopted these principles in 1990, when it released Visual Basic, supporting both vi-sual component-based programming and RAD, and continued in 1993 with
Component Object Model (COM) to compete with OMG’s (Object Manage-ment Group) Common Object Request Broker Architecture (CORBA) from 1992. The development of new component approaches continued and Sun microsystems announced EJB (Enterprice Java Beans) in 1997 followed by OSGi component model in 1998. Microsoft also continued in their research to create a new platform called .NET in 2002, which replaced the old Vi-sual Basic. This expansion of new component models also brought research on component models developed on universities - for example Fractal [6] in 2004, SOFA [8] in 2006, CoSi [4] in 2008 or Palladio [2]. This paragraph was based on an overview from [16].
The complexity of software systems based on any architecture is increasing in time, so in 1994 the Unified Modeling Language (UML) has taken its initial form to help software developers to specify and visualize their software. UML was finished in January 1997 as version 1.0 and supported only object oriented programming. Components were added to UML in version 1.1 (fall 1997) but they were used to represent implementation items, such as files and executables, which is in conflict with the common use of the term “component”. These conflicts were resolved in version 2.0 starting in July 2005, when UML officially changed the meaning of the component in its diagrams. Since then the UML is the mainstream approach in visualization of component-based applications.
1.1
Problem Definition – Motivation
The motivation to study structure of component-based systems can differ, but generally we can state two common scenarios: 1. Company overtakes the software project of another company, to continue in development, or to add new functionality; 2. New team member is hired to work on project in progress. In any such case it is vital to understand the structure in order to work with the system.
Visualization is important in order to gain insight, to understand the struc-ture of software system and to enable decision making. This statement can be challenged, because by studying implementation itself one can also gain knowledge of a software system, but we claim that this is rather hard in the context of large software systems (e.g. over 100 components) and that visualization is a great help in the process of learning such structures. The structure of large software component-based systems is very complex and difficult to visualize all at once, when one also needs to work with some details. The result is usually rather hard to read, as details mix with structure and obscure the clarity of the diagram. Components can be very different and have different features, so it is also very hard to design a general
way to express these details.
There are several roles in every component-based development approach, which are interested in different information. For example, component de-velopers are interested in all details to be able to create new components and connect them with others, while component assemblers are only interested in relations between components so they can compose new systems without information overload. This different information can even be on different levels of details. The problem then is, how to visualize multiple levels of details and how to filter provided information to enable different roles to read a visualized diagram with the information wanted. The common prac-tice is the creation of separate diagrams for every need, which unfortunately brings new problems with the sustainability of several diagrams and higher cost needed to maintain these diagrams.
Interactive techniques are known from other fields of information visualiza-tion and these techniques introduce ways to overcome these problems – the need for several diagrams and poor readability of the whole models. Some interactive techniques can also increase the speed of the learning process itself. The problem is that there is no approach that uses principles of in-teractive visualization for the purposes of component applications structure visualization.
There are approaches that visualize structure and details of component-based applications, but they do not use these interactive techniques. There are also approaches that use interactive techniques, but they are rather focused on analysis and a general overview of a visualized system and can’t provide the required details.
1.2
Aims of the Dissertation Thesis
From the previous discussion it is obvious that the problem is in the absence of an approach that would accommodate interactive principles and adopt them in structure visualization with a sufficient amount of detail. The main goal of this work is to design a new visualization approach, which should be able to:
1. Visualize the structure of any component-based application as a graph diagram.
2. Visualize a sufficient amount of detail.
3. Provide ways to filter these details and work on different levels of detail interactively.
Prior to visualization, it is necessary to develop a data structure that is able to hold information about any component-based application with a sufficient amount of detail. The ENT meta-model [3] provides a detailed and general description of single components. This meta-model was developed during previous research in our group, so we decided to reuse it and extend it.
1.3
Structure of the Thesis
The structure of this thesis is as follows: Chapter 2 covers the basic terms of component-based development and discusses the issues of very different understandings of components. Chapter 3 then provides an introduction to visualization with a focus on the cognitive limits of the human brain and how interaction can be helpful in the process of learning a software system. The state of the art of component-based application visualization approaches is covered in Chapter 4, with a deeper description of problems of current approaches. Chapter 5 provides an overview of current meta-models used for the description of component-based applications. A special care is given to the used ENT meta-model, which is thoroughly described together with its formal specification.
The proposed visualization approach, called AIVA (Advanced Interactive Visualization Approach), is presented in Chapter 6. All aspects of this new approach are covered in this chapter from theoretical point of view. Next Chapter 7 describes the implementation of the ComAV visualization and reverse-engineering platform, covering the reasons why it was developed. Chapter 8 will finally reveal the implementation of the AIVA as a plug-in for the ComAV. This new approach is then evaluated using case-study and user-study, these studies are introduced together with results in Chapter 9. Finally, this whole thesis is concluded in Chapter 10.
Component-Based Software
Engineering
Component-Based Software Engineering (CBSE) is a branch of software en-gineering that emphasizes modularity and extendability by composing whole software systems from separate building blocks called components, which communicates through interfaces. The principles of CBSE are described in a great detail by Heineman [22] and Crnkovic [11], [12]. The idea of components is taken from other industries where this concept is well known and has been used for many years. Components are prefabricated “things” that can be rearranged to create new composites that are required by a customer. This principle transferred to the development of new software systems has three steps, performed by a software architect in the initial phase of a project: the software system is divided into separate abstract components (how components should look ideally); the component reposi-tory is searched for real components that can satisfy the needs of the abstract components; when no real component can offer the required functionality, a new component has to be designed, implemented by component developer and added to the component repository.
A component should provide integrated functionality for one problem or a group of similar problems to enable future reuse of itself, and it is designed with this purpose in mind. This might be a very difficult task, because if component should be reusable, it has to be general, but still it has to avoid over-generalization in order to provide enough functionality that reuse re-mains practical. As mentioned before, components are stored in component repositories from which assemblers can take finished components and use them to create a final product. Every software company has its own com-ponent repository where they store their own comcom-ponents together with purchased ones. Purchase of finished components is practical, because it is much cheaper than the development itself, but on the other hand, there
is no official certificate of component quality. Although there is no offi-cial certification of components, the biggest reseller of software components, componentsource.com (over one million members and two thousand compo-nents), offers customer reviews to provide at least a limited idea about the component quality.
We would like to define basic terms in the field of CBSE to provide a foun-dation for the rest of the paper. Simple, but comprehensive definitions are provided here, while more precise descriptions will be provided in subsequent subsections. In CBSE there are three elementary terms:
• Component - a unit of composition or extension.
• Component model- a description of a component and the compo-nent’s environment.
• Component framework- an environment in which components are deployed.
At this point, a more formal definition of CBSE can be quoted from Bach-mann [1]:
Component-based software engineering is concerned with the
rapid assembly of systems from components where: components
and frameworks have certified properties; and these certified
properties provide the basis for predicting the properties of
sys-tems built from components. or a different one from Heineman [22]:
The major goals of CBSE are the provision of support for the development of systems as assemblies of components, the devel-opment of components as reusable entities, and the maintenance and upgrading of systems by customizing and replacing their components.
The above statement from Bachmann mentions the biggest motivation for use of components, which is rapid assembly, resulting in overall rapid devel-opment. Software systems can be assembled rapidly by using components from a repository whose components were developed or bought earlier; thus it saves time and resources and reduces the price of the final product. With a sufficiently comprehensive repository of components, this approach can overcome the well known paradigm: cost, time, quality; pick any two. In the repository, it is logical to maintain only components that have in some
way certified features and properties (on a company level) and by using these components it is predictable how the final system will behave and what the properties of a system will be. This also guarantees some level of quality, because by using quality components and by predicting the properties of the final system, it is possible to rapidly assemble a final system that has quality attributes adequate to the components used.
Any component depends only on its requirements, which are well-defined and have to be satisfied. One of the consequences is that a component is in-dependent of other components. When an application should be extended, it does not include changes of old components, but adding new ones and satis-fying their needs. This means that components that compose the application are independent of newly-added components – resulting in independence for extensions.
At the end of this introduction, we would like to summarize the motivation for using components:
1. Components can be bought on component markets to save time and costs.
2. Time-to-market can be reduced by using components.
3. The quality of the whole system can be predicted by using certified components.
4. Component systems can be independently extended.
2.1
Component
The term “component” was already mentioned earlier, but what, in fact, a component is, is still unexplained. This is caused by the very broad under-standing of what a component is. Before we continue in theory, lets look at a few specific component descriptions that will help to understand the term. • OSGi component [40] is called a bundle and it is deployed directly into an OSGi framework. In the framework, all the components are equal and ready to provide the services they offer. A service is an inter-face that describes what is provided outside the component for use by other bundles. Bundles can ask the framework to provide them with a service conforming to the requested interface. All the communication between components is realized through these services; thus, appli-cations are composed by simply deploying all components that make up the application into the framework and the framework manages
the rest. Physically the bundle is written in Java language and dis-tributed as a jar file with an extended manifest, to be able to describe the bundle more precisely (what it needs and provides inter alia). In this jar file there is a main class file, which contains implementation for the starting and stopping sequences of the bundle. The context of the framework is handled to this class, so it is able to register new services or receive previously registered ones. A service is an instance of a class, that implements interface of the concrete service.
• SOFA component [8] is called architecture and its description is called a frame; which says which interfaces are provided and required by the frame. SOFA is closely bound to the component repository from which components are taken and deployed in one or more nodes; these nodes are distributed frameworks that manage the life cycle of a component. SOFA is an implementation of a hierarchical model; thus the application, called an assembly, contains a pointer on the top level architecture, which is a component composed of several subcompo-nents. A component which is composed of several subcomponents is a composite component, in a general terminology. A composite compo-nent can make use of its subcompocompo-nents and these can communicate between themselves. SOFA is also based on Java; thus the implemen-tation is Java classes. Physically, the architecture is only an XML description that says how the component is composed, what frame it implements and which Java class is the implementation. SOFA components are always stored in the repository together with XML descriptions of frames and assemblies. When an application should be started, a user has to select a deployment plan, where is described which assembly should be started on which nodes.
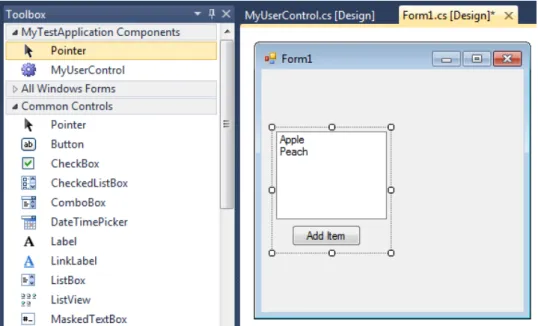
• .NET visual component1is used in Visual Studio IDE to compose Windows applications. These components are composed from other visual subcomponents and are referred to as “UserControl”. The ap-plication logic of the component is written in any .NET language (C#, Visual Basic or any other) and it has to be built, before first use. These components are closely bound to IDE and are integrated into it, unlike OSGi and SOFA. The primary objective of user controls is to be used as GUI elements with application logic attached to it. One or more user controls can be built and distributed as a DLL library to a third party. This DLL has to be added to references before it is shown in the toolbox of IDE and can be used. This can be confusing, so it is better to use an image (see Figure 2.1) to illustrate the usage of user controls. In the top left corner you can see the toolbox of user controls,
1MSDN library about user controls
which can be drag-&-dropped to build new user controls. In he right part of the image, you can see a selected user control, which contains a list box with fruit names and a button, that is able to add new fruit in the list box.
User controls are physically composed of two files – a class file that contains application logic; a designer file that contains information about graphic elements. A parent component can use any property or method that is set as public in the class file; moreover, user controls provide events, which are callback methods used by a parent com-ponent to react to an event triggered by its child comcom-ponent. User controls are not deployed into the .NET framework, but they are inte-grated into the application in the building process; thus the application is built as monolithic.
Figure 2.1: Component development in Visual Studio IDE
All the above-mentioned components have very different structure and us-age, which is common for different components. Now we have to highlight that by different components we mean components conforming to a differ-ent compondiffer-ent model, because there is no compondiffer-ent without a compondiffer-ent model. In other words, a component has to conform to a component model, because otherwise we can’t speak about a component at all.
There are a few things that components have in common, which will be clear from definitions provided below. Bachmann defines a component as follows [1]:
A Component is:
• an opaque implementation of functionality • subject to third-party composition
• conformant with a component model Szyperski defined a component in [64] differently:
A software component is a unit of composition with contractu-ally specified interfaces and explicit context dependencies only. A software component can be deployed independently and is sub-ject to composition by third parties.
Yet another definition from Taylor [65], which is more focused on architec-ture:
A software component is an architectural entity that (1) encap-sulates a subset of the system’s functionality and/or data, (2) restricts access to that subset via an explicitly defined interface, and (3) has explicitly defined dependencies on its required exe-cution context.
These definitions should be discussed to provide proper explanation. It is clear that components have to implement some functionality, because oth-erwise it would be impossible to create any application using them. This implementation is, however, hidden – encapsulated inside a component. A component can be used only through explicitly defined interfaces – meaning we can use functionality without the need to know how it is implemented. An explicit definition of interfaces results in well-defined interfaces and en-ables a third party to use the component, without any other knowledge. Such components can be then composed together by a third party. Compo-nents can depend on some resources – files, classes, framework services or other components. However, these dependencies have to be also explicitly defined, so a third party can satisfy these dependencies. A component has to conform to a component model, otherwise it cannot be either composed or deployed. And finally, a component can be deployed independently of other components, because dependencies are resolved after deployment.
2.2
Component Model
A component model is, as mentioned earlier, a description of how a com-ponent should look, interact and be deployed. We also mentioned that a
component that does not conform to any component model is irrelevant, because two components can interact if and only if they can create assump-tions about the other component, for example, how to locate the second component, how control flow is synchronized, which communication proto-col is used, how data is encoded and so forth. In this subsection we will discuss what must be described by a component model in order to use it. Lau provides a simple but elegant definition in [30].
A software component model is a definition of
• the semantics of components, that is, what components are meant to be,
• the syntax of components, that is, how they are defined, constructed, and represented, and
• the composition of components, that is, how they are com-posed or assembled.
There is no agreement on what should be described by a component model, but based on our study of Bachmann [1], Lau [30] and Szyperski [64], we found five important things that are commonly covered by component mod-els. An exhaustive list of things that a component model describes is given in [13], where Crnkovic defines the classification framework for component models.
Component types. In the above definition it is mentioned, that a com-ponent model has to define the semantics and syntax of comcom-ponents. But it is possible that there are different types of components in the sense of different building blocks. Some component models can recognize more than one component type, where every component type has its special purpose – for example, EJB 3 (Enterprise Java Beans) [63] has three component types, SessionBean contains application logic, MessageDrivenBean can lis-ten to events and Entities are used as DAO (Data Access Object). In such cases, the component type acts as an interlayer between a component model and the specification of semantics and syntax – a component then has to conform to the component type to be recognized by the component model. Every component model recognizes at least one component type. By in-troduction of component types, the above definitions remain valid, and it is the purpose of component types to provide the semantics and syntax of components.
The semantics of a component define how the component should look – what its purpose is, how it can communicate, what it can provide and require, how it is deployed, etc.
The syntax of a component defines how the component should be imple-mented – required files that have to be present in every component with the
description of these files, where the source code is located, implementation requirements, which interfaces have to be implemented, etc.
For example, JavaBeans and EJB’s SessionBeans are both syntactically Java classes, however, different semantically. JavaBeans are hosted by a container and interact with one another via adapter classes generated by the container that link beans via events. SessionBeans are hosted and managed by an EJB container (different type) and interact with one another via methods that are provided by two interfaces – home and remote.
Interaction schemes. When components are deployed, they have to be able to communicate between themselves in order to create a functional unit. The component model may describe how components interact with each other, or how they interact with the component framework. There can be restrictions on which component types can communicate together and which can not. The interaction itself can be realized in very different ways – through network communication, interface calls, pipes, events, in-termediates, etc. The interaction also includes things related to resource management, thread management, persistence and so forth.
Architecture styles. The software architecture is very important in CBSE, because it can affect not only how the system should be built, but also some quality attributes; systems with better architecture can have a better response. The component model can prescribe architecture styles that are allowed – how components are composed and which component types can be composed together.
Resource binding. Resources in the scope of component models can refer to files, classes, services provided by the framework or other components. A component can use one or more resources provided either by the framework or by another component. A component model describes which resources are available to components, and how and when components bind to these resources.
Deployment process. A component model can also describe how compo-nents are deployed into the component framework. In OSGi, all compocompo-nents have to be installed into the framework prior to being started; in SOFA, it is only necessary to start the deployment plan, because all the components are automatically taken from the repository and distributed into the deployment nodes; and, finally, .NET visual components are automatically integrated into the application in the building process and run monolithically.
2.3
Component Framework
A component framework is an implementation of a component model that enables components to be deployed and run. A component framework man-ages resources shared by components, components themselves, communica-tion between components and the whole life-cycle of components. A compo-nent framework has to enable exactly what is described by the compocompo-nent model. Bachmann [1] recognizes two types of component frameworks:
1. Runtime framework. This type of framework offers an environ-ment for components where they can be deployed and creates a layer between components and the operating system. Components are after that managed similarly as processes in the operating system: they can be started, suspended, resumed or stopped. Compared to operating systems, frameworks offer only limited interaction mechanisms equal to the ones described in the component model. The OSGi and SOFA component models use this type of framework.
2. Bundled framework. In some cases it is not suitable or necessary to work with components one by one, so the framework is bundled with components and behaves more like the bottom layer of the application, which offers services and abstraction from the operating system. This type of framework doesn’t manage the life-cycle of components.
2.4
Blackbox and Other Boxes
A blackbox is a device that has a well-defined input and output and no internally observable state. A blackbox can be used without knowledge of how it works; one only needs to know its description. In software component analogy, we say that a blackbox is a component that can be used solely by knowing its interfaces – required and provided ones – and without knowing implementation details. In other words, a blackbox can be reused by a third party without relying on anything but its interfaces and specifications. The blackbox nature of components is a very important principle, based on in-formation hiding, as discussed by Parnas [43], who said that modules should hide their internals and make only selected features accessible through its public interface. Brada [5] also discusses the importance of a blackbox in CBSE.
There are also other patterns that differ in the opacity of implementation. The opposite to a blackbox is a whitebox, which allows the user to study im-plementation details to enhance understanding of the component. A white-box can be reused through its interfaces, but it relies on the understanding
gained from studying the implementation details. Some authors even sug-gest the usage of a glassbox, allowing only a study of the implementation, while a whitebox allow even manipulation with implementation itself. The use of whiteboxes can be dangerous; this fact is presented by Szyperski in [64].
Whitebox reuse renders it unlikely that the reused software can be replaced by a new release. Such a replacement will probably break some of the reusing clients, as these depend on implemen-tation details that may have changed in the new release.
In the middle of these two patterns are grayboxes, which reveal only a controlled part of their implementation to enhance the understanding of the component. Buchi, for example, claims that components should be grayboxes and presents evidence in [7]. Grayboxes are used, for example, in the SOFA component model [8] in the architecture of frames.
Software Visualization
The discipline of software visualization is introduced in this section, together with basic cognitive and psychological principles applicable to the field of software visualization.
Visualization is the name of a discipline of computer science that is interested in transformation of information into visual form, in order to help scientists and engineers see otherwise hidden features. There are two major disciplines of visualization:scientific visualization processes physical data, whereas
in-formation visualization processes abstract data. Software visualization is a
part of information visualization, because programs and algorithms do not have physical form. Software visualization is concerned with visualization of applications or parts of applications from different points of view. A formal definition of software visualization was given by von Mayrhauser [68]:
Software visualization is a discipline that makes use of various forms of imagery to provide insight and understanding and to reduce the complexity of the existing software system under con-sideration.
As outlined by this definition, one can imagine that the discipline of software visualization is an extensive field of study. Diehl recognizes three categories of software visualization in [14]:
• Structurevisualizations can visualize internal static qualities of soft-ware; these qualities can be inspectedwithout running the program, as they are based solely on the implementation itself. This type of vi-sualization is supposed to help to model the architecture of software, describe classes, present algorithms in a visual way1, etc.
1
One can object that algorithm is dynamic, but it is still something that can be in-spected just by analyzing the implementation.
• Behavior visualizations can visualize dynamic qualities – function calls, memory usage, run-time, etc; these qualities can only be in-spected after running the program and analyzing how this program behaved. This visualization is supposed to help with finding slow or resource-draining parts of an application, visualize the sequence of function calls, etc.
• Evolutionvisualizations can visualize both static and dynamic qual-ities, but it emphasizes how these qualities change in time; e.g., it visualize the changes of source code.
These categories can be challenged and new ones can be designated, but we provide them just to present how different things can be part of software visualization and not to discuss them in detail. There are a lot of things that can be said about software visualization and Diehl provides an exhaus-tive number of details in [14], Taylor provides a more brief, but also very interesting description of software visualization in [65].
We are not the the only ones who want to address problems of current soft-ware visualization approaches. Knight [27] discusses the problems related to the comprehension of programs and suggests the use of three dimensions. However, there has not been any revolution of 3D software visualization approaches after nine years, so we approach very similar problems to those that Knight described, but by concentrating on interactive techniques. In the scope of this thesis, we would like to talk more about the ideas behind visualization that will back up our proposal, so we will not continue with a description of software visualization itself. Instead, we gave more space to interaction and psychological principles because if one wants to design a new visualization approach he has to understand to the cognitive limits. Following sections will therefore cover basics of human computer interaction in Section 3.1, what is needed to be done to transform a data into insight in Section 3.2, basic visualization laws based on cognitive limits in Section 3.3 and finally how important is interaction for visualization and an overview of interaction techniques in Sections 3.4 and 3.5.
3.1
Human-Computer Interaction
This section will briefly introduce Human Computer Interaction (HCI) and its impact on software visualization. A basic goal of HCI is to improve the interaction between user and computer. A long term goal of HCI is to minimize the barrier between the human’s cognitive model and computer’s understanding of user’s task. HCI is concerned with problem of making
computers more usable and receptive to the one’s needs. HCI itself is a mixed field of computer science, human psychology and several other fields. Software visualization is generally a field that can benefit much from differ-ent HCI methods. No software visualization approach is able to visualize a complex applications without the need to interact; at least some kind of navigation is always included. Software visualization tool with better HCI can provide better understanding and reaction on one’s needs. Therefore, different HCI can improve the overall capabilities of the visualization – if one will get what he expects, he can gather the required knowledge easier.
3.2
The Path of Information
The software visualization itself is only one step on the path of information. There is a raw data on the start of this path and insight on this data at the end. This section will shortly elaborate each step, which should pro-vide motivation why is visualization so important. It should also help to distinguish between model and visualization. These steps are defined based on our experience and summarize the information given in the rest of this chapter.
1. Raw dataare the input. It is typically a source code or configuration files of an application that should be understood in order to work with this application.
2. Information model is an abstraction of reality. An abstraction of source code can be model that loses implementation details, but keeps all classes, methods and public properties. Such model is understand-able to the computer that is therefore understand-able to process it further. The format of this model must be defined by a meta-model. An infor-mation model of software can be either created manually or using reverse-engineering.
3. Visualizationis a visual representation of an information model. The purpose of software visualization is to move an information model from computer to mind. It also helps to refine already existing mental model.
4. Mental modelis an abstraction of reality in mind. It is mandatory to analyze the data and to gain insight. Mental model is described in detail in the next section.
This will be better explained on an example. There is a Java application and one needs to understand it. It’s source code is a raw data and it will be stud-ied thoroughly later. One will use some CASE (Computer Aided Software Engineering) tool to reverse-engineer the structure of the Java aplication, therefore it will create an information model. CASE tool will probably use UML to visualize this model which can be used to walk through the UML diagram. After a while one will learn the application’s structure and he will create a mental model for it. Once this mental model is created one will get an understanding to this application – an insight and he will be able to make decisions regarding this application.
3.3
Principles for Creation of a Mental Model
Before the analysis of a visualized software can start, it is of most importance to create a mental model. A mental model is a representation of reality in mind, which is used in the thought process. Human reasoning depends upon a mental model, which can be constructed from perception, imagination, or the comprehension of discourse. This established theory is developed and described by Philip Johnson-Laird [26].
Ric Holt uses the theory of mental models and he applies it to software architectures in [24], where he defines basic cognitive principles applicable to software architectures, which facilitate creation of a mental model of a software system. These rules are valid also for visualization of components, and have one thing in common – they try to minimize what is learned, to avoid a brain overload caused by complexity. Holt identified several laws and principles, from which we will discuss three laws that we see as most important for the visualization of structure:
• Law of maximal ignorance. Don’t learn more than you need to get
the job done. When visualizing large and complex component systems,
one must filter away unwanted detail to promote simplicity. It is often advantageous to oversimplify the representation of the implementa-tion, to make it easier to think about the architecture, but one has to realize the danger of these simplifications. When studying the ar-chitecture of complex component systems, it is important to keep one from learning too much, because details cause distraction and extend the time needed for the creation of a mental model, thus extending the time needed for reasoning about this mental model. However, too much simplification may conceal necessary information.
• Law of minimal change. When the software changes in a modest
visualizing two versions of the same component system, it is impor-tant to keep the models similar – the same layout with components and clusters of components positioned at roughly the same place with the same colors (if any were used). Each visual change in a repre-sented system means a change of the mental model for every team member. These changes are time-consuming, cause confusion and are error prone.
• Law of ugliness hiding. Unobserved ugly parts of a system stay
ugly. When ugly parts of system are hidden, they can’t be recognized
and repaired. People instinctively like things to be clean and simple, so when they see something messy that ought to be simplified, they tend to fix it. This law should emphasize, that the resulting visual representation should be complete and should not omit ugly parts or they may not be fixed.
One last thing about the brain is, that visual information (shape, color, tex-ture, position) is processed in the right hemisphere and verbal information (text, spoken sentence) is processed in the left hemisphere, so when both these types of information are used together, we can use both our hemi-spheres to create a mental model of the represented system. Therefore, a combination of both these types of information sources would provide bet-ter results. It is commonly referred as the dual-coding theory, described by Paivio in [42].
3.4
Visually Enabled Reasoning
Meyer et al. define the new science of visually enabled reasoning in [34] which evolved from visual analytics by concentrating on interaction and interactive reasoning. We would like to present some basic ideas to demonstrate that interaction should also be part of software visualization, because it enables us to work faster and more efficiently and helps to create a mental model of a component system in order to gain insight and enable decision making about that system. The importance of interaction to a gain of knowledge or insight is also depicted in Figure 3.1. One can gain some level of knowledge from either pure data, analyzed model or from visualization by interacting with one or the other. However, only interaction with visualization can provide visual reasoning, which is most important in order to gain the insight.
Visual Analytics itself is a field of information visualization that incor-porates HCI with respect to data analysis. Visual analytics facilitates data analysis through HCI. The human visual and cognitive systems are the most powerful tools for understanding complex relations, so in order to maximize
Figure 3.1: Diagram of visual reasoning [34]
user experience and performance it is essential to use the advantages of dy-namic interactive principles and adapt them to create a perfect match with our visual and cognitive systems. A system that matches visual perception, with respect to resolution, focus, attention and detail without overloading human senses is most suitable for efficient interpretation of large data sets [34].
Interactive Reasoning is the process of distinguishing between ideas in order to create new relations and insights based on collected evidence [34]. Evidence can be freshly gathered from a visualized representation or based on previous knowledge. Evidence can be any information, data, idea or artifact resulting from reasoning. Interactive visualization is not only what is visualized, but also how – user interface, interaction with user, manipulation of the visualized representation. These elements of HCI should offer the user enough means to make progress in the reasoning process.
Insight Gainis the ultimate goal of visualization, because insight involves knowledge and the ability to reason about a mental model.
Meyer et al. also mention that a big shortcoming of current interactive vi-sualization systems is that they depend only on the visual sense. This is caused by the fact that the visual sense comprises as much as 75% of all in-formation perceived from the outer world. Meyer suggest, that involvement of other senses could enhance the possibilities of interactive visualisation even further.
3.5
Interactive Visualization
We already discussed HCI in Section 3.1and its importance for information visualization and visually enabled reasoning in previous Section 3.4. In-teractive technique is a mechanism for modifying what the users see and how they see it. There are a lot of interaction techniques that provides this interaction within the data and information visualization context. This sec-tion will provide their categorizasec-tion to provide more understanding to this problematics. These categories are the result of study by Yi et al. presented in [71] and can be considered as key for our future work, because they offer different interaction categories based on user intent.
The recognition of this categorization may be seen by using it by Ward et. al. [69] in his book. Inter alia, Ward et. al. look on interactive techniques and describe them in terms of operators and the operand. Interaction oper-ator is the core of the interactive techniques itself, interaction operand then describe the space upon which the operator is applied. This description (op-erator, operand) should help to define an architecture that combine different interactive operators with different operands to design better interactive ar-chitecture.
The categories of interaction techniques are the following:
Select: mark something as interesting. This enables users to select the items of interest, which are highlighted in some way to keep track of them. This is extremely useful when too many data items are presented all at once, or when the representation of a system is changed, for example, when changing the layout of the system. By marking selected items in a sufficiently distinctive way, it is easy for users to stay oriented even in large systems or in a dynamically changing environment.
Explore: show me something else. In a more complex system, it is not possible to visualize all the items at once, because of screen resolution and cognitive limitations. To overcome this limitation, it is important to enable the exploration of the system. By exploration we mean moving from one point of interest to another in order to gain understanding or insight of the whole system. This exploration can be achieved by simple scrollbars that enable moving over the big diagram, while visualizing only a small part of it. On a very similar principle, panning also works, enabling one to drag a canvas and move it while the camera is steady. Other approaches can offer smooth transfers from one point of interest to another on one click, or even rearranging the view, based on the actual point of interest. All these techniques share the goal of the exploration of a system in order to gain understanding and insight.
The-saurus. Searched vocabulary is shown in the center surrounded by related vocabularies. When one of the surrounding words is clicked, it will smoothly become a new center of the screen. Figure 3.2 shows such related vocabu-laries for the word get.
Figure 3.2: A screen shot of Visual Thesaurus [71]
Reconfigure: show me a different arrangement. Every visual representa-tion of a system has its own spatial arrangement of the items – layouts. Every layout is made with a purpose in mind, to emphasize some hidden characteristic of the system. Layouts can emphasize relations – e.g., hierar-chic relations arranged as a tree; similar characteristics of the items – e.g., items with similar characteristics can be clustered together; or any other, depending on the need. The important thing is, that to reveal the real na-ture of a complex system, it is beneficial to change the layout in order to gain a different perspective. The reconfigure category includes all techniques that can help to rearrange the spatial representation of the items in order to reveal hidden characteristics of the represented system, but we think that for software visualization in 2D diagrams, the layout switching is the most
important technique.
Encode: show me a different representation. Techniques from this category change the visual representation of the items – color, shape, font, size, etc.. These changes are made in order to add or emphasize some characteristics of the items. In software visualization we can change the representation of components or lines that connect components – lines can be collapsed or separated, a component can be represented in UML style (box, with text information) or as houses [70]. This technique provides another view of a component. Another widely used technique is to change the color, based on a certain variable. These colors can mark the components with different characteristics, e.g. response time – green for fast response, orange for medium response and red for slow response. This approach emphasizes some feature of a component.
Figure 3.3: Attribute Explorer style display: (a) before changing limits and (b) after changing the lower limit [71]
Abstract/Elaborate: show me less or more detail. These types of in-teraction allow users to change the level of detail from an overview to a detailed study of individual attributes. All types of the details-on-demand technique are in this category. Lens is a technique that works as a
magni-fier; it does not simply magnify the hovered part of a diagram, but shows details instead. Tooltip is a technique that shows details after hovering over a data item. Drill-down is a technique that shows the internal structure of hierarchical components, but revealing it only if this hierarchic component is clicked. Along with details-on-demand techniques, we can also refer to contextual zooming, which changes the level of details based on distance: when zoomed out we see only boxes-and-lines, when zoomed close enough to be able to read, component elements are revealed.
Filter: show me something conditionally. These techniques offer functions that hide or show differently the items that do not match the criteria. These techniques aim to filter unwanted detail interactively with the possibility to cancel the filter or change the filter – e.g., the hidden items can be shown again. These techniques can filter out components, elements of components or connection lines. The difference is in the way these items are filtered – e.g., they can be hidden, marked with a color or blurred with depth of field. An example of how to filter elements using different colors is in Figure 3.3.
Connect: show me related items. A user who needs to reveal the relations between components will use techniques from this category, because they highlight associations and relations of selected items. – e.g., highlight all components directly connected to the selected one. This technique appears in many visual forms – e.g., edges are made bold, shades of components are colored, unrelated components are blurred with depth of field. Another technique goes across categories, because it hides all unrelated items, shows all related items and arranges the selected item in the center of the screen; all related items and only these items are then arranged around this selected item and when a new item is selected, the whole process repeats.
State of the Art of
Component-Based
Application Visualization
Approaches
CBSE is now a mature field of study, with dozens of component models like EJB [63], CORBA [35] and OSGi [40]. More can be found in commercial applications and even more component models – for example, SOFA [8], Fractal [33] and CoSi [4] – are the subject of research. Every component model can describe a component in its own way and introduce some special features of these components, for example, behavior or interaction.
In such an environment, where component models have so little in common and can have so many different characteristic features, component architects and assemblers are forced with these choices of how to visualize the structure of their component-based applications:
1. Use a general “boxes-and-arrows” visualization; 2. Create a component model-specific visualization.
Neither of these two choices can provide a solution for all the problems stated in the Introduction, but as it will be shown in the first subsection there is a way to instantiate a general visualization approach for the purposes of a concrete component model, thus providing a sufficient amount of detail. However, due to generality of this approach, it is still impossible to provide advantages that a component model specific visualization can offer, which will be discussed in the next subsection. Any general visualization able to
visualize details has to be built on top of a good meta-model that is able to provide this generality together with details – this will be subject of the last subsection.
4.1
Requirements of Component Visualization
The field of CBSE was briefly discussed in Chapter 2 to provide an overview of basic terms. However, it was not discussed who is involved in devel-opment of component-based applications – who will use visualization tools that display these applications. Hence, it will be discussed now. Basically, there must be at least three different roles: system architect, component developer and component assembler. Moreover, Szyperski [64] defined a framework architect role, however we think this role is not so important for software development thus we will not discuss it further.
Component developer works on the lowest abstraction level – he develops components, he makes the black-boxes to work. On such level he needs as much details as he can obtain about other components that will be con-nected to the component he is developing. He simply needs to know every single detail to develop component that can be easily assembled with other components.
System architect is the person who designs a system as a functional unit. He decide how should components look, what they should do, etc. System architect needs access to almost the same amount of detail as a component developer need while he still needs to keep an overview of the whole system unit. This role would benefit most from approach that could provide it an instant transition between structure view and detailed view.
Finally, component assembler composes the final system. He takes functional components and put them together. He needs to know what every compo-nent needs and what it provides. He must be sure that these compocompo-nents will work together and he must make sure the requirements of all components in the system are satisfied. Component assembler needs the least details, he is only interested in component’s needs that he has to satisfy. He works on the highest abstraction level, generally he is mainly interested in the structure of the system unit. However, he still needs to access some details, while others are only disruptive for him.
A visualization approach should consider needs of these different roles in order to provide a useful visualization tool. More detailed view on needs of these roles and what could visualization tools offer is in our publication [25].
4.2
General Visualization of Components
A general “boxes-and-arrows” visualization is useful for the exchange of diagrams between domain experts, but it provides only a few specific details about components and thus it can only provide a shallow understanding of the component-based application. The Eclipse dependency visualization1 is a great example of general “boxes-and-arrows” visualizations. A simple example is in Figure 4.1.
Figure 4.1: A view on OSGi application in Eclipse dependency visualization Because these general approaches do not introduce any ideas interesting for component visualization, we will not include them in this overview. A more sophisticated example might be the UML 2 [39] component diagram, which can show more information about single component; thus it is not only “boxes-and-arrows”.
The answer for how to visualize a component-based application in a gen-eral way is the use of some customization method. It should customize the visualization environment for a concrete component model but visualize all applications in a similar way. Favre [18] mentioned the need for such de-scription of a component model prior to the visualization of a component. An example of such initialization method is the use of profiles in UML; more details are in Subsection 4.2.1. In any case, there has to be a way to visualize details bound to a specific component model.
4.2.1 UML 2
The Unified Modeling Language (UML) provides three groups of diagrams to model both static and dynamic features of software [39]. UML is a standard visualization approach that is common through all software companies. It includes a diagram to model the structure of component-based applications called component diagram and defines its visual syntax. UML introduces
1
Figure 4.2: A component diagram with OSGi profile
some level of semantics – it recognizes interfaces, components can have at-tributes and operations, etc. This semantics is on a meta-model level, thus computer can interpret them correctly and can work with these semantic information. More about the meta-model part of UML will be discussed further in Section 5.2.
As briefly mentioned earlier, UML 2 supports extensions in the form of profiles which can offer a customization of the general component diagram. UML is able to capture enough details about the structure of the application by using these profiles and stay on a general level. This customization is adequate for most of the needs present in component models and has been verified on several component models, for example, CORBA [37] and SaveCCM [45].
An example of a component diagram with OSGi profile is in Figure 4.2. Components are named as “Bundle” instead of general “Component”, ports are used to express imported or exported OSGi packages and interfaces are referred as services. This is a level of customization profiles can offer. One can study book by Eriksson et. al. [17] for more detailed description of UML notation.
The problem is that UML does not meet some of the requirements of compo-nent-based development, which would speed up and improve the orientation and understanding of the structure of the component-based application. We summarized these requirements as follows:
• In component-based development, there are roles with very different interests and needs. UML has to use a new diagram for every role in order to provide the exact amount of detail for each of them. There-fore it is time consuming to provide all these roles with appropriate diagrams.
• Stereotypes, which are the power of the UML extension mechanism, are visualized like tags – they only say that the attribute or method belongs to some group. However, all these different attributes/meth-ods are grouped in one place, in one section. But component-based
Figure 4.3: An example UML class diagram of java-player taken from http://java-player.sourceforge.net
development, because of its diversity, needs a mechanism to model new types of elements apart from attributes and methods. Moreover, it also needs to show these types separately so one can immediately visually distinguish them.
• UML was designed to be static, to show all information at once and provide the same output on both screen and paper. However, for component assembler and system architect it would be better to have the possibility to switch between level of details. As their work requires them to work with the whole structure and details at the same time. • The UML diagrams are confusing especially in complex applications.
Details of every item are always displayed and every relation is modeled by one line between two items. This can be checked on a class diagram of a relatively simple application in Figure 4.3. A component diagram is comparably confusing as the class diagram depicted in this figure. Even with these problems, UML is still the best choice for visualization of component-based applications these days. Thus it is not any surprise that there are approaches that extend UML to somehow compensate for these shortcomings, rather than complete alternatives.
Strengths & Weaknesses:
+ The best known and most widely used approach. + Can provide sufficient amount of detail.
– All the above-mentioned unsatisfied needs of component-based development.
4.2.2 Layered UML
One of the most problematic feature of UML diagrams is surely the need to have multiple diagrams for the same application or part of an application, which differ only in the number of details provided or in another little way. For example, a simple component diagram without any details to provide better readability of an architecture vs. a component diagram with all details shown to provide enough information to create the whole picture. The solution is to find a way how to accommodate multiple views in one diagram, so the user can easily add (or hide) details or items or change layouts. In [15], Dimoulin describes such a feature that can extend UML. Dumoulin decided to choose a change-set approach, which he called layered: a final diagram is completed by composing all active change-sets together. These change-sets says what should be changed on the base set. For example: Change set number one can list all the items without any details, change-set two can add details to these items, change-set three can color some items to emphasize them, change-set four can add comments, etc.
This feature is developed as a part of an open source UML tool named Eclipse Papyrus2. An example of how these multiple views look is in Figure 4.4.
Figure 4.4: Multiple views in one UML diagram [15]
Layered UML diagrams improve usage of UML, because they remove the need for several separate diagrams that have to be maintained, and they enable work with different views seamlessly. But it is still UML and all other problems mentioned in the previous subsection remain valid.
Strengths & Weaknesses:
![Figure 3.1: Diagram of visual reasoning [34]](https://thumb-us.123doks.com/thumbv2/123dok_us/11067393.2993333/32.892.193.714.193.467/figure-diagram-of-visual-reasoning.webp)
![Figure 3.2: A screen shot of Visual Thesaurus [71]](https://thumb-us.123doks.com/thumbv2/123dok_us/11067393.2993333/34.892.183.712.294.766/figure-screen-shot-visual-thesaurus.webp)
![Figure 3.3: Attribute Explorer style display: (a) before changing limits and (b) after changing the lower limit [71]](https://thumb-us.123doks.com/thumbv2/123dok_us/11067393.2993333/35.892.179.723.472.920/figure-attribute-explorer-style-display-changing-limits-changing.webp)

![Figure 4.4: Multiple views in one UML diagram [15]](https://thumb-us.123doks.com/thumbv2/123dok_us/11067393.2993333/42.892.179.717.630.858/figure-multiple-views-in-one-uml-diagram.webp)
![Figure 4.6: SoftVision visualizing architecture on different layouts [54]](https://thumb-us.123doks.com/thumbv2/123dok_us/11067393.2993333/44.892.178.713.567.928/figure-softvision-visualizing-architecture-different-layouts.webp)
![Figure 4.7: SaveIDE – architecture and behavioral editor [51]](https://thumb-us.123doks.com/thumbv2/123dok_us/11067393.2993333/46.892.179.711.540.737/figure-saveide-architecture-behavioral-editor.webp)
![Figure 4.8: Palladio – system editor [51]](https://thumb-us.123doks.com/thumbv2/123dok_us/11067393.2993333/47.892.228.665.311.567/figure-palladio-system-editor.webp)
