Mineta Transportation Institute Publications
6-2018
Exploring Strategies to Improve Mobility and
Safety on Roadway Segments in Urban Areas
Stephen Arhin
Howard University; Mineta Consortium for Transportation Mobility
Follow this and additional works at:http://scholarworks.sjsu.edu/mti_publications
Part of theTransportation Commons
This Report is brought to you for free and open access by SJSU ScholarWorks. It has been accepted for inclusion in Mineta Transportation Institute Publications by an authorized administrator of SJSU ScholarWorks. For more information, please contactscholarworks@sjsu.edu.
Recommended Citation
Stephen Arhin. "Exploring Strategies to Improve Mobility and Safety on Roadway Segments in Urban Areas"Mineta Transportation Institute Publications(2018).
Exploring Strategies to Improve Mobility and Safety on
Roadway Segments in Urban Areas
Founded in 1991, the Mineta Transportation Institute (MTI), an organized research and training unit in partnership with the Lucas College and Graduate School of Business at San José State University (SJSU), increases mobility for all by improving the safety, efficiency, accessibility, and convenience of our nation’s transportation system. Through research, education, workforce development, and technology transfer, we help create a connected world. MTI leads the four-university Mineta Consortium for Transportation Mobility, a Tier 1 University Transportation Center funded by the U.S. Department of Transportation’s Office of the Assistant Secretary for Research and Technology (OST-R), the California Department of Transportation (Caltrans), and by private grants and donations.
MTI’s transportation policy work is centered on three primary responsibilities:
Mineta Consortium for Transportation Mobility
Research
MTI works to provide policy-oriented research for all levels of government and the private sector to foster the development of optimum surface transportation systems. Research areas include: bicycle and pedestrian issues; financing public and private sector transportation improvements; intermodal connectivity and integration; safety and security of transportation systems; sustainability of transportation systems; transportation / land use / environment; and transportation planning and policy development. Certified Research Associates conduct the research. Certification requires an advanced degree, generally a Ph.D., a record of academic publications, and professional references. Research projects culminate in a peer-reviewed publication, available on TransWeb, the MTI website (http://transweb.sjsu.edu).
Education
The Institute supports education programs for students seeking a career in the development and operation of surface transportation systems. MTI, through San José State University, offers an AACSB-accredited Master of Science in Transportation Management and graduate certificates in Transportation Management, Transportation Security, and High-Speed Rail Management that serve to prepare the nation’s transportation managers for the 21st century. With the
active assistance of the California Department of Transportation (Caltrans), MTI delivers its classes over a state-of-the-art videoconference network throughout the state of California and via webcasting beyond, allowing working transportation professionals to pursue an advanced degree regardless of their location. To meet the needs of employers seeking a diverse workforce, MTI’s education program promotes enrollment to under-represented groups.
Information and Technology Transfer
MTI utilizes a diverse array of dissemination methods and media to ensure research results reach those responsible for managing change. These methods include publication, seminars, workshops, websites, social media, webinars, and other technology transfer mechanisms. Additionally, MTI promotes the availability of completed research to professional organizations and journals and works to integrate the research findings into the graduate education program. MTI’s extensive collection of transportation- related publications is integrated into San José State University’s world-class Martin Luther King, Jr. Library.
The contents of this report reflect the views of the authors, who are responsible for the facts and accuracy of the information presented herein. This document is disseminated in the interest of information exchange. The report is funded, partially or entirely, by a grant from the U.S. Department of Transportation’s University Transportation Centers Program. This report does not necessarily reflect the official views or policies Disclaimer
MTI BOARD OF TRUSTEES
Founder, Honorable Norman Mineta (Ex-Officio)
Secretary (ret.), US Department of Transportation
Vice Chair Hill & Knowlton, Inc.
Honorary Chair, Honorable Bill Shuster (Ex-Officio)
Chair
House Transportation and Infrastructure Committee United States House of Representatives
Honorary Co-Chair, Honorable Peter DeFazio (Ex-Officio)
Vice Chair
House Transportation and Infrastructure Committee United States House of Representatives
Chair, Grace Crunican (TE 2019)
General Manager
Bay Area Rapid Transit District (BART)
Vice Chair, Abbas Mohaddes (TE 2018)
President & COO Econolite Group Inc.
Executive Director, Karen Philbrick, Ph.D.
Mineta Transportation Institute San José State University
Richard Anderson (Ex-Officio)
President and CEO Amtrak
Laurie Berman (Ex-Officio)
Director
California Department of Transportation
Donna DeMartino (TE 2018)
General Manager and CEO San Joaquin Regional Transit District
Mortimer Downey* (TE 2018)
President
Mort Downey Consulting, LLC
Nuria Fernandez* (TE 2020)
General Manager & CEO Santa Clara Valley Transportation Authority
John Flaherty (TE 2020)
Senior Fellow Silicon Valley American Leadership Forum
Rose Guilbault (TE 2020)
Board Member Peninsula Corridor Joint Powers Board
Ed Hamberger (Ex-Officio)
President & CEO
Association of American Railroads
Steve Heminger* (TE 2018)
Executive Director Metropolitan Transportation Commission (MTC)
Diane Woodend Jones (TE 2019)
Principal & Chair of Board Lea + Elliot, Inc.
Will Kempton (TE 2019)
Retired
Art Leahy (TE 2018)
CEO Metrolink
Jean-Pierre Loubinoux (Ex-Officio)
Director General
International Union of Railways (UIC)
Bradley Mims (TE 2020)
President & CEO Conference of Minority
Transportation Officials (COMTO)
Jeff Morales (TE 2019)
Managing Principal InfraStrategies, LLC
Dan Moshavi, Ph.D. (Ex-Officio)
Dean
Lucas College and Graduate School of Business San José State University
Dan Smith (TE 2020)
President
Capstone Financial Group, Inc.
Paul Skoutelas (Ex-Officio)
President & CEO
American Public Transportation Authority (APTA)
Beverley Swaim-Staley (TE 2019)
President
Union Station Redevelopment Corporation
Larry Willis (Ex-Officio)
President
Transportation Trades Dept., AFL-CIO
Bud Wright (Ex-Officio)
Executive Director
American Association of State Highway and Transportation Officials (AASHTO) (TE) = Term Expiration * = Past Chair, Board of Trustees
Karen Philbrick, Ph.D.
Executive Director
Asha Weinstein Agrawal, Ph.D.
Education Director
National Transportation Finance Center Urban and Regional Planning
San José State University
Hilary Nixon, Ph.D.
Research & Technology Transfer Director
Brian Michael Jenkins
National Transportation Safety and Security Center Director
Ben Tripousis
National High-Speed Rail Connectivity Center Director
Jan Botha, Ph.D.
Civil & Environmental Engineering San José State University
Katherine Kao Cushing, Ph.D.
Enviromental Science San José State University
Dave Czerwinski, Ph.D.
Marketing and Decision Science San José State University
Frances Edwards, Ph.D.
Political Science San José State University
Taeho Park, Ph.D.
Organization and Management San José State University
Christa Bailey
Martin Luther King, Jr. Library San José State University
A publication of
Mineta Transportation Institute
Created by Congress in 1991College of Business San José State University
EXPLORING STRATEGIES TO IMPROVE MOBILITY AND
SAFETY ON ROADWAY SEGMENTS IN URBAN AREAS
Stephen Arhin, Ph.D. June 2018
1. Report No. 2. Government Accession No. 3. Recipient’s Catalog No.
4. Title and Subtitle 5. Report Date
6. Performing Organization Code
7. Authors 8. Performing Organization Report
9. Performing Organization Name and Address 10. Work Unit No. 11. Contract or Grant No.
12. Sponsoring Agency Name and Address 13. Type of Report and Period Covered 14. Sponsoring Agency Code
15. Supplemental Notes 16. Abstract
17. Key Words 18. Distribution Statement
19. Security Classif. (of this report) 20. Security Classif. (of this page) 21. No. of Pages 22. Price 116
18-02
Exploring Strategies to Improve Mobility and Safety on Roadway Segments
in Urban Areas June 2018
CA-MTI-1701 Stephen Arhin, Ph.D., P.E., PTOE, PMP
Mineta Transportation Institute College of Business
San José State University San José, CA 95192-0219 U.S. Department of Transportation Office of the Assistant Secretary for Research and Technology
University Transportation Centers Program 1200 New Jersey Avenue, SE
Washington, DC 20590
Final Report
Unclassified Unclassified
No restrictions. This document is available to the public through The National Technical Information Service, Springfield, VA 22161
69A3551747127
$15.00 Mobility; throughput; compliance;
travel speed; control delay
Several strategies have been proposed and developed to alleviate the congestion and throughput problem usually experienced in urban areas. These strategies include the use of Intelligent Transportation Systems, signal re-timing and signal coordination, among others. In urban areas, there are often combinations of signalized and un-signalized intersections on corridors that may impact throughput and mobility. This research investigated driver compliance rate (CR) with STOP-signs at All-Way STOP Control (AWSC) intersections that are in close proximity to upstream or downstream signalized intersections. Also, strategies to improve mobility and throughput on segments in an urban area were explored via modeling and simulation.
Thirty isolated segments with combinations of signalized and un-signalized intersections in the District of Columbia were selected for the study. Field data (traffic volumes, signal timing, lane configurations, etc.) were collected at each intersection of the segments. Driver compliance with STOP-signs at AWSC intersections within the segments was also observed. In all, 13,956 observations were made at 57 AWSC intersections. The segments were then modelled in the software program, and two scenarios were simulated. The “before” scenario simulated the existing conditions on the segments. In the “after” scenario, the AWSC intersections in each segment were signalized (and optimized), while maintaining the same conditions at the signalized intersections. Control delay and average travel speed were the measures of effectiveness (MOEs) that were used to assess the performance of the segments in both scenarios.
The results of a regression analysis showed a positive relationship between CR and the distance between the existing AWSC and signalized intersections. A nonlinear regression model developed indicates that, to achieve a minimum compliance rate of 95%, a minimum distance of approximately 1,298 ft. between the intersections is required. Also, a test of comparison of means of the segments’ MOEs in the “before” and “after” scenarios showed significant improvements in the “after” scenarios. Statistically significant reductions in control delays on the segments were reported, while the average travel speed of vehicles significantly increased. The study revealed that even though some un-signalized intersections may not meet the MUTCD warrants for signalization, signalizing and coordinating them with existing signalized intersections will improve mobility and throughput.
To order this publication, please contact: Mineta Transportation Institute
College of Business San José State University San José, CA 95192-0219
Tel: (408) 924-7560 Fax: (408) 924-7565 Email: mineta-institute@sjsu.edu
transweb.sjsu.edu
Library of Congress Catalog Card Number: 2018945554
ACKNOWLEDGMENTS
This report is based upon work supported by the U.S. Department of Transportation’s University Transportation Centers Program under Grant Number 69A3551747127.
The authors and students at the Howard University Transportation Research and Data Center would like to thank the staff of the Mineta Transportation Institute, particularly Executive Director Karen Philbrick, Ph.D.; Research and Technology Transfer Director Hilary Nixon, Ph.D.; Research Support Assistant Joseph Mercado; Executive Administrative Assistant Jill Carter; and Editor Jan Steckel.
Disclaimer:
The contents of this report reflect the views of the authors, who are responsible for the facts and the accuracy of the information presented. This document is disseminated under the sponsorship of the U.S. Department of Transportation’s University Transportation Centers Program, in the interest of information exchange. The U.S. Government assumes no liability for the contents or use thereof.
TABLE OF CONTENTS
Executive Summary 1
I. Introduction 2
II. Research Objectives 3
III. Literature Review 4
Strategies for Improving Mobility on Corridors 5
Performance Indicators for Mobility and Throughput 7
Factors Influencing Noncompliance at Unsignalized Intersections 9 Factors Influencing Noncompliance at Signalized Intersections 10 Countermeasures for Traffic Control Signs and STOP Sign Violations 11
IV. Research Methodology 12
Selection of Study Segments 12
Field Assessment/Existing Conditions 14
Data Collection 40
Data Analysis 43
V. Results 47
Compliance Rates 47
Results of LOS Analysis 50
Statistical Analysis 55
VI. Discussion of Results 62
VII. Conclusions and Recommendations 63
Appendix A: Vehicle Compliance Data Collection Sheet 64
Appendix B: Signal Timing Data Collection Sheet 95
Acronyms and Abbreviations 109
Endnotes 110
Bibliography 112
About the Author 115
LIST OF FIGURES
1. Study Segment Configuration 12
2. Selected Segments in the District of Columbia 13
3. Traffic Recording Camera Installed at Intersection of Study 41 4. Traffic Recording Camera and Turning Movement Counting Box 41
5. Data Analysis Process 43
6. Synchro 9™ Analysis Screen Capture 54
7. Mean Control Delays for the A.M. and P.M. Peaks 56
8. Mean Average Travel Speed for the A.M. and P.M. Peaks 57
LIST OF TABLES
1. Level of Service Criteria for Unsignalized Intersections 8 2. Level of Service Criteria for Signalized Intersections 8
3. Level of Service Criteria for Urban Streets 8
4. List of Selected Segments in the District of Columbia 12
5. Summary of STOP Sign Compliance per Intersection 48
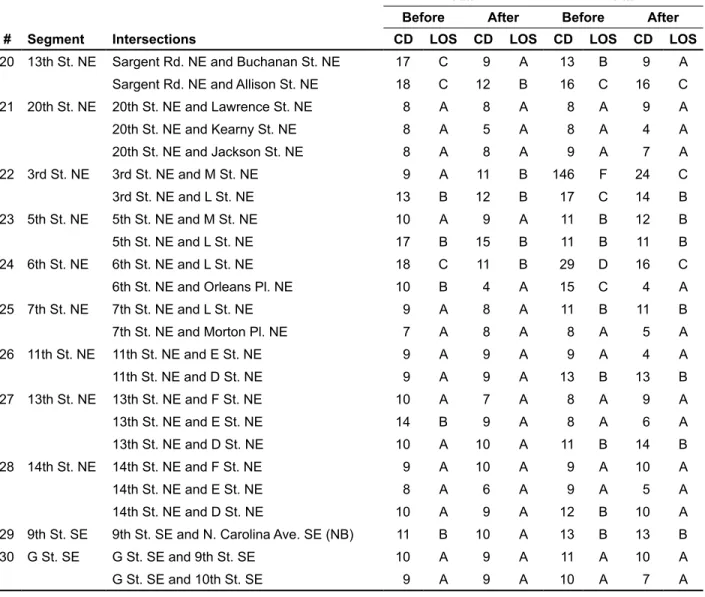
6. Summary of Control Delay and LOS per Signalized Intersection 50 7. Summary of Control Delay 52 8. Summary of Before and After Control Delay and Average Travel Speed
per Segment 53
9. Summary of Descriptive Statistics for STOP Sign Compliance 55
10. Summary of Descriptive Statistics for Control Delay 56
11. Summary of Descriptive Statistics for Average Segment Travel Speed 57
12. Regression Coefficients 58
13. ANOVA Results 58
14. T-Test Results – Control Delay 60
EXECUTIVE SUMMARY
Congestion is a critical problem in dense urban areas in the United States. In 2016, Los Angeles, California was ranked the most congested city in the United States with 104 hours of congestion during that year. Most roadway networks in urban areas consist of combinations of signalized and unsignalized intersections for managing safety, throughput and mobility. The Manual on Uniform Traffic Control Devices (MUTCD) has prescribed warrants for signalizing intersections. However, on some corridors where unsignalized intersections do not meet the MUTCD warrants, their adverse effect on mobility is compounded.
This research investigated driver compliance rate (CR) with STOP-signs at All-Way STOP Control (AWSC) intersections that are in close proximity to upstream or downstream signalized intersections and explored the existence of a relationship between CR and the distance between the two successive intersections in the traffic stream. In addition, strategies to improve mobility and throughput on segments in an urban area were explored via modeling and simulation.
Thirty isolated segments with combinations of signalized and unsignalized intersections in the District of Columbia were selected for the study. Field data (traffic volumes, signal timing, lane configurations, etc.) were collected at each intersection of the segments. Driver compliance with STOP-signs at AWSC intersections within the segments were also observed. In all, 13,956 observations were made at 57 AWSC intersections. The segments were then modelled in the software program, and two scenarios were simulated. The “before” scenario simulated the existing conditions on the segments. In the “after” scenario, the AWSC intersections in each segment were signalized (and optimized), while maintaining the same conditions at the signalized intersections. Control delay and average travel speed were the measures of effectiveness (MOEs) that were used to assess the performance of the segments in both scenarios.
The study showed that lower CRs were observed at AWSC intersections that were in closer proximity to the signalized intersections. Thus, the shorter the distance between the existing AWSC to signalized intersections, the lower was the CR (or the higher was the violation rate). The results of a regression analysis showed a positive relationship between CR and the distance. The regression model developed indicates that, to achieve a minimum compliance rate of 95%, a minimum distance of approximately 1,298 ft. between the intersections is required. Also, a test of comparison means of the segments’ MOEs in the “before” and “after” scenarios showed significant improvements in the “after” scenarios. Statistically significant reductions in control delays on the segments were reported, while the average travel speed of vehicles significantly increased. The research showed that even though some unsignalized intersections may not meet the MUTCD warrants for signalization, signalizing and coordinating them with existing signalized intersections improves mobility and throughput.
I. INTRODUCTION
Several cities across the United States are rethinking their strategies to improve mobility. Urban population is increasing considerably, and roadways are reaching their capacity as travel times increase, and congestion rises. According to the United Nations, in 2016 approximately 54.5% of the population lived in urban settlements, and this number is expected to increase to 60% by 2030. Urbanization statistics indicate that, sooner rather than later, urban infrastructure will be overburdened, and the quality of life of urban residents will decrease dramatically.
In the United States, congestion has become a critical problem in dense urban areas. In 2016, Los Angeles, California was ranked the most congested city in the United States with 104 hours of congestion during that year. Meanwhile, commuters in Washington, DC spent 60 hours in traffic, costing the region’s economy approximately 3 billion dollars in the same year. It is therefore critical for local transportation agencies to reduce congestion and improve mobility. Both federal and local governments recognize the limitation in expanding the physical transportation infrastructure and have explored the different strategies that could be employed to improve throughput, thereby reducing congestion.
In urban areas, most roadway networks consist of combinations of signalized and unsignalized intersections that may affect throughput and mobility. The MUTCD has prescribed warrants for signalizing intersections. However, on some corridors where unsignalized intersections do not meet the MUTCD warrants, their effect on mobility on the corridor is compounded. Moreover, for unsignalized intersections in close proximity to the signalized intersections, compliance with the STOP sign is often violated. Drivers often violate STOP signs in order to travel through the next signalized intersection that may have the green interval.
This research explores the strategy, via modeling and simulation, where such intersections could be signalized and coordinated with existing signalized intersections to improve mobility along those corridors while eliminating driver violations of STOP signs. Thirty segments with combinations of signalized and unsignalized intersections were used in this study. Each segment consisted of at least two signalized intersections and one AWSC intersection where field data collection was conducted (traffic volumes, signal timing, lane configurations, etc.). STOP sign compliance was observed in the “before” scenario, after which segments were modeled using Synchro 9™ software program, based on which a strategy for mobility improvement was explored. The MOEs evaluated were control delay and average travel speed.
The hypothesis that there is a relationship between STOP-sign compliance rate and the distance between each AWSC and signalized intersections (downstream or upstream) was also explored. The model could potentially be used to determine the optimal distance between a pair of AWSC and signalized intersections that may minimize driver noncompliance with STOP signs within segments.
II. RESEARCH OBJECTIVES
This research focused on roadway segments in the District of Columbia, which is a built-up urban area with unique street configurations that are often plagued with congestion, mobility and throughput issues. The following are the objectives of this study:
• To determine average driver CR at AWSC intersections near signalized intersections. • To explore the existence of a relationship between CR and the distance between
the unsignalized and signalized intersection. Such a relationship could be used to determine the optimal distance between the AWSC and signalized intersections that might help reduce noncompliance of STOP signs within the segments.
• To explore the viability of signalizing the unsignalized intersections to improve mobility and throughput on segments in an urban area via modeling and simulation.
III. LITERATURE REVIEW
Transportation mobility is defined as the movement of people and goods from one location to another.1 Among the many factors that affect mobility and throughput, traffic congestion is the most critical. This is especially so in urban areas during morning and evening peak hours. The cost of traffic congestion in the United States was estimated to be $124 billion as of 2013. Specifically in metropolitan areas, it accounts for $87 billion dollars annually and is estimated to increase to $186 billion by 2030. The major contributors to these dollar values are the costs arising from the time wasted in traffic, excessive fuel consumption, and the degradation of the environment.2
Traffic congestion proliferates losses and results in negative impacts in many sectors of the urban lifestyle including harm to the environment and reduction in quality of life, productivity, and business success. In 2003, Weisbrod et al. studied the effect on economic costs as a result of urban traffic congestion.3 The strategic empirical analysis investigated different characteristics of resulting business operations costs due to congestion in metropolitan areas. The study incorporated data collection and statistical analysis to examine different types of business activities and their correlation with costs of transporting products and commuting workers. Data on patterns of business locations, travel patterns and commuting trips was obtained from Chicago (1,669 zones) and Philadelphia (1,510 zones) metropolitan areas. Regression analysis was employed to establish coefficients (levels of business activities in selected zones) as functions of different factors including labor access, commuting and delivery charges.
The output obtained from the calibrated models for Chicago and Philadelphia produced uniform results in the field of industry differences in congestion costs, effect on travel pattern and economies of scale. There were significantly higher costs for areas with industries associated with extensive labor requirements and higher levels of truck shipping during congestion. There was no significant impact of congestion on the firms with lower-skilled labor and input requirements. The model predicted a six-and-a-half percent increase in business productivity when the effective labor market was doubled. The authors also investigated different hypothetical scenarios (six percent reduction in delays of truck delivery in downtown business district and central industrial area outside downtown, 10% reduction in worker commuting, and 50% reduction in commuting delays). The annual change in business costs after the analysis for truck deliveries ranged from $252-272 million for Chicago and $23-100 million for Philadelphia. The reduction of congestion for truck deliveries to downtown businesses resulted in increased profits since it allowed businesses to focus on service.
Economic benefit was also observed at the periphery of urban areas after reducing congestion region-wide, signifying the possibility of increase in business efficiency and a reduction in the need to disperse labor and delivery markets. Transportation demand has continued to increase over the past years.4 In addition to the delays that residents in urban areas (e.g., Washington, DC) experience on a daily basis, congestion also affect other aspects of the environment such as air quality. According to the INRIX Global Traffic Scorecard,5 Washington DC is the sixth most congested city in the U.S. and the 18th in the world. The report indicates that residents in the DC metropolitan area spend approximately
61 hours in traffic, which in turn costs each driver nearly $1,700 per year and costs the region’s economy more than $2.9 billion.
The causes of traffic congestion are well documented, with high traffic volumes and frequent interruptions of traffic flow in the lead. The most common traffic flow interruptions originate at or near intersections. Ideally, it is recommended that the minimum spacing for intersections in urban areas be 0.5 miles.6 In urban areas, however, intersections are much more closely spaced since there is a competing need for providing an adequately dense street network to allow road users to have several route options and to provide land access. Intersections in urban areas are either controlled or uncontrolled. When access to an intersection is regulated by traffic signals or regulatory signs, it said to be controlled, while it is uncontrolled when access is regulated by right-of-way rules. Controlled intersections are either signalized or unsignalized. Signalized intersections are controlled by signals while unsignalized intersections are controlled by either STOP signs or yield signs. The STOP signs are installed either on the minor roads only (Two-Way STOP control – TWSC) or on all approaches (AWSC).
In dense urban areas, most of the roadway networks consist of combinations of signalized and unsignalized intersections, which may affect throughput and mobility. The MUTCD has prescribed warrants for signalizing intersections. However, on some corridors where unsignalized intersections do not meet the MUTCD warrants for signalization, their effect on mobility is compounded. According to the MUTCD, Section 1A-09, the decision to use a particular traffic control device at a specified location should be made based on an engineering study or the application of an engineering judgment, both of which shall be performed by an engineer or by an individual working under the supervision of an engineer.7 In 2015, a total of 48,923 vehicles were involved in fatal crashes in the United States. Out of the total, approximately 4.4% (2,157) of the fatal crashes occurred at STOP-controlled intersections, while 7.5% (3,672) of the crashes occurred at intersections controlled by traffic signals. On the other hand, intersections without any type of traffic control device recorded the highest number of fatal crashes (4,227).8
The Federal Highway Administration (FHWA) reported that since 2005, there has been a decline in the overall number of crashes that occur at or in close proximity to intersections.9 Nevertheless, crashes at intersections are still a major concern for traffic authorities. Most of these crashes occur due to the failure of a driver to stop or yield the right-of-way. STRATEGIES FOR IMPROVING MOBILITY ON CORRIDORS
Several strategies have been adopted to improve congestion mobility and safety on road corridors. These measures are aimed at minimizing delays at signalized intersections and on road segments. Some of these strategies are described in the following sections. Actuated Signalized Controls
Actuated signals are traffic signals with the capability to respond to the presence of vehicles or pedestrians at intersections. Phase intervals are called and extended via the use of vehicle detectors. In such a system, traffic signal controllers are not only capable
of varying the cycle length and green times in response to detector actuation, but can also alter the order and sequence of phases. This type of mobility improvement strategy has the advantage of reducing delay, being adaptable to short-term fluctuations in traffic flow and increasing highway capacity. On the other hand, actuated signalized controls can be rendered redundant if traffic demand pattern regularizes over time. In addition, the installation and maintenance cost are known to be three times that of pre-timed signals.10 Traffic Signal Coordination
Traffic signal coordination is a mechanism which allows a series of signals along a corridor to turn green based on synchronized timers, pre-assigned speeds to current traffic patterns, and congestion levels. This system aims at clearing the maximum number of vehicles through consecutive intersections at maximum safe speeds and minimal delays. This mechanism is known to be a cost-effective alternative for reducing travel delays.11 Signal Re-Timing
Signal re-timing optimizes the operations of signalized intersections by developing and implementing new signal-timing parameters. This has been proven to be an effective way of reducing delay time on corridors where traffic patterns are reasonably constant over time. The benefits of signal re-timing include fewer stops, reduced fuel consumption, and reduced delays along coordinated signalized corridors. The analysis of the results of signal re-timing performed on a section of New Hampshire Avenue, in Washington, DC, showed that delays were reduced by 13% and progression through the section improved.12
Reversible Traffic Lanes and One-Way Lanes
The direction of a lane on a two-way road can be reversed to increase the capacity of the peak direction. Thus, available lane capacity is temporarily obtained from the off-peak direction to reduce congestion. This strategy is effective in handling special event traffic, morning and evening peak commutes periods and construction and maintenance activities. These adjustments (managed by changeable message signs and/or arrow panels) occur at specified times of day, or when volume exceeds certain limits. The direction of the reversed lane at a particular time is indicated by variable message signs.13
Furthermore, a few measures have been proposed to improve mobility and throughput at unsignalized intersections. For unsignalized intersections in close proximity to or in between signalized intersections, the FHWA recommends the re-timing of adjacent signals to create more gaps in traffic for turning maneuvers at unsignalized intersections. The re-timing process could also require changing the phasing of the existing signal. The downside of this measure is that re-timing could reduce the level of service and progression on through streets. Automated real-time systems and innovative signs and markings to inform drivers of suitable gaps for turning or crossing maneuvers have also been proposed.14
Other Measures
Decreasing congestion and increasing mobility along corridors are both integral parts of an efficient transportation network for the DC region. Vehicle crashes, breakdowns, construction or other unpredictable events result in approximately half of the congestion in large urban areas. According to Staley (2012), improving arterial efficiency provides significant benefits for relatively small costs. Some strategies for improving efficiency include traffic signal optimization, Intelligent Transportation Systems (ITS) deployments and incident management.15 Staley’s study showed that traffic signal optimization in cities like London, Los Angeles and Beijing has improved travel time by up to 13%, and traffic signal coordination has greatly reduced delays along arterial roadways. In addition, some roadway segments may no longer be sufficient to carry volumes of traffic generated through urbanization. Hence, there may be a need to reconfigure existing traffic flow patterns or completely redesign intersections to serve new travel needs and patterns.
Traffic-signal-timing optimization, properly implemented, could significantly improve network performance by reducing delay, increasing network throughput, reducing number of stops, or increasing average travel speed in the network. Another effective method for congestion reduction is transportation supply management, which can be implemented in the form of optimal or near-optimal signal-timing parameters in a network (i.e., cycle length, phase plane, green splits, and offset optimization). It is a known fact that signal timing at one intersection can impact the state of other intersections. The majority of traffic-signal optimization methods use the concept of delay minimization, either alone or in combination with other factors. Delay minimization works well in undersaturated conditions where demand is less than the capacity and usually the queue dissipates before the green signal ends. The goal of improving mobility and reducing congestion for transportation systems within urban areas can also be tackled using ITS deployments. ITS can support a regional communications system that provides real-time travel conditions and emergency management information to transportation agencies, emergency response providers and the general public. In many large urban areas, congestion may result from incident-driven sources such as vehicle crashes, construction, or other unpredictable events. Using regional traffic management technology such as a Closed-Circuit Television (CCTV) to change traffic signal timings at intersections can significantly improve travel speeds. PERFORMANCE INDICATORS FOR MOBILITY AND THROUGHPUT
In evaluating mobility and throughput on road networks, traffic engineers utilize certain performance indicators which are derived from traffic data such as traffic volumes, speeds and traffic control devices. These performance indicators include Level of Service (LOS), vehicular delays, queue lengths, travel times and headways.
Level of Service (LOS)
The LOS of intersections and urban streets describes their quality of service. At intersections, the LOS is evaluated based on the average control delay per vehicle for movements through the intersection. On urban streets, the LOS is defined as the mean speed of through traffic.
In a survey conducted by Sutaria and Haynes (1977), it was revealed that delay ranked first among other factors (such as traffic congestion, number of stops, difficulty in changing lane and number of buses) that influenced participants’ perception of the quality of service of an intersection.16 The 2016 Highway Capacity Manual prescribes six levels of services ranging from A to F based on the average vehicle delay (at intersections) and mean speed traffic (on urban streets). Tables 1 through 3 present the LOS criteria for unsignalized, signalized and urban streets, respectively.
Table 1. Level of Service Criteria for Unsignalized Intersections Level of Service Average Control Delay (sec/veh)
A 0 to 10 B > 10 to 15 C > 15 to 25 D > 25 to 35 E > 35 to 50 F > 50 veh = vehicle.
Table 2. Level of Service Criteria for Signalized Intersections Level of Service Average Control Delay (sec/veh)
A ≤10 B > 10 to 20 C > 20 to 35 D > 35 to 55 E > 55 to 80 F > 80 veh = vehicle.
Table 3. Level of Service Criteria for Urban Streets Urban Street Class Speed (mph)Free-Flow
Travel Speed Threshold (Lower Limit) by Level of Service (mph)
A B C D E І 55 >47 >37 >28 >22 >17 50 43 34 25 20 15 45 38 30 23 18 14 ІІ 45 38 30 23 18 14 40 34 27 20 16 12 35 30 23 18 14 11 ІІІ 35 30 23 18 14 11 30 26 20 15 12 9 ІV 35 30 23 18 14 11 30 26 20 15 12 9 25 21 17 13 10 8
Travel Time
Travel time is the total time spent traveling along a route between any two points of interest. It is usually obtained by either directly measuring this time on the field or using computer simulation models. Travel time comprises of running time (or time in which the mode of transport is in motion) and stopped delay time (or time in which the mode of transport is stopped).17
Headway
There are two types of headway: time headway and space headway. Time headway is the time difference between any two successive vehicles when they cross a given point. Space headway is the distance between corresponding points of two successive vehicles at any given time. The average of vehicle headways is the reciprocal of flow rate; hence vehicle headways represent microscopic measures of flows passing a point and the roadway capacity.18,19
Queue Lengths
Queue lengths at intersections are parameters used to estimate capacity. At signalized intersections, the most critical queue length is measured at the end of the red interval. While the average queue length gives an indication of the capacity of the intersection, the 95th percentile queue length is used to determine the length of turning lanes in intersection design.20
FACTORS INFLUENCING NONCOMPLIANCE AT UNSIGNALIZED INTERSECTIONS
Several studies have been conducted to determine the different factors that affect drivers’ compliance with right-of-way rules at intersections. In 1977, Mounce concluded that traffic volumes on a major roadway had a strong negative relationship with the total violation rate. According to Mounce, as traffic volume increases, the total number of violations decreased. This was established by observing motorists’ compliance at 66 unsignalized intersections in south central Texas, during which a total of 2,830 vehicles were observed. The variables considered in this study were major roadway volume, minor roadway sight distance, traffic conditions and intersection geometry.21
Mounce observed three levels of compliance: full compliance, partial violation and complete violation. A vehicle was considered to be fully compliant if it came to a complete stop at the STOP sign. A partial violation was defined as when a vehicle entered the intersection with a rolling stop at a speed of approximately five mph. A complete violation was when a vehicle didn’t stop before entering the intersection with a speed of five mph or more. The compliance rate of each intersection was then calculated.
A factorial experimental design was utilized to determine which variable influenced the compliance rate the most. The results revealed that major roadway volume significantly affected compliance rate. In addition, the interaction effect of major roadway volumes and
minor road sight distance significantly affected compliance rate. Intersection geometry type was determined not to contribute to the rate of compliance. From the results, Mounce recommended that STOP signs should be installed on minor streets where major street volumes are low to improve throughput.21
In 2012, Woldeamanuel conducted an observational study to examine how drivers’ behavior at STOP-controlled intersections is affected by different sociodemographic and physical attributes. The variables used in this study included gender, age, number of passengers, time of day, urban setting, presence of law enforcement and headlight usage. A total of 2,400 observations were made at four major intersections in the Saint Cloud, Minnesota area. The stop events were classified as complete, rolling or no stop. The results of the study revealed that 35% of the drivers made a complete stop, whereas 65% of them did not make a complete stop (52% making a rolling stop and 13% not making any stop at all). Five of the variables (age, number of passengers in the vehicle, time of day, presence of law enforcement and headlight usage) were found to significantly influence the behavior of drivers. The results indicate that older drivers were more likely to comply with STOP signs at intersections. In addition, the likelihood of making a complete stop increased with the number of passengers in the vehicle. It was also more likely that drivers would come to a complete stop at night than during the day. The results showed that presence of police enforcement increased the likelihood of drivers coming to a complete stop. Finally, the likelihood of drivers making a complete stop decreased with less headlight usage.22
FACTORS INFLUENCING NONCOMPLIANCE AT SIGNALIZED INTERSECTIONS
Noncompliance is not limited to unsignalized intersections. In 2006, Huey and Ragland examined the effects of pedestrian countdown signals on driver behavior at two intersections with similar traffic flow, geometry and lane configurations in Berkeley, California. Approximately 80 traffic cycles were observed each day for two days at both locations. One intersection had pedestrian countdown signals and the other had traditional pedestrian signals. The results showed that the information provided by pedestrian countdown intersections allowed drivers to either increase their speed, maintain their speed, or decelerate in order to stop and wait for the next phase as they approached the intersection. On the other hand, when approaching a traditional intersection, drivers had less information resulting in “last second” attempts to cross at the end of the yellow interval. The study concluded that countdown pedestrian signals have both positive and negative effects on the drivers’ behavior. The additional information allows drivers to make informed decisions about whether to maintain their speed or slow down and avoid taking risks trying to “catch the light.” However, drivers may feel more comfortable entering the intersection at higher speeds, making them less able to avoid an unexpected vehicle or pedestrian and potentially cause an increase in red-light running.23
In 2010, Elmitiny investigated how certain variables affect a driver’s decision to stop or go on a red light at intersections. The variables included distance of the vehicle from the STOP line, speed, yellow light entry time, whether the vehicle was in the lead or following position, lane position, and vehicle type. The study intersection was located on a high-speed corridor in a Central Florida suburb. Data was collected using a three-camera
video-based system which recorded drivers’ behavior associated with traffic signal change. A total of 1,292 vehicle observations were made. The results of the statistical analysis showed that the speeds of vehicles significantly affected drivers’ decision to stop or go. Vehicles which approached the intersection at higher speed were more likely to violate the red light. In addition, the probability of a stop decision increased as the distance of the vehicle from the STOP line increased. Drivers within 280 ft. to 320 ft. of the intersection had probabilities of both stop and go decisions close to 0.5. This implies that vehicles within this interval showed the largest variability in their decision to stop or go during the yellow phase interval. Additionally, 90% of red-light-violators were within the 210 ft. to 480 ft. range of the intersection.24
In 2013, Chuanyun et al. also examined the contributing factors affecting compliance with traffic signs and signals. The study concluded that at signalized intersections, incoming drivers are usually puzzled whether to speed up or slow down when the traffic signal changes from green to yellow. If they are far from the traffic signal, they tend to speed through the intersection and this may lead to a traffic signal violation. If they suddenly slow down, it may result in rear-end collision.25
COUNTERMEASURES FOR TRAFFIC CONTROL SIGNS AND STOP SIGN VIOLATIONS
Various measures have been tested to mitigate the violation of traffic control signals and STOP signs. In 2009, Rice and Polanis showcased low-cost plans to improve safety at four STOP-controlled intersections in Winston-Salem, North Carolina. Various measures were taken to improve visibility and pavement markings at the intersections. These included the replacement of existing 24-inch STOP signs with 30-inch STOP signs, installing “STOP AHEAD” signs before the STOP signs, and providing double yellow centerlines and stop bar pavement markings. This treatment reduced crashes by 56.7% and improved throughput.26 Recently, advanced techniques including the use of infrastructure and vehicle-based collision avoidance systems are being implemented to increase compliance. These systems utilize roadside sensors, processors, warning devices, roadside-vehicle communication devices and other roadside informational and warning devices to provide driving assistance to road users. Currently, connected vehicle-based approaches are being proposed to improve throughput at intersections. These technologies enable the real time sharing of vehicle data such as position, speed and acceleration.27
IV. RESEARCH METHODOLOGY
SELECTION OF STUDY SEGMENTSA total of 30 segments located on arterial and collector roads were selected in the District of Columbia for this study. Each segment consists of at least two signalized intersections and one AWSC intersection. The segments are such that no two signalized intersections are successive, with at most two AWSC intersections in between. A typical segment configuration is presented in Figure 1. The list of intersections selected for this study is presented in Table 4 and in Figure 2.
Figure 1. Study Segment Configuration
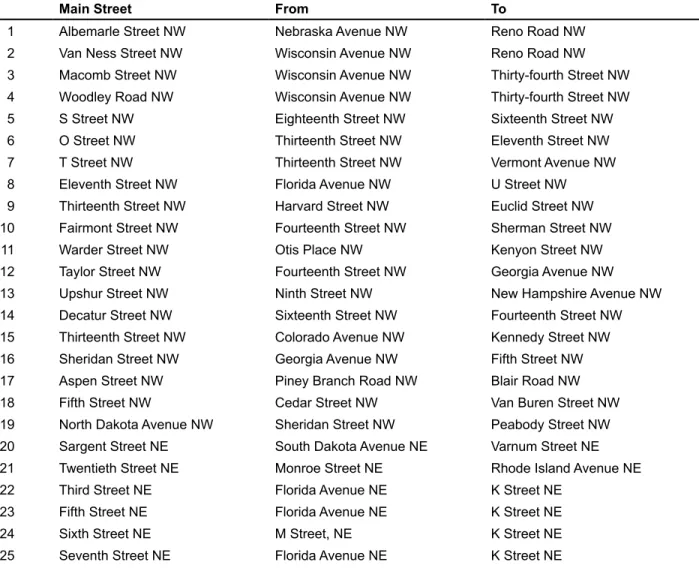
Table 4. List of Selected Segments in the District of Columbia
Main Street From To
1 Albemarle Street NW Nebraska Avenue NW Reno Road NW 2 Van Ness Street NW Wisconsin Avenue NW Reno Road NW 3 Macomb Street NW Wisconsin Avenue NW Thirty-fourth Street NW 4 Woodley Road NW Wisconsin Avenue NW Thirty-fourth Street NW 5 S Street NW Eighteenth Street NW Sixteenth Street NW 6 O Street NW Thirteenth Street NW Eleventh Street NW 7 T Street NW Thirteenth Street NW Vermont Avenue NW 8 Eleventh Street NW Florida Avenue NW U Street NW 9 Thirteenth Street NW Harvard Street NW Euclid Street NW 10 Fairmont Street NW Fourteenth Street NW Sherman Street NW
11 Warder Street NW Otis Place NW Kenyon Street NW
12 Taylor Street NW Fourteenth Street NW Georgia Avenue NW 13 Upshur Street NW Ninth Street NW New Hampshire Avenue NW 14 Decatur Street NW Sixteenth Street NW Fourteenth Street NW 15 Thirteenth Street NW Colorado Avenue NW Kennedy Street NW 16 Sheridan Street NW Georgia Avenue NW Fifth Street NW 17 Aspen Street NW Piney Branch Road NW Blair Road NW 18 Fifth Street NW Cedar Street NW Van Buren Street NW 19 North Dakota Avenue NW Sheridan Street NW Peabody Street NW 20 Sargent Street NE South Dakota Avenue NE Varnum Street NE 21 Twentieth Street NE Monroe Street NE Rhode Island Avenue NE 22 Third Street NE Florida Avenue NE K Street NE
23 Fifth Street NE Florida Avenue NE K Street NE
24 Sixth Street NE M Street, NE K Street NE
Main Street From To
26 Eleventh Street NE Maryland Avenue NE C Street NE 27 Thirteenth Street NE Maryland Avenue NE C Street NE 28 Fourteenth Street NE Maryland Avenue NE C Street NE
29 Ninth Street SE E Capitol Street SE Independence Avenue SE
30 G Street SE Eighth Street SE Eleventh Street SE
FIELD ASSESSMENT/EXISTING CONDITIONS
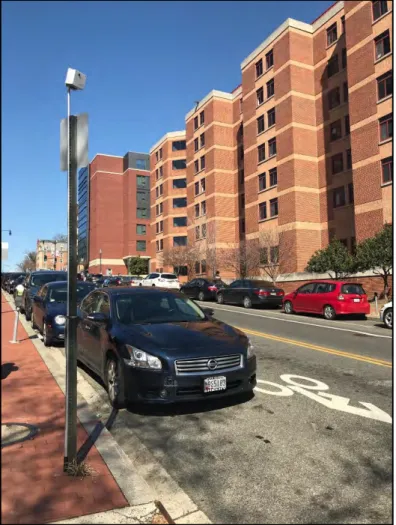
A field assessment was conducted between April and December 2017 to obtain inventory of existing conditions at all the intersection and their approaches along the selected segments. The information gathered in the field included the geometric characteristics of the approaches, pavement type, existing signs and markings conditions, and presence of parking restrictions. Pedestrian and vehicular activities were also observed. The existing conditions along the segments and their intersections are described in the next sections. Albemarle Street, NW between Nebraska Avenue and Reno Road, NW
This segment consists of three intersections located in the Northwest quadrant of the District of Columbia. The main segment, Albemarle Street, NW, is classified as a collector road and is located in a residential area. Albemarle Street, NW is a bidirectional street (one lane per direction) which runs in the east-west direction. It is approximately 1,358 feet long and 32 feet wide (curb to curb) with on-street parking on both sides of the street. The following intersections are located within this segment.
Albemarle Street and Nebraska Avenue, NW
The intersection of Albemarle Street and Nebraska Avenue, NW is signalized. Nebraska Avenue, NW is a bidirectional principal arterial road with two lanes per direction and runs in the north-south orientation. The road is approximately 37 feet wide (curb to curb) with restricted parking on both sides. The posted speed on Nebraska Avenue, NW is 30 mph.
Albemarle Street and Thirty-Eighth Street, NW
Albemarle Street and Thirty-Eighth Street, NW is an AWSC intersection. Thirty-Eighth Street, NW is a bidirectional local street with one lane per direction and runs in the north-south orientation. The road is approximately 30 feet wide (curb to curb) with residential parking on both sides. The posted speed limit on Thirty-Eighth Street is 25 mph.
Albemarle Street and Reno Road, NW
The intersection of Albemarle Street and Reno Road, NW is signalized. Reno Road, NW is classified as a minor arterial bidirectional road with one lane per direction and runs in the north-south orientation. It is approximately 37 feet wide (curb to curb), with no parking on either side of the street. The posted speed limit on Reno Road is 25 mph.
Van Ness Street, NW between Wisconsin Avenue and Reno Road, NW
The study segment consists of four intersections located in a residential area in the northwest quadrant of the District of Columbia. The main segment, Van Ness Street, NW is a bidirectional collector road with one lane per direction and runs in an east-west direction. The road is approximately 2,190 feet long and 36 feet wide (curb to curb) and includes on-street parking on the north side of the road. The posted speed limit on Van Ness Street, NW is 25 mph. The following intersections are located within this segment.
Van Ness Street and Wisconsin Avenue, NW
The intersection of Van Ness Street and Wisconsin Avenue, NW is signalized. Wisconsin Avenue, NW is a bidirectional principal arterial road which runs in the north-south orientation. The road is approximately 63 feet wide (curb to curb) with on-street parking on one side of the street. The posted speed limit on Wisconsin Avenue, NW is 30 mph.
Van Ness Street and Thirty-Eighth Street, NW
The intersection of Van Ness Street and Thirty-Eighth Street, NW is unsignalized and controlled by All-Way STOP signs on all approaches. Thirty-Eighth Street, NW is a bidirectional local street which runs in the north-south orientation. It is approximately 29 feet wide (curb to curb), with on-street parking on both sides. The posted speed limit on Thirty-Eighth Street, NW is 25 mph.
Van Ness Street and Thirty-Seventh Street, NW
The intersection of Van Ness Street and Thirty-Seventh Street, NW is unsignalized and controlled by All-Way STOP signs on all approaches. Thirty-Seventh Street, NW is a bidirectional local street which runs in the north-south orientation. The road is approximately 32 feet wide (curb to curb), with on-street parking on both sides of the street. The posted speed limit on Thirty-Seventh Street, NW is 25 mph.
Van Ness Street and Reno Road, NW
Van Ness Street and Reno Road, NW is a signalized intersection. Reno Road, NW is a bidirectional minor arterial street which runs in the north-south orientation, approximately 32 feet wide (curb to curb), with no-street parking on either side of the street. The posted speed limit on Reno Road, NW is 25 mph.
Macomb Street, NW between Wisconsin Avenue and Thirty-Fourth Street, NW The study segment consists of four intersections located in a residential area in the northwest quadrant of the District of Columbia. The main segment, Macomb Street, NW, is a bidirectional road oriented in the east-west direction and is classified as a local roadway. Macomb Street, NW has permitted on-street parking on both sides and a posted speed limit of 25 mph. The length and width of the segment is approximately 1,720 feet long and 30 feet wide (curb to curb). The following intersections are located within the segment.
Macomb Street and Wisconsin Avenue, NW
The intersection of Macomb Street and Wisconsin Avenue, NW is signalized. Wisconsin Avenue, NW is a bidirectional minor arterial with two lanes per direction, and it is oriented in the north-south direction. The road is approximately 60 feet wide (curb to curb) and has permitted on street parking on both sides of the street. This intersection has restricted right turns on red signal. The posted speed limit on Wisconsin Avenue, NW is 30 mph.
Macomb Street and Thirty-Sixth Street, NW
The intersection of Macomb Street and Thirty-Sixth Street, NW is unsignalized and controlled by All-Way STOP signs on all approaches. Thirty-Sixth Street, NW is a bidirectional local road with one lane per direction. It also has a north-south direction with on-street parking on both sides of the street and a posted speed limit of 25 mph. Thirty-Sixth street is approximately 30 feet wide (curb to curb).
Macomb Street and Thirty-Fifth Street, NW
The intersection of Macomb Street and Thirty-Fifth Street, NW is unsignalized and controlled by All-Way STOP signs on all approaches. Thirty-Fifth Street, NW is a bidirectional local road with one lane per direction and is oriented in the north-south direction. In addition, it is approximately 30 feet wide and has on-street parking on both sides of the street. Thirty-fifth Street, NW has a posted speed limit of 25 mph.
Macomb Street and Thirty-Fourth Street, NW
The intersection of Macomb Street and Thirty-Fourth Street NW is signalized. Thirty-Fourth Street, NW is a bidirectional local road with one lane per direction and has a north-south orientation. The road is approximately 30 feet wide (curb to curb), and there is permitted on-street parking on both sides of the street. The northbound and southbound approaches have two receiving lanes, of which one is a left-turn storage lane.
Woodley Street, NW between Wisconsin Avenue and Thirty-Fourth Street, NW The study segment consists of four intersections located in a residential area in the northwest quadrant of the District of Columbia. The main segment, Woodley Street, NW is a bidirectional road oriented in the east-west direction and is classified as a local roadway. Woodley Street, NW has permitted on-street parking on both sides of the street and a posted speed limit of 25 mph. The segment is approximately 1,785 feet long and 30 feet wide (curb to curb). The following intersections are located within the segment.
Woodley Street and Wisconsin Avenue, NW
The intersection of Woodley Street and Wisconsin Avenue, NW is signalized. Wisconsin Avenue, NW is a bidirectional minor arterial with three lanes per direction, and it is oriented in the north-south direction. The road is approximately 60 feet wide (curb to curb) and has permitted on-street parking on both sides of the street. In addition, right turns are restricted on red signal. The posted speed limit on Wisconsin Avenue, NW is 30 mph.
Woodley Street and Thirty-Sixth Street, NW
The intersection of Woodley Street and Thirty-Sixth Street, NW is unsignalized and controlled by All-Way STOP signs on all approaches. Thirty Sixth Street, NW is a bidirectional local road with one lane per direction and is oriented in the north-south direction. Thirty-Sixth Street is approximately 30 feet wide (curb to curb) with on-street parking on both sides and a posted speed limit of 25 mph.
Woodley Street and Thirty-Fifth Street, NW
The intersection of Woodley Street and Thirty-Fifth Street, NW is controlled by All-Way STOP signs on all approaches. Thirty-Fifth Street, NW is a bidirectional local road with one lane per direction and is oriented in the north-south direction. Thirty-Fifth Street is approximately 30 feet wide (curb to curb) with on-street parking on both sides and a posted speed limit of 25 mph.
Woodley Street and Thirty-Fourth Street, NW
Woodley Street and Thirty-Fourth Street, NW is controlled by a traffic signal. Thirty-Fourth Street, NW is a bidirectional local road with one lane per direction and is oriented in the north-south direction. The road is approximately 30 feet wide (curb to curb), and on-street parking is not permitted near the north- and southbound approaches. The northbound and southbound approaches have two receiving lanes of which one is a left turn storage lane. S Street, NW between Eighteenth Street and Sixteenth Street, NW
The study segment consists of four intersections located in a mixed-use-residential area in the northwest quadrant of the District of Columbia. The main segment, S Street, NW, is a bidirectional street oriented in the east-west direction and is classified as a local roadway. S Street, NW has permitted on-street parking on both sides of the street and a posted speed limit of 25 mph. The segment is approximately 1,470 feet long and 32 feet wide (curb to curb). The following intersections are located within the segment.
S Street and Eighteenth Street, NW
The intersection of S Street and Eighteenth Street, NW is signalized. Eighteenth Street, NW is a minor arterial roadway with a north-south orientation and one lane per direction. There is designated on-street parking on both sides of the north leg and on one side of the south leg of the intersection. The segment is approximately 32 feet wide (curb to curb), with a posted speed limit of 25 mph.
S Street and New Hampshire Avenue, NW
The intersection of S Street and New Hampshire Avenue, NW is unsignalized and controlled by All-Way STOP signs on all approaches. New Hampshire Avenue, NW is a minor arterial roadway with a northeast-southwest orientation and one lane per direction. There are bicycle lanes and designated on-street parking permitted on both sides of the street, with a posted speed limit of 25 mph. The width of the segment is approximately 50 feet (curb to curb).
S Street and Seventeenth Street, NW
S Street and Seventeenth Street, NW is controlled by All-Way STOP signs on all approaches. Seventeenth Street, NW is a one-way minor arterial roadway that runs in the southbound direction and has two lanes per direction. There is permitted on-street parking
on both sides of the street and a bicycle lane on one side of the street. The width of the segment is approximately 43 feet (curb to curb), with a posted speed limit of 25 mph.
S Street and Sixteenth Street, NW
The intersection of S Street and Sixteenth Street, NW is signalized. Sixteenth Street, NW is a principal arterial with a north-south orientation and two lanes per direction. There is permitted on-street parking on both sides, with a posted speed limit of 25 mph. The width of the segment is approximately 48 feet (curb to curb).
O Street, NW between Thirteenth Street and Eleventh Street, NW
The study segment consists of three intersections located in a residential area in the northwest quadrant of the District of Columbia. The main segment, O Street, NW, is a bidirectional road oriented in the east-west direction and is classified as a local road. O Street, NW has permitted on-street parking on both sides of the street and a posted speed limit of 25 mph. The segment is approximately 735 feet long and 31 feet wide (curb to curb). The following intersections are located within the segment.
O Street and Thirteenth Street, NW
The intersection of O Street and Thirteenth Street, NW is controlled by a traffic signal. Thirteenth Street, NW is a bidirectional minor arterial roadway with two lanes per direction, which runs in the north-south orientation. The road is approximately 69 feet wide (curb to curb) and has designated on-street parking and bicycle lanes on both sides of the street. At the Intersection, the eastbound approach of O Street, NW is a one-way street, whereas the westbound approach is a bidirectional road.
O Street and Twelfth Street, NW
The intersection of O Street and Twelfth Street, NW is unsignalized and controlled by All-Way STOP signs on all approaches. Twelfth Street, NW is a one-way lane collector road which runs in the northbound direction. The width of the road is approximately 31 feet (curb to curb). It has a bicycle lane on one side and designated on-street parking on both sides of the street.
O Street and Eleventh Street, NW
The intersection of O Street and Eleventh Street, NW is signalized. Eleventh Street, NW is a bidirectional minor arterial roadway with one lane per direction, which runs in the north-south orientation. The width of the street is approximately 58 feet (curb to curb), and it has designated on-street parking and bicycle lanes on both sides of the street. Both approaches of Eleventh Street, NW have a left-turn storage lane.
T Street, NW between Thirteenth Street and Vermont Avenue, NW
The study segment consists of four intersections located in a residential area in the Northwest quadrant of the District of Columbia. The main segment, T Street, NW, is a one-way local street which runs in an eastbound direction and is approximately 988 feet long and 32 feet wide (curb to curb). There is on-street parking on both sides and a bicycle lane on one side of the street. Vehicles over 1.25 tons are restricted from entering T Street, NW. The following intersections are located within this segment.
T Street and Thirteenth Street, NW
The intersection of T Street and Thirteenth Street, NW is signalized. Thirteen Street, NW is classified as a minor arterial road at the study intersection. It is a bidirectional street which runs in the north-south orientation, and it is approximately 43 feet wide (curb to curb), with restricted parking on both sides of the street. The posted speed limit of Thirteenth Street, NW is 25 mph.
T Street and Twelfth Street, NW
The intersection of T Street and Twelfth Street, NW is unsignalized and controlled by All-Way STOP signs on all approaches. Twelfth Street, NW is a bidirectional local street which runs in the north-south orientation. The road is approximately 33 feet wide (curb to curb) and has on-street parking on both sides of the street. The posted speed limit on both streets is 25 mph.
T Street and Eleventh Street, NW
The intersection of T Street and Eleventh Street, NW is unsignalized and controlled by STOP signs. Eleven Street, NW is a bidirectional local street which runs in the north-south orientation. It is approximately 34 feet wide (curb to curb) and has street parking on both sides. The posted school zone speed limit for Eleventh Street, NW is 15 mph.
T Street and Vermont Avenue, NW
The intersection of T Street and Vermont Avenue, NW is signalized. Vermont Avenue, NW is a bidirectional collector street with two lanes per direction, which runs in the northwest and southeast orientation. The road is approximately 80 feet wide from curb to curb and 28 feet wide from median to curb. Vermont Avenue, NW has on-street parking on both sides of the street and has a posted school zone speed limit of 15 mph.
Eleventh Street, NW between Florida Avenue and U Street, NW
The study segment consists of four intersections located in a mixed-use area in the northwest quadrant of the District of Columbia. The main segment, Eleventh Street, NW, is a bidirectional collector road that is oriented in the north-south direction. Eleventh Street, NW has permitted on-street parking on both sides of the street and a posted speed limit of 25 mph. The segment is approximately 1,370 feet long and 32 feet wide (curb to curb). The following intersections are located within this segment.
Eleventh Street and Florida Avenue, NW
The intersection of Eleventh Street and Florida Avenue, NW is controlled by a traffic signal. Florida Avenue, NW is classified as a bidirectional principal arterial roadway with one lane per direction and is oriented in the east-west direction. The road is approximately 34 feet wide and has permitted on-street parking on both sides of the street. Florida Avenue, NW has a speed limit of 25 mph.
Eleventh Street and W Street, NW
The intersection of Eleventh Street and W Street, NW is controlled by All-Way STOP signs on all approaches. W Street, NW is a one-way local roadway that runs in the eastbound direction. The road is approximately 32 feet wide and has permitted on-street parking on both sides of the street. W Street, NW has a speed limit of 25 mph.
Eleventh Street and V Street, NW
The intersection of Eleventh Street and V Street, NW is controlled by All-Way STOP signs on all approaches. V Street, NW is a one-way local roadway that runs in the westbound direction. The road is approximately 30 feet wide and has on-street parking on both sides of the street. V Street, NW has a speed limit of 25 mph.
Eleventh Street and U Street, NW
The intersection of Eleventh Street and U Street, NW is controlled by a traffic signal. U Street, NW is a bidirectional principal arterial road with two lanes per direction. The road has an east-west orientation and has on-street parking on both sides of the street. The road is approximately 60 feet wide (curb to curb) and has a posted speed limit of 25 mph. Thirteenth Street, NW between Harvard Street and Euclid Street, NW
The study segment consists of four intersections located in a residential area in the northwest quadrant of the District of Columbia. The main segment, Thirteenth Street, NW, is a bidirectional minor arterial roadway with one lane per direction that is oriented in the north-south direction. The segment is approximately 1,084 feet long and 40 feet wide and has permitted on-street parking on both sides of the street. Thirteenth Street, NW has a posted speed limit of 25 mph. The following intersections are located within the segment.
Thirteenth Street and Harvard Street, NW
The intersection of Thirteenth Street and Harvard Street, NW is controlled by a traffic signal. Harvard Street, NW is classified as a one-way minor arterial road that is oriented in an eastbound direction. The roadway is approximately 30 feet wide (curb to curb) and has permitted on-street parking on both sides of the street. Harvard Street, NW has a posted speed limit of 25 mph.
Thirteenth Street and Girard Street, NW
Thirteenth Street and Girard Street, NW is controlled by All-Way STOP signs on all approaches. Girard Street, NW is classified as a bidirectional local road with one lane per direction that is oriented in the east-west direction. The roadway is approximately 30 feet wide (curb to curb) and has permitted on-street parking on both sides of the road. Girard Street, NW has a posted speed limit of 25 mph.
Thirteenth Street and Fairmont Street, NW
The intersection of Thirteenth Street and Fairmont Street, NW is unsignalized and controlled by an All-Way STOP Control. Fairmont Street, NW is classified as a local road with a posted speed limit of 25 mph and on-street parking on both sides. Fairmont Street, NW is bidirectional (one lane per direction) with an east-west orientation and is approximately 30 ft. wide (curb to curb).
Thirteenth Street and Euclid Street, NW
The intersection of Thirteenth Street and Euclid Street, NW is signalized. Euclid Street, NW is classified as a collector road with a posted speed limit of 25 mph. It has on-street parking on both sides of the street. Euclid Street, NW is a bidirectional street with one lane per direction and is oriented in the east-west direction. The width of the segment is approximately 30 ft. wide (curb to curb).
Fairmont Street, NW between Fourteenth Street and Sherman Street, NW This segment consists of four intersections located in a residential area in the northwest quadrant of the District of Columbia. The main segment, Fairmont Street, NW is a bidirectional local road oriented in the east-west direction. It has on-street permitted parking on both sides and a posted speed limit of 25 mph. The length and width of the segment is approximately 1,860 feet and 30 feet (curb to curb), respectively. The study segment consists of the following intersections.
Fairmont Street and Fourteenth Street, NW
The T intersection of Fairmont Street and Fourteenth Street, NW is signalized. Fourteenth Street is a bidirectional minor arterial oriented in the north-south direction. It has on-street parking on both sides of the street and is approximately 55 feet wide (curb to curb). The northbound and southbound approaches of the intersection have two receiving lanes, of which one is a left turn storage lane. Both approaches have bicycle lanes located between the travel and parking lanes. The eastbound approach of the intersection has one receiving lane with restricted parking near the approach of the intersection.