The influence of clouds on surface UV
erythemal irradiance
L. Alados-Arboledas
a,*, I. Alados
b, I. Foyo-Moreno
a,
F.J. Olmo
a, A. Alca´ntara
aaDepartamento de Fı´sica Aplicada, Facultad de Ciencias, Universidad de Granada, 18071, Granada, Spain bDepartamento de Fı´sica Aplicada, Universidad de Ma´laga, Ma´laga, Spain
Received 29 January 2003; accepted 24 February 2003
Abstract
The purpose of this study is to examine the effect of clouds on the ultraviolet erythemal irradiance. The study was developed at three stations in the Iberian Peninsula: Madrid and Murcia, using data recorded in the period 2000 – 2001, and Zaragoza, using data recorded in 2001. In order to determine the cloud effect on ultraviolet erythemal irradiance, we considered a cloud modification factor defined as the ratio between the measured values of ultraviolet erythemal irradiance and the corresponding clear-sky ultraviolet erythemal irradiance, which would be expected for the same time period and atmospheric conditions. The dependence of this cloud modification factor on total cloud amount, cloud type and solar elevation angle was investigated. The results suggest that the effect of cloud on ultraviolet erythemal irradiance can be parameterized in a simple way in terms of the cloud amount. Our results suggest that the same cloud modification factor model can be used at the three analysed locations estimating the ultraviolet erythemal irradiance with mean bias deviation (MBD) in the range of the expected experimental errors. This cloud modification factor is lower than that associated to the whole solar spectral range, indicating that the attenuation for the ultraviolet erythemal irradiance is lower than that associated to other solar spectral ranges. The cloud modification factor for ultraviolet erythemal irradiance presents dependence with solar elevation, with opposite dependencies with solar elevation for overcast and partial cloud cover conditions, a fact that can be explained in terms of the influence of reflection-enhancement of the ultraviolet irradiance in the last case. Concerning the influence of cloud type, a limited study of two cloud categories, low and medium level and high level, indicated that for overcast conditions, lower clouds presents an attenuation of ultraviolet erythemal irradiance 20% greater than that associated to high level clouds.
D2003 Elsevier Science B.V. All rights reserved. Keywords:Ultraviolet irradiance; Cloud forcing; Ozone depletion
0169-8095/03/$ - see front matterD2003 Elsevier Science B.V. All rights reserved. doi:10.1016/S0169-8095(03)00027-9
* Corresponding author. Tel.: +34-58-244024; fax: +34-58-243214.
E-mail address:[email protected] (L. Alados-Arboledas).
1. Introduction
Depletion of the Earth’s ozone layer is considered responsible of an increase in the solar ultraviolet irradiance incoming at surface level (World Meteorological Organization, 1998). Solar ultraviolet irradiance includes (CIE, 1987) the wavelength range 100 – 280 nm (UVC), which is completely absorbed in the Earth’s atmosphere, 280 – 315 nm (UVB), partially absorbed by the stratospheric ozone, and 315 – 400 nm (UVA), which makes up most of the UV irradiance at surface level. While in outer space, UVB and UVA account for about 7.5% of the solar total irradiance, at surface level typically make up between 3% and 5% of the solar total irradiance(Foyo-Moreno et al., 1998). Due to harmful effects of UVB irradiance on biological systems (Diffey, 1991; Grant, 1997; Van der Leun et al.,
1991, 1994, 1998), a considerable number of studies have being developed over the past
20 years. Over human beings, the effect that has centred more attention is the erythema, or sunburn. The efficiency of UV to produce erythema is represented by an action spectrum
(Diffey, 1982)standardized in 1987 by the Comission Internationale de l’Eclarage (CIE)
(McKinlay and Diffey, 1987). The ultraviolet erythemal irradiance, UVER, is thus
obtained by convolution of the solar spectral irradiance at surface level. UVER irradiance incoming at surface level is a result of the combined effects of solar zenith angle, surface elevation, cloud cover, aerosol loading and optical properties, surface albedo and vertical profile of ozone. The precise determination of the role of these parameters is quite difficult, being ground-based studies important in order to improve our understanding of these effects. Cloud cover and aerosols present a high temporal and spatial variability that, especially in the former case, is responsible of a great variability in UVER irradiance. In recent years, there has been a substantial increase in attempts to model the UV irradiance. Unfortunately, cloud and aerosol characteristics of importance for the radiation transfer are seldom known, being the observations network, especially for the aerosols, rather sparse. Concerning the modelling of the cloud effect, knowledge of cloud optical thickness and the drop size distribution with high temporal and spatial resolution is necessary, a task that is limited to specific sites and campaigns. Thus, a different approach, based on commonly accessible data, must be used if the goal is to model UVER irradiance in order to obtain long time series or extended spatial distributions. This paper is devoted to study the cloud effect over the UVER irradiance using information routinely registered in most meteoro-logical stations, cloud type and amount, expressed in terms of fractional cloud coverage in octas (eighths), which usually are recorded in a three hourly basis. This kind of approach has being followed in different studies(Frederick and Snell, 1990; Frederich et al., 1993; Ilyas, 1987; Blumthaler et al., 1994, 1996; Thiel et al., 1997; Kuchinke and Nunez, 1999;
Grant and Heisler, 2000; Josefsson and Landelius, 2000).
The attenuation of UVB radiation by clouds is frequently larger than any other atmospheric parameter; however, it is often only approximated by modelling the effect of monthly or seasonally averaged cloud cover amounts. It is undoubted that clouds can cause large year to year variability in UV radiation and therefore play an important role in the determination of possible range trends(Seckmeyer et al., 1996). The effect of clouds on instantaneous UV levels can vary from small enhancements to almost total reduction
(Matthijsen et al., 2000). Due to the high variability of clouds both in space and time, the quantification of the cloud effect on radiative fluxes over shorter time period is a difficult
task (Frederick and Snell, 1990). Atmospheric aerosol also affects the UVB irradiance, although in a reduced amount in comparison with clouds(Lorente et al., 1996; Dı´az et al.,
2001). Nevertheless, the aerosol parameters are not measured in a routine way in
meteorological stations. For this reason, considering that our purpose is to characterize the cloud effect on UVER, the procedure followed in this study is designed in order to provide the better insight on cloud influence while minimizing the influence of the other factors. In our case, we used an empirically developed model to account for the UVER under cloudless conditions. In this sense, the model, although locally dependent, allows the estimation of cloudless conditions UVER without the requirement of input variables no routinely measured. In any case, this model effectively represents an average effect of the ambient aerosols and was used to normalize the UVER values measured under different cloud cover amounts, providing an estimate of the reduction in irradiance due to a given cloud cover. Considering this reasoning, at a first step, we developed a cloudless model at each one of the considered stations because a priori the type of aerosol predominant over each location can have different properties and effects over the UV spectral range. An approach to the evaluation of the aerosol load at a given location has been obtained using the horizontal visibility information routinely recorded at meteorological stations. This opens the possibility to apply the model to different places assuming that the aerosol presents similar characteristics to that encountered at the places where the model has been developed. In the corresponding section, we will have the opportunity to discuss about this aspect. In our case, we analysed three locations with rather different environments. Thus, Madrid and Zaragoza are inland locations more than 200 km from the coast, while finally Murcia is an inland location about 50 km away from the Mediterranean coast.
2. Data and measurements
The UVER observations were recorded as half hour average values. The measurements were performed in the Spanish UVB radiometric network.Martinez-Lozano et al. (2002)
present a detailed description of this network. Yankee UVB-1 radiometer are operated and maintained by the Spanish Meteorological Institute. In the stations selected for this study, simultaneous observations of ozone columnar content were performed by means of the Brewer instrument operated within the same network at the selected locations. This allows the use of locally measured ozone together with the cloud observations routinely performed at these stations following the World Meteorological Organization guidelines. The Yankee UVB-1 radiometer is broadband (280 – 330 nm) Robertson – Berger type radiometer. The spectral response of the instrument is designed to approximate the spectral response of the human skin to UV(McKinlay and Diffey, 1987). The maintenance of the calibration constant of the instruments included in the Spanish UVB radiometric network is described in Martinez-Lozano et al. (2002). The experimental uncertainty of this instrument is about 8 – 9%(Leszczynski et al., 1998; Pearson et al., 2000).
Three hourly cloud type, cover in octas, ct, and height were obtained from the meteorological stations of the Spanish Meteorological Institute where the radiometers are installed. In this study, we also used the horizontal visibility data determined by meteorological observers in km.
In this study, we use data registered at Madrid (40j27VN, 3j44VW, 580 m a.s.l.), Murcia (38j00VN, 1j10VW, 69 m a.s.l.), during the period 2000 – 2001, and Zaragoza (41j38VN, 0j55VW, 250 m a.s.l.) during 2001.
We limited our study for solar elevation angles greater than 10jin order to avoid the
deviations of the instrument from the ideal cosine law; in any case, the UVER irradiance values measured for larger zenith angles are relatively small.
3. Cloudless conditions model
At a specific site, the main factor causing variation of the UV irradiance is variation of solar elevation. The observed daily and yearly variations are dominated by this factor. Total ozone and clouds are of second-order importance for the variation. As our purpose was to characterize the cloud effect on UVER, the procedure followed in this study was designed in order to provide the better insight on cloud influence while minimizing the influence of the other factors. Thus, we developed an empirical model for UVER under cloudless conditions. This model, although locally dependent, allows the estimation of cloudless conditions UVER without the requirement of input variables that are not routinely measured. Thus, at a first step, we developed a particular model at each location. The variables considered for this model were the optical air mass, ma, total columnar content of ozone,lo, and the horizontal visibility, VIS, a variable measured in meteoro-logical networks, that can be considered as a surrogate for the aerosol load in the area. These local models were used to normalize UVER values measured under different cloud covers, providing an estimate of the modification in UVER irradiance due to a given cloud cover.
The atmospheric effect over UVER can be characterized byktuverdefined as the UVER irradiance normalized to its extraterrestrial value:
ktuver¼UVER=ðUVERoðr0=rÞ2sinaÞ ð1Þ
where UVERorepresents the extraterrestrial value of UVER, the term (r0/r)2accounts for the variation of the Sun – Earth distance along the year andarepresents the sun elevation angle.
We developed a clear-sky model for ktuver, ktuverc, that consists in an empirical expression developed over the data with cero octas cloud cover. After a detailed data analysis, the following expression was selected
ktuverc¼exp P1þP2loþP3 1 VISþ P4 P5þma ð2Þ
In this expressionPiare fitting coefficients,lois the total columnar content of ozone in Dobson unit (DU), VIS is the horizontal visibility in km andmais the optical air mass pressure corrected(Kasten, 1966).Table 1presents the set of values derived by fitting Eq. (2) to cloudless data sets recorded at each location for the years indicated. For Madrid and Murcia, where 2 years of data are available, we present the fitting coefficients obtained
using data registered during the year 2000, the use of the complete set of data provides rather similar coefficients, but proceeding in this way, we had the opportunity to use data registered during 2001 for validation purposes. The fitting coefficients obtained for Zaragoza and Madrid were rather similar and their differences are not significant, excluding the one associated to the visibility,P3, thus suggesting that the aerosol features at both locations produce different effects on UVER. For Murcia, we found marked differences in the ozone, P2, and visibility, P3, coefficients when compared with those obtained at Madrid and Zaragoza. The differences in the fitting coefficients are a result of the empirical fit and the local influences of each place not included in the input variables like the aerosol feature prevalent at each place.
The minus sing associated to the coefficients P1, P2 and P3 is coherent with the atmospheric attenuation of UVER. The combination of the terms depending onP1,P4and
P5in the exponential expression explains the dependence of the atmospheric transmission of UVER on sun elevation angle. In fact, as this angle increases, there is an increase of the positive term depending on P4and P5that implies a lower attenuation. In this table, we also present an indicator of the goodness of the fit in terms ofv2. In spite of the differences in the fitting coefficients, the empirical expressions obtained at the three places provided close estimates ofktuverc, specially at Murcia and Zaragoza, thus suggesting the possibility of using the same model at the three locations. Nevertheless, as our main interest is the analysis of the cloud effect on UVER, we will use the local model developed at each place in order to focus our analysis on cloud influence.
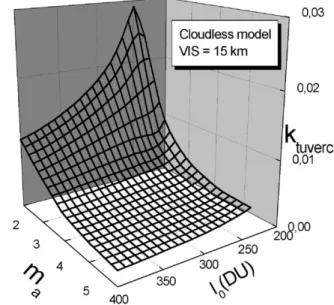
Fig. 1shows the cloudless model developed at Madrid for a given value of visibility,
15 km, it is evident that the term ktuverc which in fact represents the cloudless skies atmospheric transmission for the UVER increases with the reduction of lo, being this increase more marked for higher solar elevations, i.e. for lower values of optical air mass,
ma.
The performance of the models was evaluated using the root mean square deviation (RMSD) and the mean bias deviation (MBD). These statistics allow for the detection of both the differences between experimental data and model estimates and the existence of systematic over or underestimation tendencies, respectively. Linear regressions between estimated and measured values were also computed. The linear fitting was forced through zero, thus the slope, b, provided information about the relative underestimation or overestimation associated with the model. Finally, the determination coefficient,R2, gives an evaluation of the experimental data variance explained by the model.Table 2presents the results of these analyses, including the statistics previously described together with the number of cloudless data included in each data set and the cloudless average value for UVER, UVERavec. For Madrid and Murcia, we validated the models developed for data recorded during the year 2000 in these stations against data recorded during the year 2001.
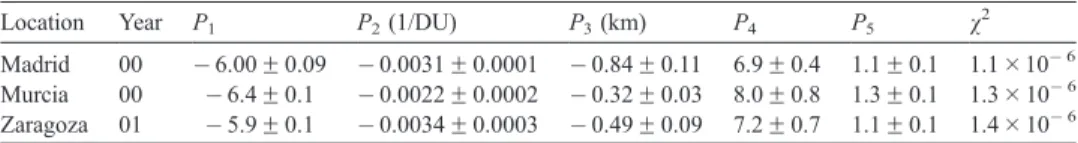
Table 1
Fitting coefficients for the cloudless model obtained at each one of the considered locations Location Year P1 P2(1/DU) P3(km) P4 P5 v2 Madrid 00 6.00F0.09 0.0031F0.0001 0.84F0.11 6.9F0.4 1.1F0.1 1.1106 Murcia 00 6.4F0.1 0.0022F0.0002 0.32F0.03 8.0F0.8 1.3F0.1 1.3106 Zaragoza 01 5.9F0.1 0.0034F0.0003 0.49F0.09 7.2F0.7 1.1F0.1 1.4106
For Zaragoza, the same data used for model development were used for this validation procedure.
It is evident that the local models provide estimates at the different places with MBD that are smaller than the expected experimental errors while RMSD values slightly exceed the experimental errors, with worst results for Murcia. These results dictate the confidence on these cloudless models that we will use in the following section as normalization factor in order to isolate the clouds influence over UVER at each one of the considered locations. It is interesting to note that the RMSD and MBD values obtained with these simple models were of the same order that than obtained in other studies of UVER or UVB. Thus,
Josefsson and Landelius (2000)developed a cloudless empirical that provided estimates of UVER with an RMSD of about 8.7%. On the other hand,Dvorkin and Steinberger (1999)
developed a model based on the parametric model proposed byIqbal (1983)that provided estimates of UVB with an MBD of about 6%.
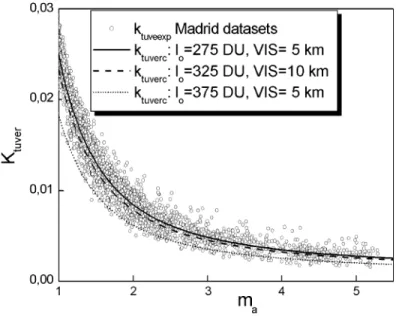
Fig. 2shows the plot ofktuvercvalues recorded at Madrid under cloudless conditions versus the optical air mass. It is evident that an increase in optical air mass provides for a
Table 2
Performance of the cloudless local models at the different places where they were developed Data set UVERavec
(mW m2) N b R2 MBD (%) RMSD (%) Madrid 92 1350 0.963F0.002 0.99 3.0 10.0 Murcia 106 982 0.999F0.004 0.95 1.9 14.8 Zaragoza 94 532 1.001F0.003 0.99 0.2 8.4
At Madrid and Murcia, models developed using the 2000 subset were validated against the 2001 subset, for Zaragoza, the same data were used for model development and validation.
rapid increase in direct radiation path length and associated attenuation by atmospheric constituents. The cloudless model developed at Madrid parameterized in terms of pairs of VIS andlovalues is also represented in this figure, the spread of the data is thus explained as a result of the variability in factors like VIS andlo.
4. Cloud modification factor
In order to define the cloud modification factor, UVER irradiance values were normalized by the corresponding clear-sky value, UVERc, which is retrieved by the cloudless empirical models presented in the previous section
UVERc¼ktuvercðUVERoðr0=rÞ2sinaÞ ð3Þ
This normalized value
sc¼UVER=UVERc ð4Þ
can be considered as an evaluation of the cloud effect. In fact, the ratio between the measured irradiance, in a given spectral interval, and the assumed corresponding clear-sky irradiance is usually referred to as a cloud effect not as transmittance, due to additional effects of the cloud layer in the radiation flux, like the multiple reflections between ground and cloud base or cloud top and atmosphere. The presence of multiple cloud layers complicates this process. Under broken cloud field, this interactions can be established
Fig. 2. Cloudy skiesktuvervalues versus optical air mass for the Madrid 2000 and Murcia 2000 data sets. It has been also included the developed cloudless sky model for given values of visibility, VIS, and total ozone content,lo.
between the sides of the clouds. In this section, we analyse the performance of this cloud modification factor,sc, in terms of its dependence on different atmospheric variables.
4.1. Cloud modification factor dependence with cloud amount
Previous studies utilising empirical cloud relationships approached the study of the cloud effect as a direct function of cloud cover(Ilyas, 1987; Lubin and Frederick, 1991; Bais et al., 1993; Blumthaler et al., 1996; Schafer et al., 1996; Thiel et al., 1997; Nemeth et al., 1996; Kuchinke and Nunez, 1999)or as a function of the cloud effect on other spectral ranges of solar irradiance(Foyo-Moreno et al., 2001). Other studies(Sabburg and Wong,
2000)used additional information on the cloud field obtained by sky cameras.
For each cloud cover amount, the mean and standard deviation around the mean of the cloud transmission factor were computed.Fig. 3shows the behaviour of this cloud factor as a function of cloud cover at each one of the analysed stations. The dependence of the cloud factor with cloud cover was similar at the three locations. The dependence of the mean value of the cloud modification factor with total cover amount evidences the higher efficiency of overcast skies to reduce effectively the ultraviolet radiation. The size of the bar, representing the standard deviation of the mean, indicates the spread of this cloud factor for a given fractional amount. This scatter is partly associated to the variety of clouds included under each one of the cloud amount categories considered. Factors like the position of the clouds with respect to the sun, which we do not take into account, can be also responsible of this scatter. The dependence of the cloud modification factor deviates
Fig. 3. Cloud modification factor versus total cloud cover. For each data set, the symbol indicates the average value while the bar denotes the standard deviation of the mean. The lines represent the model proposed in this study and the total solar radiation cloud modification functions proposed byKasten and Czeplak (1980), K&C, andJosefsson and Landelius (2000), J&L.
from the simpler linear function, and thus, we tried to fit this dependency through a potential function. In this figure, we also included the fitting function obtained with the data set registered at Madrid. This function has been designed in order to provide a cloud factor unity for cloudless conditions, and has the following expression
sc¼1Aðct=8ÞB ð5Þ
wherectis the cloud amount in octas.Table 3includes the different coefficients obtained at each location by fitting the whole data set of cloud modification factors obtained for each cloud cover category. It is interesting to note that Thiel et al. (1997), using data registered at Germany, used this kind of modelling but with a fix exponentB= 3, while the proposed value forAis 0.72, when there is no distinction on cloud type.
As in the case of the cloudless condition model, the coefficients obtained at Madrid and Zaragoza were similar, especially in the case of the exponent,B. Considering that these models are based only on total cloud cover, the differences encountered could be the result of different cloud regimes at the different locations. In this sense, Fig. 4 presents the histograms of cloud cover type for each one of the cloud covers considered at the three locations considered in this study. We can appreciate the differences in the predominance of the different cloud amount categories, but more important could be the differences in the predominant cloud types at each place. This informs us about the limitation of these kinds of empirical models. Considering this, it could be worthy to analyse the influence on the cloud modification factor of different cloud types. In this way, it could be possible to obtain a model less biased to the particular cloud regime of the location where it was developed.
For low cloud coverage fraction, less than four octas, the effect of clouds is negligible, thus suggesting that for these cloud covers, clouds tend to be located out of the line between sun and sensor. For completely covered conditions, the transmission of UVER is about 40% of that associated for cloudless conditions. This transmission is larger than that obtained by
Thiel et al. (1997). The value obtained for the exponent B reveals that the efficacy of the partially covered skies to reduce the ultraviolet radiation does not increase linearly with the cloud fractional amount. Similar nonlinear relations between the cloud radiative effect and the cloud coverage were used by other authors for the whole solar spectrum(Kasten and Czeplak, 1980; Davies, 1995; Josefsson and Landelius, 2000), for photosynthetically active radiation(Alados et al., 2000), for the thermal infrared emission of the atmosphere (Alados-Arboledas et al., 1995), for UVER irradiance(Thiel et al., 1997; Kuchinke and Nunez, 1999)
and for UV (290 – 385 nm)(Foyo-Moreno et al., 2003). It is interesting to note that the magnitude of the cloud effect over different spectral intervals has been analysed by different authors obtaining rather different results. Thus, Frederich et al. (1993)obtained similar
Table 3
Fitting coefficients for the cloud modification factor at each location
A B v2
Madrid 00/01 0.60F0.01 4.1F0.1 0.04
Murcia 00/01 0.51F0.07 2.8F0.6 0.07
effects on UV irradiance and total solar irradiance in a study performed over 2 years of data measured at Chicago.Foyo-Moreno et al. (2001)evidenced that clouds affect more markedly the total solar spectral range than the UV spectral range in their analysis of data registered at two radiometric stations in Southeastern Spain during a 2-year period. These results are similar to that obtained byBordewijk et al. (1995)in Netherlands.Estupin˜an et al. (1996)
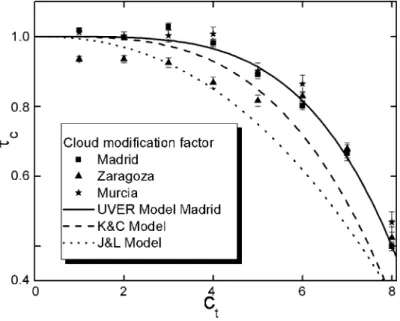
evidenced that on average, clouds attenuate the total solar spectrum about 24% more than the UVB range.Kylling et al. (1997)demonstrated that the UV irradiance is not affected by clouds in the same way the total solar global irradiance did. Some authors(Matthijsen et al., 2000)argued that if the relative difference of the cloud effect on UVand total solar irradiance could be established, it could be used to take advantage of the extensive information available for total global solar irradiance.Kasten and Czeplak (1980)and Josefsson and Landelius (2000)used Eq. (5) to model the cloud factor for the total solar radiation; the coefficients they obtain are different than those obtained in this study for UVER (Kasten and Czeplak, 1980(A= 0.75;B= 3.4);Josefsson and Landelius, 2000(A= 0.74,B= 2.3)).Fig. 3
shows the differences among these models and the one obtained for UVER at Madrid. It is evident that there are marked differences for cloud covers over three octas. These differences suggest a more marked influence of cloud on the total solar radiation, thus for overcast conditions, the cloud effect over total solar radiation is 33% higher than over UVER.
The estimation capability of the combination of cloudless models and cloud modifi-cation factor depending on total cloud amount was analysed using the complete data set at
each location, thus including all sky conditions. The performance of these estimation models was evaluated using the same statistical method used for the evaluation of the cloudless model. Table 4 presents the results of these analyses, including the statistics previously described together with the number of data included in each data set and the average value for UVER, UVERave. At each place, the estimation model used includes the locally fitted cloudless model and the locally fitted cloud modification factor.
It is evident that these combined models when used at the location where they were developed provide estimates with MBD lower than the expected experimental errors. On the other hand, the magnitude of the RMSD is greater than the experimental error at the three locations. The magnitude of RMSD can be partially explained by considering the temporal features of the data. Thus, it is interesting to note that the irradiance data correspond to half hourly data while the cloud observation corresponds to ‘‘punctual’’ observations performed at a given time. Thus, we are trying to analyse half hourly values and more or less instantaneous observations. In this sense, part of the observed scatter could be attributed to this factor. Nevertheless, the typical time scale of clouds is larger than half hour. In this sense, changes in the relative position of sun and clouds, not registered, could be more important together with variation of the cloud optical thickness for a specific cloud type or amount. In the next sections, we present the results of the analysis performed in order to detect the dependence of the cloud modification factor on solar elevation angle and cloud type.
Considering the differences in the cloud modification factors detected in Fig. 3, we considered the convenience of testing the use of a combined model based on the locally fitted cloudless model and a unique cloud modification model for the three locations. Test for each one of the cloud modification factor models obtained at the different locations has been performed obtaining similar results. For this reason,Table 5presents only the results
Table 5
Results of the analysis of the estimation of UVER under all sky conditions by the combination of cloudless model and cloud modification factor depending on total cloud amount
Data set UVERave (MW m2) N b R2 MBD (%) RMSD (%) Madrid 00/01 76 6076 0.961F0.002 0.96 2.2 17.6 Murcia 00/01 89 4345 1.001F0.002 0.95 2.1 16.4 Zaragoza 2001 80 1507 0.990F0.003 0.95 0.3 16.4
At each location, we use the locally fitted cloudless model and the cloud modification function obtained at Madrid.
Table 4
Results of the analysis of the estimation of UVER under all sky conditions by the combination of cloudless model and cloud modification factor depending on total cloud amount
Data set UVERave (mW m2) N b R2 MBD (%) RMSD (%) Madrid 00/01 76 6076 0.961F0.002 0.96 2.2 17.6 Murcia 00/01 89 4345 0.995F0.002 0.95 1.6 16.6 Zaragoza 2001 80 1507 0.994F0.003 0.97 0.4 16.5
obtained using at each location, the combination of the locally fitted cloudless model and the cloud modification function developed for Madrid that provided the best results. As can be seen, the results are similar to those presented inTable 4. This means that for this kind of models, a unique cloud modification function can be formulated.
4.2. Cloud modification factor dependence with solar elevation
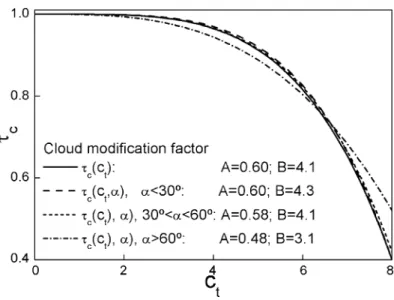
Authors likeKuchinke and Nunez (1999)considered the influence of solar elevation on the magnitude of the cloud effect. In order to provide some insight in this point, we split the Madrid data set in several sun elevation categories. The reduced number of categories used has been dictated by the limited number of cloud observations per day. Three categories have been considered characterized by sun elevation angles,a, between 10jand
30j,abetween 31jand 60jandagreater than 61j.Fig. 5shows the performance of the
models obtained by fitting the various subsets to Eq. (5) for Madrid. For the categories with solar elevation angles lower than 60j, the results were similar as can be seen from the
curves inFig. 5. In fact, the differences in the coefficientsAandBof Eq. (5) obtained for these two categories with sun elevation angle below 60jare respectively lower than 4%
and 10%. The curves for these two categories are close to that obtained for the whole data set. For the category with sun elevation greater than 60j, the behaviour is rather different.
Thus, the cloud attenuation for partial cloud covers at these solar elevation angles is greater than that encountered for lower solar elevations, while the attenuation for overcast conditions is 20% smaller than that obtained for lower solar elevation angles.
Joseffson and Landelius (2000), using data registered at Norrko¨ping (58.58jN, 16.15jE),
detected that there was no dependence of the cloud modification factor with solar elevation for angles greater than 10j, although their study was limited to solar elevation angles below
Fig. 5. Comparison among the different cloud modification factors obtained for all the solar elevation angles and for the three solar elevation categories considered in the present study.
50j.Kuchinke and Nunez (1999), using data registered at Go¨teborg (56.69jN, 11.92jE) and
Nordkoster (58.83jN, 10.72jE), obtained that cloud attenuation is stronger for data
corresponding to solar elevation angles smaller than 30j, implying a marked reduction in
forward scattering at these angles. On the contrary,Schafer et al. (1996), analysing data obtained by a Brewer MKIV Spectrophotometer and a video camera, to obtain cloud cover information, at Black Mountain (North Carolina, 35.66jN, 82.38jW, 951 m a.s.l), showed,
in accordance with the findings in the present study, that under partial cloud cover, there is a gradual increase in relative transmission for decreasing sun elevation angles. On the other hand, these authors (Schafer et al., 1996) obtained that for completely cloud-covered conditions, there was little dependence of the cloud factor on solar position. These authors justify the differences on the solar elevation angle dependency of the cloud effect in terms of the influence of ground-sky reflections. In this sense, the enhancement of UVER at surface due to reflection-enhancement under partial cloud cover may be higher for lower solar elevations when geometric conditions are most favourable for the reflection of UVB radiation from cloud edges or between cloud base and the ground. In our case, for overcast conditions, we obtain stronger attenuation for lower sun elevation angles, under these circumstances, it is not possible that the sun shines directly through a break in the cloud cover and reflection-enhancement is not possible. Thus, the effect of the greater sun path across the atmosphere is responsible of a reduction in forward scattering of UVER that, for these lower solar elevations, presents a predominance of the diffuse component(Blumthaler et al., 1994).
Nevertheless, the use of this model depending on sun elevation in combination with the cloudless skies model provides results similar to those obtained with the cloud modifi-cation model based only on total cloud amount developed in the previous section as can be seen inTable 6. This could be explained as a result of the similarity of the curves for solar elevation categories below 60jwith that for the whole data sets and the fact that cases with
solar elevation angle above 60jrepresent only about 10% of the whole database. 4.3. Cloud modification factor dependence with cloud type
Considering the different radiative effects associated to different cloud types, it seems convenient to define cloud modification factor for the different cloud types. The overall cloud modification factor will be the combination of the cloud modification factor due to the different clouds present. Obviously, the contribution of a given cloud layer must
Table 6
Results of the analysis of the estimation of UVER under all sky conditions by the combination of locally fitted cloudless model and cloud modification factor model depending on total cloud amount and solar elevation angle developed at Madrid
Data set UVERave (MW m2) N b R2 MBD (%) RMSD (%) Madrid 00/01 76 6076 0.961F0.002 0.96 2.3 17.6 Murcia 00/01 89 4345 1.001F0.002 0.95 2.3 16.7 Zaragoza 2001 80 1507 0.990F0.003 0.96 0.2 16.3
depend also on its extension through the cloud amount term. In this work, we considered the following expression for the cloud modification factor:
sc¼j
n
i¼1si ð6Þ
wheresi represents the cloud modification factor associated to a given cloud layer. This factor is a function of the cloud amount,ci, associated to this layer. The different radiative effects associated to different cloud types are captured through the differences in these functions.
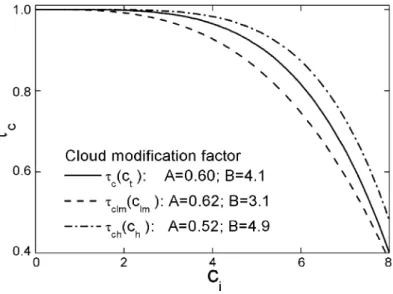
As a first step, we classified the experimental cases in each database, considering two categories. The first category includes those cases characterized by the presence of low and medium level clouds. This is the Low – Medium level clouds category. Additionally, we defined the High level cloud category. Fig. 6 shows the behaviour of the cloud modification factor for the two categories based on cloud type considered in this study, Low – Medium level clouds and High level clouds, as a function of the cloud amount. The fitting coefficients obtained for each one of the considered cloud type categories, included inFig. 6, reveals that Low – Medium level clouds are more effective in the attenuation of UVER irradiance than High level clouds. It is evident that coefficients A and B of the cloud modification function are statistically different, meaning that there are differences both in the magnitude of the radiative effect of the different cloud types and on the rate of the increase of this attenuation as cloud cover increases. In fact, for overcast conditions, lower clouds present an attenuation of ultraviolet erythemal irradiance 20% greater than that associated to high level clouds. These differences reduce markedly for partial cloud cover due to the differences in the coefficientB.
Fig. 6. Comparison among the different cloud modification factors obtained without distinction of cloud type and for the two cloud type categories considered in the present study.
These kinds of results were obtained byJosefsson and Landelius (2000), although they present their results in a graphical way without expression of the fitting coefficients obtained for Eq. (5).
According to the previous results, for more complex situations, we must consider a cloud modification factor that combines the effect of the different clouds present in the sky. Thus, the general expression for the cloud modification factor is:
sc¼sclmsch¼ ½10:62ðclm=8Þ3
:1
½10:52ðch=8Þ4:9 ð7Þ
whereclmand chrepresent the cloud amount in octas for Low – Medium and High level clouds, respectively.
The performance of this estimation model was evaluated using the same statistical used for the evaluation of the cloudless model. Table 7presents the results of these analyses, including the statistics previously described together with the number of data included in each data set and the average value for UVER, UVERave. At each location, the validation data set includes the cases used in the development of the cloud modification factor and additionally the cloudless sky cases and those cloudy conditions, which present more than one type of clouds.
Comparison ofTables 5 and 7suggests that there is not any substantial improvement of this model, depending on cloud amount and type, over the one depending only on total cloud cover. This could be a result of the greatest influence of Low and Medium level clouds that represent the greatest percentage in our database. MBD values are smaller than the experimental errors. On the other hand, adding complexity to the model implies an increase in the RMSD value.
5. Concluding remarks
After our analysis of the dependence of the cloud modification factor on the total cloud amount, it is evident that this dependence deviates from the simpler linear function and thus we tried to fit this dependency through a potential function. For low cloud coverage fraction, less than four octas, the effect of clouds is negligible. This fact suggests that for these cloud covers, clouds tend to be located out of the line between sun and sensor. On the other hand, it is shown that the cloud effect for UV wavelengths is less than for the whole solar spectrum. Thus, for overcast conditions, the cloud effect over total solar radiation is 33% higher than over UVER. After testing the use of a combined model based
Table 7
Results of the analysis of the estimation of UVER under all sky conditions by the combination of locally fitted cloudless model and cloud modification factor depending on total cloud amount and cloud type obtained at Madrid
Data set UVERave (MW m2) N b R2 MBD (%) RMSD (%) Madrid 00/01 76 6076 0.978F0.002 0.95 0.7 20.0 Murcia 00/01 89 4345 1.014F0.003 0.92 5.4 21.0 Zaragoza 2001 80 1507 1.012F0.005 0.94 3.8 20.7
on the locally fitted cloudless model and a common cloud modification model for the three locations analysed in this study, it seems evident that a single cloud modification function can be used for all of sites.
According to our study, the solar elevation angle influence on the cloud transmission factor is rather low for solar elevation smaller than 60j, especially for the completely
covered conditions (eight octas). Josefsson and Landelius (2000) encountered a similar result in their study. For the category with sun elevation greater than 60j, the behaviour is
rather different. Thus, the cloud attenuation for partial cloud covers at these solar elevation angles is greater than that encountered for lower solar elevations, while the attenuation for overcast conditions is 20% smaller than that obtained for lower solar elevation angles. These different behaviours can be explained in terms of the reflection-enhancement under partial cloud cover conditions, an effect that is absent under overcast conditions. On the other hand, the limited frequency of cloud cover used in this study, together with the predominance of lower solar elevation in the data set, can be responsible of the limited improvement of the sun elevation-dependent model in the estimation of UVER over the model that not considers this dependence.
Using only total cloud amount as parameter to model the cloud effect on UV irradiance will give substantial uncertainty that may be decreased using cloud type information. After our study, it is evident that low and medium level clouds present lower transmission than high level clouds. Thus, a cloud modification function depending on cloud type has been developed. Due to the predominance of the Low – Middle level clouds in our database, the use of this modification factor in the estimation of the UVER irradiance in combination with a cloudless sky model do not provide better results than that obtained with a cloud modification function based on total cloud amount.
We consider that study developed over a period of 2 years at two of the selected places provides appropriate variability in the cloud conditions together with statistical validity, although the limited frequency of cloud cover used in this study represents a limitation to study some aspects like the use of estimation models that includes sun elevation and cloud type dependence. In this sense, a study under development includes the use of a sky camera side by side with the UVB instrumentation in order to register the sky conditions with higher frequency. This system could offer additional information on the cloud field as has been shown bySabburg and Wong (2000).
Acknowledgements
This work was supported by La Direccio´n General de Ciencia y Tecnologı´a from the Education and Research Spanish Ministry through the project RNM2000-C08-05. The Instituto Nacional de Meteorologı´a kindly provided the radiometric, columnar ozone and meteorological information for the three stations used in this study.
References
Alados, I., Olmo, F.J., Foyo-Moreno, I., Alados-Arboledas, L., 2000. Estimation of photosynthetically active radiation under cloudy conditions. Agric. For. Meteorol. 102, 39 – 50.
Alados-Arboledas, L., Vida, J., Olmo, F.J., 1995. The estimation of thermal atmospheric radiation under cloudy conditions. Int. J. Climatol. 15, 107 – 116.
Bais, A.F., Zerefos, C.S., Meleri, C., Ziomas, I.C., Tourpali, K., 1993. Spectral measurements of solar UV-B radiation and its relations to total ozone, SO2and clouds. J. Geophys. Res. 98, 5199 – 5204.
Blumthaler, M., Ambach, W., Salzgeber, M., 1994. Effects of cloudiness on global and diffuse UV irradiance in a high-mountain area. Theor. Appl. Climatol. 50, 68 – 74.
Blumthaler, M., Ambach, W., Cede, A., Staehelin, J., 1996. Attenuation of erythemal effective irradiance by cloudiness at low and high altitude in the alpine region. Photochem. Photobiol. 63, 193 – 196.
Bordewijk, J.A., Slaper, H., Reinen, A.J.M., Schlamann, E., 1995. Total solar radiation and the influence of clouds and aerosols on the biologically effective UV. Geophys. Res. Lett. 22, 2151 – 2154.
Davies, J.A., 1995. Comparison of modelled of observed global irradiance. J. Appl. Meteorol. 35, 192 – 201. Dı´az, J.P., Expo´sito, F.J., Torres, C.J., Herrera, F., Propero, J.M., Romero, M.C., 2001. Radiative properties of
aerosols in Saharan dust outbreaks using ground-based and satellite data: applications to radiative forcing. J. Geophys. Res.-Atmos. 106, 18403 – 18416.
Diffey, B.L., 1982. The consistency of studies of ultraviolet erythema in normal human skin. Phys. Med. Biol. 27, 715 – 720.
Diffey, B.L., 1991. Solar ultraviolet effects on biological systems. Phys. Med. Biol. 36, 299 – 328.
Dvorkin, A.Y., Steinberger, E.H., 1999. Modelling the altitude effect on solar UV radiation. Sol. Energy 65, 181 – 187.
Estupin˜an, J.G., Raman, A., Crescenti, J., Streicher, J., Barnard, W., 1996. The effects of clouds and haze on UV-B radiation. J. Geophys. Res.-Atmos. 101, 16807 – 16816.
Foyo-Moreno, I., Vida, J., Alados-Arboledas, L., 1998. Ground based ultraviolet (290 – 385 nm) and broadband solar radiation measurements in south-eastern Spain. Int. J. Climatol. 18, 1389 – 1400.
Foyo-Moreno, I., Alados, I., Olmo, F.J., Vida, J., Alados-Arboledas, L., 2001. On the use of a cloud modification factor for solar UV (290 – 385 nm) spectral range. Theor. Appl. Climatol. 68, 41 – 50.
Foyo-Moreno, I., Vida, J., Alados, I., Olmo, F.J., Alados-Arboledas, L., 2003. The influence of cloudiness on UV global irradiance (290 – 385 nm). Agric. For. Meteorol. (In revision).
Frederick, J.E., Snell, H.E., 1990. Tropospheric influence on solar ultraviolet radiation: the role of clouds. J. Clim. 3, 373 – 381.
Frederich, J.E., Koob, A.E., Alberts, A.D., Weatherhead, E.C., 1993. Empirical studies of Tropospheric trans-mission the ultraviolet: broadband measurements. J. Appl. Meteorol. 32, 1883 – 1892.
Grant, R.H., 1997. Biologically active radiation in the plant canopy environment. Int. J. Biometeor. 40, 26 – 40. Grant, R.H., Heisler, G.M., 2000. Estimation of ultraviolet-B irradiance under variable cloud conditions. J. Appl.
Meteorol. 39, 904 – 916.
Ilyas, M., 1987. Effects of cloudiness on solar ultraviolet radiation reaching the surface. Atmos. Environ. 21, 1483 – 1484.
Iqbal, M., 1983. An Introduction to Solar Radiation. Academic Press, Toronto.
Josefsson, W., Landelius, T., 2000. Effect of clouds on UV irradiance: as estimated from cloud amount, cloud type, precipitation, global radiation and sunshine duration. J. Geophys. Res. 105, 4927 – 4935.
Kasten, F., 1966. A new table and approximate formula for relative optical air mass. Arch. Meteorol. Geophys. Bioklimatol., B 14, 206 – 223.
Kasten, F., Czeplak, G., 1980. Solar and terrestrial radiation dependent on the amount and type of cloud. Sol. Energy 24, 177 – 189.
Kuchinke, C., Nunez, M., 1999. Cloud transmission estimates of UV-B erythemal irradiance. Theor. Appl. Climatol. 63, 149 – 161.
Kylling, A., Albold, A., Seckmeyer, G., 1997. Transmittance of a cloud is wavelength-dependent in UV-range: physical interpretation. Geophys. Res. Lett. 24, 397 – 400.
Leszczynski, K., Jokela, K., Ylianttila, L., Visuri, R., Blumthaler, M., 1998. Erythemally weighted radio-meters in solar UV monitoring: results from the WMO/STUK intercomparison. Photochem. Photobiol. 67, 212 – 221.
Lorente, J., Redan˜o, A., De Cabo, X., 1996. Influence of urban aerosol on spectral solar irradiance. J. Appl. Meteorol. 33, 406 – 415.
Martinez-Lozano, J.A., Marı´n, M.J., Tena, F., Utrilla, M.P., Sa´nchez-Munlosguren, L., Gonzalez-Frı´a, C., Cueves, E., Redondas, A., Lorente, J., de Cabo, J., Chamorro, V., Vergez, R., de Frutos, A., Dı´az, J.P., Expo´sito, F.J., de la Morena, B., Vilaplana, J.M., 2002. UV index experimental values during the years 2002 and 2001 from the Spanish broadband UV-B radiometric network. Photochem. Photobiol. 76, 181 – 187. Matthijsen, J., Slaper, H., Reinen, H.A.J.M., 2000. Reduction of solar UV by clouds: a comparison between satellite-derived cloud effects and ground based radiation measurements. J. Geophys. Res. 105, 5069 – 5080. McKinlay, A.F., Diffey, L., 1987. A reference spectrum for ultraviolet induced erythema in human skin. CIE-J. 6,
17 – 22.
Nemeth, P., Toth, Z., Nagy, Z., 1996. Effect of weather conditions on UV-B radiation reaching the earth’s surface. Photochem. Photobiol. 32, 177 – 181.
Pearson, A.J., Dean, S.F., Clark, I.E., Campbell, J.I., Grainger, K.J., Driscoll, C.M.H., 2000. NRPB solar ultra-violet radiation measurement network. Radiat. Prot. Dosim. 91, 169 – 172.
Sabburg, J., Wong, J., 2000. Evaluation of a sky/cloud formula for estimating UV-B irradiance under cloudy conditions. J. Geophys. Res. 105, 29.685 – 29.691.
Schafer, J.S., Saxena, V.K., Wenny, B.N., Barnard, W., De Luisi, J.J., 1996. Observed influence of clouds on ultraviolet-B radiation. Geophys. Res. Lett. 23, 2625 – 2628.
Seckmeyer, G., Erb, R., Albold, A., 1996. Transmittance of a cloud is wavelength-dependent in the UV-range. J. Geophys. Res. 23, 2753 – 2755.
Thiel, S., Steiner, K., Seidltz, H.K., 1997. Modification of global erythemally effective irradiance by clouds. Photochem. Photobiol. 65, 969 – 973.
Van der Leun, J.C., Tevini, M., Worrest, R.C. (Eds.), 1991. Environmental Effects of Ozone Depletion: 1991 Update. United Nations Environmental Programme, Nairobi.
Van der Leun, J.C., Tevini, M., Worrest, R.C. (Eds.), 1994. Environmental Effects of Ozone Depletion: 1994 Update. United Nations Environmental Programme, Nairobi.
Van der Leun, J.C., Tevini, M., Worrest, R.C. (Eds.), 1998. Environmental Effects of Ozone Depletion: 1998 Update. United Nations Environmental Programme, Nairobi.
World Meteorological Organization, 1998. Scientific Assessment of Ozone Depletion: 1998. Global Ozone Research and Monitoring Project. Rep. No. 44.