Dissertation
submitted to the
Combined Faculties of the Natural Sciences and for Mathematics
of the Ruperto-Carola University of Heidelberg, Germany
for the degree of
Doctor of Natural Sciences
Put forward by
Charles Ludwig Majer
born in Freiburg
Joint reconstruction of the mass distributions of galaxy
clusters from gravitational lensing and thermal gas
Referees:
Prof. Dr. Matthias Bartelmann
Prof. Dr. Joachim Wambsganß
“But the real way to get happiness is by giving out happiness to other people.” – Robert Baden-Powell
Kombinierte Rekonstruktion der Massenverteilungen von Galaxienhaufen mittels Gravitationslinseneffekt und thermischem Gas
Massereiche Galaxienhaufen sind die gr¨oßten gravitativ gebundenen Objekte im Universum. Ihre Mas-se kann mittels des GravitationslinMas-seneffekts bestimmt werden. Um verl¨assliche Aussagen treffen zu k¨onnen, ist es besonders wichtig, die dabei auftretenden Unsicherheiten zu quantifizieren, dies ist aber numerisch sehr aufwendig. Wir erarbeiten eine neue Methode, diese Unsicherheiten analytisch zu bestimmen, wobei wir uns auf Massenrekonstruktionen beschr¨anken, die auf dem schwachen Lin-seneffekt beruhen.
Galaxienhaufen enthalten eine große Menge an intergalaktischer Materie, was zu einer Vielzahl von weiteren Beobachtungsgr¨oßen f¨uhrt. Die von uns entwickelte Methode kann aus zweien dieser Observablen das Linsenpotential des Haufens bestimmen: Hierzu nutzen wir Signale des thermischen Sunyaev-Zel’dovich-Effekts und die Emission von R¨ontgenstrahlung in Folge von thermischer Brems-strahlung. Unter der Annahme, dass sich das Gas im hydrostatischem Gleichgewicht befindet und einer polytropischen Zustandsgleichung folgt, verkn¨upfen wir diese Observablen mit dem Gravitationspo-tential. Hierbei ist eine Deprojektion vonn¨oten, welche wir mittels der Richardson-Lucy-Methode durchf¨uhren. Das gesuchte Linsenpotential ergibt sich dann durch eine Projektion des Gravitationspo-tentials entlang der Sichtlinie. Den Erfolg unserer Methode testen wir an Galaxienhaufen mit vorge-gebenem Dichteprofil, einer numerischen N-Teilchen-Simulation und dem Galaxienhaufen RXJ1347. Unsere Bem¨uhungen sind als die ersten Schritte in Richtung eines nicht-parametrischen Algo-rithmus zu verstehen, bei welchem wir alle zur Verf¨ugung stehenden Observablen f¨ur eine gemein-same Rekonstruktion der Massenverteilung nutzen wollen. Durch das Einbeziehen mehrerer unter-schiedlicher Beobachtungsgr¨oßen, vereint in einem gemeinsam rekonstruierten Linsenpotential, ist es m¨oglich, die Massen von Galaxienhaufen sowie deren interne Struktur deutlich pr¨aziser zu bestimmen.
Joint reconstruction of the mass distributions of galaxy clusters from gravitational lensing and thermal gas
We focus on the reconstruction of mass distributions of the massive galaxy clusters, which are the largest gravitationally bound objects in the Universe. An approach to determine the masses of clusters is based on the effects of gravitational lensing. Estimating errors induced by this method is crucial but computationally expensive. We present a novel approach to estimate analytically the errors made by reconstructions which use weak-lensing information.
As galaxy clusters host a large amount of intracluster medium they provide a multitude of observ-ables. We present a new method to infer the lensing potential from two of these: signals of the thermal Sunyaev-Zel’dovich effect and the emission of X-rays due to thermal bremsstrahlung. By assuming that the gas is in hydrostatic equilibrium and follows a polytropic equation of state, we link these observables to the gravitational potential, which is then projected along the line-of-sight to infer the lensing potential. For this we deproject the observables by means of the Richardson-Lucy algorithm. We test our method on clusters with analytic profiles, a numerical simulation and on the galaxy cluster RXJ1347.
Our efforts are the first steps towards a non-parametric algorithm for a joint cluster reconstruction. By taking all possible cluster observables into account, mass distributions of clusters will be deter-mined more accurately.
Contents
Table of Contents ix
List of Figures xi
List of Tables xii
1 Introduction 1
2 Cosmology 5
2.1 Cosmological principle . . . 5
2.2 Friedmann-Lemaˆıtre-Robertson-Walker models . . . 6
2.3 Cosmological redshift . . . 7
2.4 Hubble function and density parameters . . . 8
2.5 Distance measures . . . 10
2.6 Structure formation . . . 12
2.7 Mass function . . . 16
3 Galaxy clusters 19 3.1 Cluster structure . . . 19
3.2 Observing galaxy clusters . . . 21
4 Reconstruction of the mass distribution using gravitational lensing 33 4.1 A strong- and weak-lensing reconstruction code . . . 33
4.2 Approaching an analytic error estimation . . . 38
4.3 Application to mock data . . . 41
4.4 Application to an N-body/hydrodynamica cluster simulation . . . 43
4.5 Summary and conclusion . . . 46
5 Richardson-Lucy deprojection 49 5.1 Merits and limits of deprojections . . . 49
5.2 Principles of the Richardson-Lucy deprojection . . . 50
5.3 Richardson-Lucy deprojection and spherical symmetry . . . 52
5.4 Richardson-Lucy deprojection and spheroidal symmetry . . . 53
5.5 Constraining the two degrees of freedomαandL . . . 55
5.6 Richardson-Lucy method compared to onion peeling . . . 56
5.7 Testing the influence of the free parametersαandL. . . 58
5.8 Summary and conclusion . . . 60
6 Reconstruction of the mass distribution of clusters using the thermal Sunyaev-Zel’dovich effect 61 6.1 Simulation of ALMA observations . . . 61
6.2 Application to mock data with spherical symmetry . . . 63
6.3 Application to a simulation assuming spherical symmetry . . . 65
6.5 Summary and conclusion . . . 68
7 Reconstruction of the mass distribution of clusters using X-ray emission 71 7.1 Simulation of Chandra observations . . . 71
7.2 Application to mock data with spherical symmetry . . . 73
7.3 Application to a simulation assuming spheroidal symmetry . . . 74
7.4 Summary and conclusion . . . 76
8 Application to RXJ1347-1145 77 8.1 RXJ1347 . . . 77
8.2 Reconstruction assuming spherical symmetry . . . 78
8.3 Reconstruction assuming spheroidal symmetry . . . 79
8.4 Summary and conclusion . . . 82
9 Conclusion and outlook 83
Bibliography 87
List of Figures
2.1 Illustration of different curvature. . . 6
2.2 Density parameters. . . 10
2.3 Different distance measures. . . 11
3.1 Images of strong-lensing clusters. . . 20
3.2 NWF density profile. . . 21
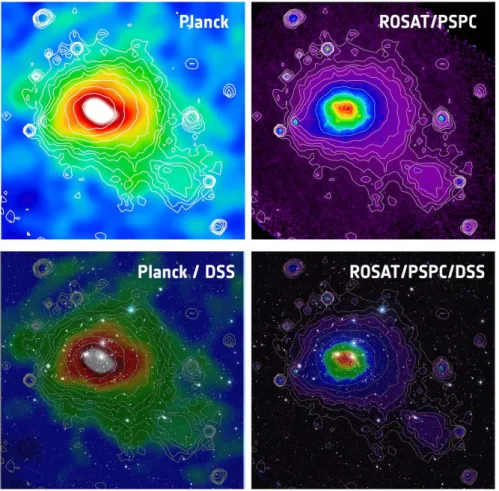
3.3 Observations of clusters with different methods. . . 22
3.4 Lensing geometry. . . 23
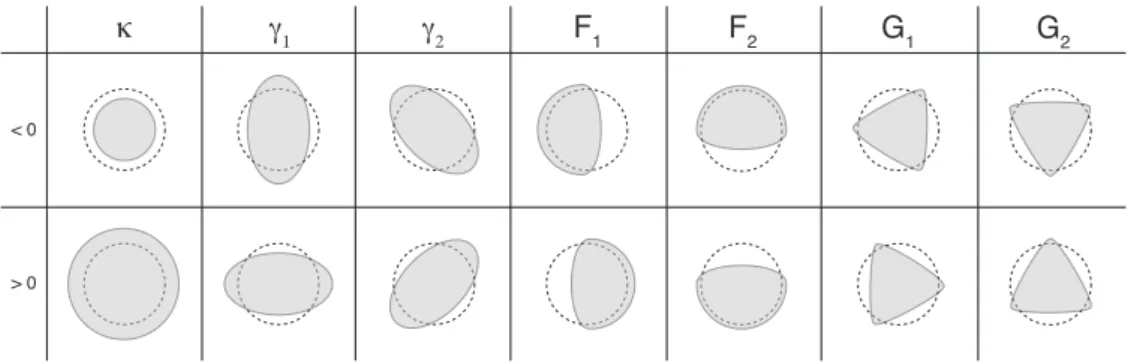
3.5 Distortion caused by convergence, shear and flexion. . . 25
3.6 Frequency change due to the thermal SZ effect. . . 26
3.7 Images of the Coma cluster. . . 28
3.8 Spectrum of thermal bremsstrahlung. . . 30
4.1 Galaxy averaging ofSaWLens. . . 35
4.2 Geometry of ellipticity averaging. . . 38
4.3 Convergence and standard deviation for different regularisation parameters. . . 42
4.4 Standard deviation for different regularisation parameters from the analytical model. 44 4.5 Convergence and standard deviation for the g1 cluster. . . 45
4.6 Azimuthal average of the convergence and the standard deviation for the g1 cluster. . 46
5.1 Radial profile and line-of-sight geometry of the spherical RL algorithm. . . 52
5.2 Spheroidal cluster geometry. . . 53
5.3 Surface brightness profile and reconstructed emissivity of A1689. . . 57
5.4 Reconstructed density and temperature profile of A1689. . . 58
5.5 Reconstructed lensing potential of A1689. . . 58
5.6 Scatter introduced byαandLmax. . . 59
5.7 Schematic overview of the used reconstruction method. . . 60
6.1 Specific intensity change for a mock simulation. . . 64
6.2 Reconstruction of the mock cluster using thermal SZ. . . 64
6.3 Relative rms of the reconstruction using thermal SZ data. . . 65
6.4 Compton-y parameter for the g1 cluster. . . 65
6.5 Reconstruction of the lensing potential and relative rms for the g1 cluster. . . 66
6.6 Specific intensity change for the g1 cluster. . . 67
6.7 Spheroidal reconstruction for the g1 cluster. . . 68
7.1 Surface brightness of a mock cluster. . . 72
7.2 Reconstruction of the mock cluster using X-ray emission. . . 73
7.3 The g1 cluster as seen with Chandra. . . 74
7.4 Spheroidal reconstruction for the g1 cluster. . . 75
8.1 Thermal SZ signal of RXJ1347-1145 at 140 GHz. . . 78
8.2 Spherical reconstruction of RXJ1347-1145. . . 79
8.3 Spheroidal reconstruction of RXJ1347-1145. . . 81
List of Tables
2.1 Density parameters, Hubble constant, andσ8. . . 9
1
Chapter 1Introduction
In recent years modern cosmology has become a major branch in physics. With a multitude of new available data sets and an ever increasing accuracy, cosmology evolved to a field of research illumi-nating the Universe as a whole with tight bounds on introduced cosmological parameters.
The successfulcosmological standard model, also known asΛCDM, explains the Universe with a minimal set of six parameters. According to this model the Universe emerged from a singularity with aBig Bang13.7 billion years ago. Shortly thereafter – considering cosmological time scales – matter and radiation decoupled. This is nowadays observed in theCosmic Microwave Background(CMB). It was released approximately 400,000 years after the Big Bang. The ΛCDM model postulates the existence of a cosmological constantΛ. It was introduced in the field equations by Einstein himself to account for the possibility of a static Universe. The standard model further postulates the existence of an unknown and not electromagnetically interacting – hencedark– matter component, so far only known to interact gravitationally (or maybe weakly) with ‘ordinary’ matter. It further states that structures in the Universe evolved hierarchically starting with tiny density fluctuations, imprinted in the CMB. Their amplitudes grew over time and due to non-linear structure formation they formed the cosmic weband the massive galaxy clusters imbedded there. The dark matter component accounts for 26.8% and the cosmological constant for 68.3% of the total energy density of the Universe, leaving us with 4.9% (seePlanck Collaboration,2013a) for the world we know – given by baryonic matter. To summarise: 95.1% of the energy density lie in thedarkand are not understood so far.
The Universe we observe today appears spatially flat. A spatially flat universe involves a high degree of fine-tuning, raising the so calledflatness problem. Another observational constraint is the CMB, which is almost perfectly isotropic – relative primary anisotropies are of the order 10−5. The
primordial density fluctuations imprinted in the CMB are correlated on large scales. These scales are larger than the horizon within which signals have been able to be in causal contact at the time of recombination. This issue is stated by the so-calledhorizon problem. Some form of early accelerated expansion – calledinflation– is capable to resolve both mentioned problems.
The latest objects formed, according to hierarchical structure formation, are galaxy clusters. The core structure of galaxy clusters provides important cosmological information. Based on numerical simulations, we expect the dark-matter distribution to follow a universal profile with characteristic gradients and a scale radius (Navarro et al., 1997). Outside relatively small central regions, cluster density profiles should not be strongly affected by baryonic physics because of the long cooling times in the intracluster plasma compared to the Hubble time. Cold dark matter is expected to clump on virtually arbitrarily small scales. The level of substructure in clusters thus potentially constrains the nature of the dark matter particles (Boylan-Kolchin et al.,2009;Gao et al.,2011). Further, the ratio between the scale and the virial radii of galaxy clusters, dubbed the concentration parameter, has been frequently observed to be substantially different than theoretically expected. In particular, in strongly gravitationally lensing clusters, concentration parameters that are significantly higher than those found in numerical simulations have been reported (e.g.Coe et al.,2012, Fig. 14), for exampleAbell 1689
INTRODUCTION
(Goldberg & Leonard,2007;Umetsu & Broadhurst,2008;Broadhurst et al.,2008). ForAbell 1689 a multitude of different observations are available. This cluster has been modelled to explain the observed strong and weak-lensing features favouring a low concentration parameter. X-ray analyses, however, draw a different picture of this massive cluster as they favour very high concentrations≈14 (Peng et al., 2009). These findings are claimed to be in some tension with the standard model of cosmology (Corless et al., 2009; Oguri et al., 2009) as at present they are only weakly consistent withΛCDM. However, this issue is maybe due to our present techniques to infer the concentration parameter of massive galaxy clusters.
Another problem, closely related to the concentration problem, is the arc-statistic problem (Bartel-mann et al.,1998), stating that massive galaxy clusters produce more arcs (i.e. strong-lensing features) than theory is able do predict. This problem remains largely unsolved up to date. Attempts have been made at explaining high concentrations and thus a high number of arcs by including trixiality of the clusters (e.g.Oguri et al.,2003), but the core of this problem still remains.
Numerous other problems are raised once high-resolution simulations of structure formation of cold dark matter are compared to observations. A prominent one is concerning the aforementioned density profile. Simulations predict a universal profile of dark matter halos which havecuspycores. Observations, however, favourflatcores in the central regions of clusters. This discrepancy is called thecore-cusp problem(e.g.de Blok,2010).
Even though many attempts have been made to explain the discrepancies, we are far from a con-sistent picture of structure formation. It is fundamental to find out whether these discrepancies reflect insufficient understanding at the level of our theory of cosmological structure formation, or whether it is a combination of baryonic physics, selection effects, and measurement biases that gives rise to these differences between theory and observations.
Considering the constraints they give on the cosmological standard model, the mysteries they hold and the multitude of observables they provide, galaxy clusters are clearly the class of objects to study. In the following discussion we will focus on the following observables: Weak and strong gravitational lensing effects enable a direct estimate of the scaled surface-mass density of a lensing mass distribu-tion. X-ray emission and the thermal Sunyaev-Zel’dovich (SZ) effect reflect the physical state of the hot intracluster gas. Assuming equilibrium and hydrostatic stability, the gas properties can also be related to the gravitational potential. This suggests to devise a method by which lensing, X-ray, and thermal SZ data can be combined in a joint analysis aiming at recovering the gravitational potential best compatible with all observables. We enter the stage of multi-wavelength reconstructions. There already exist several works on reconstructions based on multiple data sets (Reblinsky,2000a;Dor´e et al.,2001;Puchwein & Bartelmann,2006). However, these works use separate reconstructions for each observable rather than one consistent algorithm to reconstruct them all together. Recent applica-tions (e.g. De Filippis et al. 2005;Sereno 2007;Yuan et al. 2008;Nord et al. 2009;Basu et al. 2010) have shown how precious and valuable the information is one is capable to retrieve with multiple probes.
In this work we present a consistent method to infer the lensing potential from the thermal SZ effect and the X-ray emission. This marks, together with the findings from Sarli et al. (2013) on galaxy kinematics and the work ofMerten(2010) on gravitational lensing, the beginning of a multi-wavelength approach on the common ground of the line-of-sight projected gravitational potential – which is proportional to the lensing potential.
In two major parts we cover the three aforementioned observables – gravitational lensing, thermal SZ effect and X-ray emission – and explain our method to infer the lensing potential from them. The first part focusses on the errors made by using reconstructions of the mass distribution based on weak gravitational lensing and how these are estimated. The second part covers our approach to reconstruct the lensing potential from the thermal SZ effect and the X-ray emission of galaxy clusters.
The overall structure of this thesis is as follows: We start with a short review of modern cosmology in Chapter2 to familiarise the reader with those parts of cosmology which are needed in the
subse-INTRODUCTION quent chapters. We then concentrate the discussion in Chapter3on massive galaxy clusters and the different observables they provide. There we also discuss the fundamental relation between the used observables and the lensing potential. But before we apply our reconstruction method to data, we first explain the strong- and weak-lensing reconstruction codeSaWLensofMerten (2010) in Chap-ter 4. For the weak-lensing reconstruction ofSaWLens we derive an analytic error estimation and verify our results with a numerical experiment. We finish this first major part with an application to a hydrodynamical/N-body simulation of a massive galaxy cluster. Entering the second major part, we proceed to the details of our reconstruction algorithm in Chapter5. Here we describe the used depro-jection method. With it, we are capable to retrieve the line-of-sight projected cluster potential from the X-ray surface brightness and observations of the thermal SZ effect. By applying our deprojection method to the galaxy cluster Abell 1689, we compare our deprojection method to the conventionally usedonion peelingmethod. Numerical tests, described in Chapter6and7, illustrate how our recon-struction algorithm performs under realistic conditions. Although we adopt a spherically symmetric cluster potential for the tests, spherical symmetry is not a necessary condition for our algorithm to work. The influence of a possible deviation from spherical symmetry is exemplified in Section 6.3 with a data set from a hydrodynamical/N-body simulation. We further extend our algorithm towards spheroidal cluster geometries and apply it to a simulated cluster in Section6.4 for the thermal SZ effect. In the same manner we use X-ray emission in Section 7.3. Finally, we have a thermal SZ observation of the galaxy cluster RXJ1347-1145 fromSayers et al.(2013) to apply our reconstruction method to. The detailed results of this application are presented in Chapter8. We conclude and give an outlook in Chapter9.
Parts of this work were published in the following articles:
• Konrad, S.,Majer, C. L., Meyer, S., Sarli, E., & Bartelmann, M. (2013): Joint reconstruction of galaxy clusters from gravitational lensing and thermal gas I. Outline of a non-parametric method.A&A, 553, A118.
• Majer, C. L., Meyer, S., Konrad, S., Sarli, E., & Bartelmann, M. (2013):Joint reconstruction of galaxy clusters from gravitational lensing and thermal gas II. Inversion of the thermal Sunyaev-Zel’dovich effect.ArXiv e-prints: 1304.6522
• Tchernin, C.,Majer, C. L., Meyer, S., Sarli, E., Eckert, D., & Bartelmann, M. (2013): Recon-struction of the lensing potential of the cluster A1689 from X-ray measurements.Submitted
2
Chapter 2Cosmology
Cosmologyhas its linguistic origins in the greek language,kìos logÐa, meaningstudy of the worldand was more of philosophical nature. The Greek also marked the earliest form of cosmology, nowadays known ascelestial mechanics. More than 2300 years after that, cosmol-ogy has evolved to a fundamental branch in modern physics, amongst others describing the evolution of our Universe. Even though we are capable to observe the Universe ‘shortly’ after theBig Bang, we sometimes touch the realm of philosophy, just as our ancient ancestors.
In this chapter we want to present some parts of modern cosmology which the reader may be in need of to follow the line of thought throughout this thesis. Focussing only on the very fields of cosmology needed, this overview is certainly not complete. As we concentrate on the discussion of massive galaxy clusters and structure formation, it is not necessary to discuss the field of the early Universe. This includes the time ofrecombination,primordial nucleosynthe-sisas well asinflation. These special fields of cosmology, as well as the content presented, are covered in numerous text books, e.g.Weinberg(2008);Mukhanov(2008);Schneider(2006b), notes byBartelmann(2004) or the thesis ofAngrick(2011) andMerkel(2013).
2.1 Cosmological principle
We want to start this chapter with an axiom – thecosmological principle, which consist of two state-ments. The first implies that the Universe is isotropic. This is a bold assumption dating back to the beginnings of modern cosmology, though this principle is clearly violated on small scales as we ob-serve the night sky. But it is accepted if averaged over sufficiently large scales. On scales larger than 100 Mpc isotropy is observed by a multitude of surveys, e.g. of thecosmic microwave background (CMB) with theWilkinson Microwave Anisotropy Probesatellite (WMAP). The second assumption of the cosmological principle is theCopernican principle, saying that our position in the Universe is not preferred over others. Both the assumptions combined obviously lead to an Universe which has to behomogeneous.
Given this cosmological principle more questions about our Universe are raised. The most promi-nent and crucial question for modern cosmology is how anisotropies, like the Milky Way, evolved whereas the Universe remains homogeneous on large scales.
Observations of the CMB are heavily supporting the assumption of homogeneity. The CMB itself originates from the time when the temperature of the cosmic plasma dropped below ∼ 3000 K and photons decoupled from protons and electrons. At this time, roughly 400,000 years after the Big Bang, our Universe turned from opaque to optically thin, allowing the CMB photons to reach us today. Due to the cosmic expansion the temperature of the CMB photons dropped to T0 = 2.73 K today.
Observations of the CMB reveal very small relative temperature fluctuations of the order 10−5K,
CHAPTER 2. COSMOLOGY
as a proof that the early Universe was extremely homogeneous and today’s anisotropies emerged from these fluctuations and evolved to what we today see as galaxies and galaxy clusters.
The time evolution of the Universe is governed by gravity as the other fundamental interactions are limited to length scales typical for elementary particles (i.e. strong and weak interactions) or limited by the shielding of opposite charges (i.e. electromagnetic interactions). Gravity is described in the framework ofGeneral Relativity(GR) (Einstein,1915), describingspace-timeas a four-dimensional manifold with a metricgµν. Due to symmetry, this rank-2 tensor in four dimensions has ten
indepen-dent components. The dynamics of the metric are then described byEinstein’s field equationswhich connect the geometry of space-time with its energy content. The field equation can be written as
Rµν−1
2gµνR−Λgµν= 8πG
c4 Tµν, (2.1)
with the Ricci tensorRµν, the Ricci scalarRand the cosmological constant Λ. The Ricci tensor is
obtained from the Riemann tensor by contraction Rµν = Rαµαν and the Ricci scalar is given by the
trace of the Ricci tensorR= Rµµ. The Riemann tensor itself characterises the curvature and contains
second derivatives of the metric. Theenergy-momentum tensor Tµν describes the matter content of
the Universe. The constants are Newton’s gravitational constantGand the speed of lightc. For weak gravitational fields and non-relativistic matter Newtonian gravity is restored. GR is highly non-linear as seen above: The geometry of space-time dictates the motion of matter and energy, vice versa the energy content determines the geometry of space-time.
2.2 Friedmann-Lemaˆıtre-Robertson-Walker models
K >0
K <0
K = 0
Figure 2.1:Three different curvature parameters which correspond to different geometries.
For describing the geometry of space-time we are in need of a metric with the line element
ds2=gµνdxµdxν, (2.2)
containing the metric tensorgµνwhich is chosen
to have the signature (−1,1,1,1).
If the metric fulfils the cosmological princi-ple it is called a Robertson-Walker (RW) met-ric (Robertson, 1935; Walker, 1935). Due to isotropy synchronisation between any two clocks needs to be possible, reducing the line el-ement to
ds2=c2dt2+gi jdxidxj, (2.3) and allowing the global foliation of space-time into spatial hyper-surfaces. These are scaled by the cosmological scale factor a(t), responsible for potential isotropic contractions or expansions of the Universe as a whole. Since the hyper-surfaces have to be isotropic and homogeneous, they are spaces of constant curvature and are
pa-rameterised by the curvatureKand further illustrated in Fig.2.1. Three different cases are distinguish-able:
(1) K<0:openUniverse, (2) K=0:flatUniverse,
2.3. COSMOLOGICAL REDSHIFT (3) K>0:closedUniverse.
By introducing the set of polar coordinates (χ, θ, φ), we can rewrite the line element from above as
ds2=−c2dt2+a2(t)h dχ2+ fK2(χ)(dθ2+sin2θdφ2)i , (2.4) with fK(χ)= sinh(√√|K|χ) |K| ifK <0, χ ifK =0, sin(√√Kχ) K ifK >0. (2.5) Moving on to the time evolution of the scale factor, we specify the energy-momentum tensor in Eq. (2.1) as the one of a perfect fluid with density ρ and pressure p. In its eigenframe it has the
componentsT0
0 = −ρc2,Tij = pδij, and all other entries are equal to zero. With this we can simplify the field equations (2.1) to the twoFriedmann equations(Friedmann,1922,1924;Lemaˆıtre,1927):
˙ a a !2 = 8πG 3 ρ− Kc2 a2 + Λ 3 , (2.6) ¨ a a =− 4πG 3 ρ+ 3p c2 ! + Λ3 . (2.7)
The scale factora(t) may be normalised such that at present a(t0) ≡ 1. If the scale factor of a RW
metric satisfies Eq. (2.6) and Eq. (2.7) this metric is called aFriedmann-Lemaˆıtre-Robertson-Walker (FLRW) metric.
2.3 Cosmological redshift
In the year 1917 Vesto Slipher measured theredshiftof galaxies, though it was Georges Lemaˆıtre who interpreted the data correctly in 1927 as the expansion of the Universe. However, credits were given to Edwin Hubble in 1929 and the relation between velocity and distance is calledHubble’s law(Hubble, 1929). It states that extragalactic objects like other galaxies are moving away from us with a velocity proportional to their distance to us. The light emitted from these moving objects is thenredshifted. The expansion itself is parameterised by the scale factora(t), as explained above. In the framework of GR this observation can be understood as follows: as light moves on null geodesics with constantθ
andφ, the line element ds2has to vanish
ds2=0 ⇒ cdt=−a(t) dχ . (2.8)
By integrating this from the time of photon emissionteto present timet0 χ= Z t0 te dχ= Z t0 te cdt a(t) =const. , (2.9)
we see that the derivative ofχwith respect totehas to vanish:
dχ dte =0= c a(t0) dt0 dte − c a(te) ⇒ dt0 dte = a(t0) a(te). (2.10)
A time interval changes during the time of emission and detection of the signal by an observer. This change is proportional to a change in the scale factor of the Universe. Since the frequency of the emitted signal is inversely proportional to a physical time interval and the scale factor increases with time, the signal is shifted towards smaller frequencies. This in turn implies that the wavelengthλ
is shifted to larger values, e.g. blue light is shifted to the red end of the optical band, the light gets redshifted. The cosmological redshiftzis then defined as
1+z≡1+ λ0−λe λe = a(t0) a(te) = 1 a(te). (2.11)
CHAPTER 2. COSMOLOGY
2.4 Hubble function and density parameters
It is common to define theHubble function H(t),
H(t)≡ aa˙ , (2.12)
with the value H0 ≡ H(t0) today. This time-dependent function quantifies the recessional velocity
of distant objects, or equivalently the time evolution of Hubble’s law, see Section2.3. The Hubble constant is given in units km s−1Mpc−1and often written ashin units of 100 km s−1Mpc−1.
We now introduce the so-calledequation of state parameter w,
w≡ ρpc2. (2.13)
For different types of matter we may have different values forw. Non-relativistic matterρm is
char-acterised by w = 0 and relativistic matter (any form of radiation and neutrinos) ρr by w = 1/3.
Non-relativistic matter is composed of baryonic matterρb andcold dark matter (CDM)ρCDM. The
term ‘cold’ refers to the non-relativistic character and ‘dark’ as it is not electromagnetically inter-acting. CDM is so far only accessible to us through its gravitational interaction and its existence is indicated by rotation curves of galaxies and CMB measurements.
By combining the Friedmann equations (2.6) and (2.7), we find anadiabatic equation. This in combination with Eq. (2.13) allows us to infer the dependence of the density on the scale factor,
ρm ∝a−3 and ρr∝a−4. (2.14)
The difference of the two types is understood as follows: The density of non-relativistic matter is diluted by the expansion of the Universe but photons experience an additional redshift, diminishing their energy. Introducing the dimensionlesscritical density
ρcrit≡ 3H 2(t)
8πG , (2.15)
allows us to define the dimensionlessdensity parameters,
Ωm ≡ ρm
ρcrit and Ωr≡ ρr
ρcrit . (2.16)
Correspondingly, contributions from the cosmological constantρΛand from the curvatureρKare given
by:
ΩΛ≡ 3HΛ2 and ΩK≡ −Kc
2
H2 . (2.17)
With these dimensionless parameters and the Hubble function and further replacingρbyρm+ρr, the
first Friedmann equation (2.6) yields H2(a)=H02
Ωr0a−4+ Ωm0a−3+ ΩK0a−2+ ΩΛ0
≡H02E2(a), (2.18)
where we define quantities with the subscript ‘0’ as their present values and also define theexpansion function E(a). Equation (2.6) additionally constrains the density parameters
Ωr+ Ωm+ ΩK+ ΩΛ=1 for alla, (2.19)
which implies that only three of the density parameters are independent. Most interestingly, referring to Eq. (2.18), all density parameters scale with different powers of the scale factor a. For instance,
2.4. HUBBLE FUNCTION AND DENSITY PARAMETERS
Table 2.1:Density parameters, Hubble constant, andσ8.
Parameter WMAP Planck
Ωm0 0.288+−0.00920.0093 0.314±0.014 Ωb0 0.0472±0.0010 0.0486±0.0021 ΩCDM0 0.2408+−0.00920.0093 0.263±0.013 Ωr0 (8.689±0.110)×10−5 (9.187±0.382)×10−5 ΩΛ0 0.712±+0.010 0.686±0.020 h 0.6933±0.0088 0.674±0.014 σ8 0.830±0.018 0.834±0.027
Compilation of the density parameters and the Hubble constant today andσ8. The normalisation of the linear power spectrumσ8will be discussed in Section2.6.2. TheWMAPdata is a best-fit from the nine-yearΛCDMW MAP+BAO+H0 data (Hinshaw et al.,2013) and the third column gives the results from thePlanckCMB temperature power spectrum alone (Planck Collaboration,2013a). The radiation density parameterΩr0=2.469×10⁻⁵h−2(1+0.2271Neff) includes the contribution of neutrinos with an effective number of speciesNeff=3.046.
the radiation density is much smaller than the matter density today, but going back in time, it grows inevitably faster until the epoch when radiation dominated. Vice versa, at present the density parameter of the cosmological constant dominates over the other density parameters. Figure2.2depicts the three density parameters in dependence of the scale factor and indicates the different epochs of evolution in a spatially flat Universe.
The expansion functionE(a) further determines the agetof the Universe sinceH=a˙/a, H0t=
Z a
0
da0
a0E(a0), (2.20)
assumingt = 0 fora = 0. Concentrating on the radiation-dominated and matter-dominated eras we can make further statements. For the matter-dominated era we assume a so-calledEinstein-de Sitter Universe, a flat Universe that only contains matter (i.e.Ωm=1) and obtain
a∝ √
t for radiation-domination and E(a)= √Ωr0a−2
t2/3 for matter-domination and E(a)= √Ω
m0a−3/2. (2.21)
A major goal in modern cosmology has been to measure the above density parameters, where-fore several missions have been launched. The latest measurements infer their results from CMB measurements combined with measurements frombaryon acoustic oscillations(BAO) and local mea-surements of the Hubble constantH0 (Hinshaw et al.,2013). BAOs are oscillations of sound waves,
which emerge from the counteraction of the radiation pressure pointing outwards and inwards point-ing gravitational force in the primordial plasma before recombination. In Tab.2.1we show the results from theWMAP(Hinshaw et al.,2013) after the nine-year data release and the first measurements of Planck(Planck Collaboration,2013a).
According to the Planck measurements and assuming a flat Universe, the Universe is filled by roughly 4.9% matter that we are familiar with, baryonic matter. 26.8% are due to dark matter. But even more energy, namely 68.3%, is contributed from the cosmological constantΛ. Today the con-tribution from radiation is negligible and of the order of 10−5. This leaves us with 95.1% of the total
CHAPTER 2. COSMOLOGY 0 0.2 0.4 0.6 0.8 1 0.0001 0.001 0.01 0.1 1 10 de ns ity pa ra m et er s scale factora
radiation-dominated matter-dominated Λ-dominated
0.2 Ωm
Ωr
ΩΛ
Figure 2.2:Evolution of the three density parameters assuming a flatΛCDM model with best-fit values from WMAP9+BAO+H0measurements.
components, for which ‘observations’ must always be indirect, the sketchedΛCDM describes our Universe accurately to a high degree. Therefore, it is nowadays also called thestandard model of cosmology.
Observations of Supernovae Type Ia 1 (SN Ia) indicate that the Universe is currently in a state of accelerated expansion (Riess et al.,1998;Perlmutter et al., 1999). The second Friedmann equa-tion (2.7) then requires an equaequa-tion of state parameterw < −1/3 or equivalently ‘negative pressure’.
One candidate for this energy density contribution is the cosmological constantΛwhich hasw=−1. An explanation forΛmay be found in the vacuum energy density, which serves as a further source of gravity. However, this would lead to an energy density 120 orders of magnitude larger than the observed value of the critical density. In a more general context the missing energy density is phrased dark energy. Various explanations for the dark energy exist in the literature, one is the class of the so-called quintessence models(Wetterich,1988;Ratra & Peebles, 1988;Caldwell et al.,1998). In this framework dark energy is supposed to be distinguishable from the cosmological constant and de-scribed by a scalar field. The energy-momentum tensor of this scalar field acts on the right-hand side of Eq. (2.1). Another class of models considers changes on the left-hand side of Eq. (2.1), which alters the nature of gravity. Hence they are calledmodified gravity models.
A further puzzling fact of theΛCDM model is that the cosmological constant started to dominate the energy content of the Universe rather recently, allowing us to observe the accelerated expansion. This is calledwhy now problem.
2.5 Distance measures
Euclidian space allows us the definition of unique distance measures, which is not possible anymore in a curved space-time. Depending on the measurement description different measures have to be considered, wherefore we want to explain four commonly used measures: The proper distance, the
1SN Ia, according to current models, are located in binary systems, where a white dwarf and a red giant are in close proximity. As the red giant evolves and exceeds itsRoche volume, it starts to lose mass to the white dwarf. On the other hand, the white dwarf’s mass is limited by theChandrasekhar mass, as its stability arises from the Fermi pressure of its degenerated relativistic electron gas. Once the white dwarf exceeds the Chandrasekhar mass it collapses and releases a specific amount of energy. Therefore all SN Ia nearly peak at the same absolute luminosity, allowing a distant observer to infer itsluminosity distance.
2.5. DISTANCE MEASURES comoving distance, the angular diameter distance and the luminosity distance. The luminosity and angular-diameter distance are defined in regard of their Euclidian counterpart and reparameterised in curved space-time.
i. Proper distance
The proper distanceDp is given by the time a light signal needs to propagate from the source to the
observer, defined as
dDp≡ −cdt=−cda
˙
a , (2.22)
where the minus sign ensures that the proper distance increases away from the observer whileaandt decrease. Integrating this equation and using Eq. (2.18), the proper distance between two redshiftsz1
andz2is Dp(z1,z2)= c H0 Z a(z1) a(z2) da0 a0E(a0). (2.23)
ii. Comoving distance
The comoving distanceDc describes the distance between a source and a distant observer, both
co-moving with the cosmic flow on the spatial hypersurface. Any change in the expansion given by the scale factorahas to be divided out, thus
dDc≡ −cdta =−cdaa˙a. (2.24)
Again, the integral gives the distance between two redshifts, Dc(z1,z2)= Hc 0 Z a(z1) a(z2) da0 a02E(a0). (2.25) 0.001 0.01 0.1 1 10 100 1000 0.01 0.1 1 10 100 d is ta n c e [ c/ H0 ] redshiftz DP DC DA DL
Figure 2.3:Double logarithmic plot of the four distance measures in dependence of redshiftzfor a spatially flat
ΛCDM model (Ωm0=0.272 andΩΛ0 =0.728). iii. Angular diameter distance
The angular diameter distanceDAis defined, as
in Euclidian space, as the fraction of the proper size of an objectδland its observed solid angle
δϑ,
DA≡ δl
δϑ. (2.26)
The physical size in comoving coordinates is given by the FLRW metric Eq. (2.4)
δl=a fK(χ)δϑ , (2.27)
which yields the angular diameter distance DA(z1,z2)=a(z2)fK[χ(z1,z2)]
=a(z2)fK[Dc], (2.28)
with fKfrom Eq. (2.5).
iv. Luminosity distance
The luminosity distanceDLis derived from the relation between the total luminosityLof an object at
z2and the received fluxFatz1
F≡ 4 L
CHAPTER 2. COSMOLOGY
This definition is again generalised to curved space and comoving coordinates. Due to theEtherington relation, the luminosity distance is given as
DL(z1,z2)≡ " a(z1) a(z2) #2 DA = aa(z(z1)2 2) fK[Dc]. (2.30)
The above defined cosmological distance measures are plotted in Fig.2.3in dependence of redshift for a spatially flat ΛCDM model. For small redshifts (i.e. z . 0.2) all distance measures return
approximately the same distance, but for larger redshifts the discrepancy becomes more severe. For instance, in a spatially flat Universe the angular diameter distanceDAis given by
DA(z)= χ
1+z. (2.31)
This has the interesting feature that for smallzthe angular diameter distance increases, but for larger redshifts it decreases, as seen in Fig.2.3. Furthermore, the proper and the comoving distance flatten for large redshifts, which indicates the existence of aparticle horizon. Such a horizon implies that since the Big Bang light can only have travelled a finite distance, limiting the influence on particles to finite regions.
2.6 Structure formation
Up to this point the picture we drew of our Universe was based on the assumption of homogeneity, thus the Universe would be structureless. However, observing the night sky reveals a multitude of structures visible, like our Milky Way, massive galaxy clusters, large filamentary structures or the voids in between, together also known as the cosmic web. In the following sections we want to explain how structures in the Universe evolved. As indicated by the measured matter power spectrum structure formed hierarchically: Small halos form at high redshifts and larger ones formed later. This scenario is calledhierarchical structure formation.
The model of structure formation assumes that structures are forming by gravitational instability emerging from small fluctuations at early times in the Universe. The amplitudes of these fluctuations then grow due to gravitational instability. The origin of these fluctuations is unknown. One assumes them to be related to quantum fluctuations shortly after the Big Bang, enlarged in scale during the phase ofinflation. In this scenario the fluctuations would be uncorrelated and their amplitudes would be Gaussian distributed. Assuming further that the relative matter fluctuations are small, they can be assessed as small perturbations of a uniform background density, allowing us to apply linear perturba-tion theory.
Assuming dark matter particles to be collisionless and other matter components to interact micro-scopically very strong, mass, momentum and energy conservation is guaranteed. In this case we can describe the matter content of the Universe as a perfect fluid, applicable at least on large scales. We can apply the hydrodynamic equations for the densityρ, the velocityvand pressurePin the gravitational fieldΦ:
i. The continuity equation
∂ρ
∂t +∇ ·(ρv)=0, (2.32)
ii. the Euler equation
∂v
∂t +(∇ ·v)v=−∇Φ− ∇P
2.6. STRUCTURE FORMATION iii. the Poisson equation
4Φ =4πGρ . (2.34)
Having this set of equations at hand, we will proceed with the linear perturbation theory.
2.6.1 Linear structure formation
For small density perturbations we can linearise the hydrodynamic equations and decompose the quan-tities into a time-dependent background term and a perturbation term,
ρ(x,t)=ρbg(t)+δρ(x,t), (2.35)
v(x,t)=vbg(t)+δv(x,t), (2.36)
p(x,t)= pbg(t)+δp(x,t), (2.37) Φ(x,t)= Φbg(t)+δΦ(x,t), (2.38)
where the quantities with the subscript ‘bg’ denote the homogeneous background components. The aforementioned density perturbations are characterised by the density contrastδ(x,t),
δ(x,t)≡ ρ(x,t)−ρbg(t)
ρbg(t) . (2.39)
We define thecomoving peculiar velocityu≡ v/aand the adiabaticsound speed c2s ≡ δp/δρ. These
relations are inserted into the set of Eqs (2.32), (2.33) and (2.34) to yield a second-order differential equation for the density contrast when leaving out terms which are not linear in the perturbations,
¨
δ+2Hδ˙−4πGρbgδ− c 2 s
a24δ=0. (2.40)
Decomposing the density contrast into plane waves, inserting this in Eq. (2.40) and additionally trans-forming the equation to Fourier space reveals a more familiar form – an oscillator-like equation. In Fourier space the density contrast ˆδ(k,t) is written as
ˆ
δ(k,t)=Z d3xδ(x,t) exp (ik·x). (2.41) We can identify a particular length scale calledJeans lengthλL ≡ cspπ/(Gρbg). Perturbations with
length scales smaller than the Jeans length will oscillate, perturbations larger than the Jeans length will either grow or decay. On these scales the pressure term in Eq. (2.40) is neglected, which simplifies the equation as no spatial derivatives appear.
In the radiation-dominated era, however, we have to use relativistic fluid mechanics. This alters the shape of Eq. (2.40). We give here the perturbation equations for scales much larger than the Jeans length in both cases,
matter-domination (Ωm =1): ¨ˆδ+2Hδ˙ˆ = 3
2H2δ ,ˆ (2.42)
radiation-domination: ¨ˆδ+2Hδ˙ˆ =4H2δ .ˆ (2.43)
With the ansatz ˆδ(k,t) ∝ tnwe find for the matter-dominated case n = 1,−2/3 and in the
radiation-dominated case n = ±1. If we omit the decaying solution, we get, using the proportionalities from Eq. (2.21), ˆ δ∝ a for matter-domination, a2 for radiation-domination. (2.44)
CHAPTER 2. COSMOLOGY
The linear evolution ofδis then described by thelinear growth factor D+, which allows us to rewrite
the density contrast as
δ(x,t)=δ(x,t0)D+(t). (2.45)
Considering the evolution-equation Eq. (2.40), we see that matter density drives the growth of struc-tures whereas the Hubble expansion counteracts. In more general cases thanΩm = 1, the evolution
equation of the density contrast may only be solved numerically.
2.6.2 The power spectrum
Considering the scenario of cosmic single-field inflation, density perturbations are initially expected to follow a Gaussian distribution (e.g. seeLiddle & Lyth,2000) according to the central limit theorem. Deviations from this Gaussian random field, callednon-Gausianities, are expected to be negligible if measurable at all (Komatsu et al., 2011). Such a Gaussian field is fully described by its mean and variance, whereas in our case the mean equals zero by construction, leaving us only in the need of the power spectrum of the density perturbations to fully describe their statistics.
The variance ofδdefines the power spectrumP(k), which only depends on the modulus ofkdue to isotropy,
hδˆ(k) ˆδ?(k0)i ≡(2π)3P(k)δD(k−k0). (2.46)
Dirac’s delta distributionδD ensures that differentk-modes are uncorrelated, otherwise the
assump-tion of homogeneity would be violated. The star indicates the complex conjugate. In real space the correlation functionξis defined as
ξ(y)≡ hδ(x)δ(x+y)i with y=|y| due to isotropy. (2.47)
ξ(y) is a measure for the coherence of the density contrast for all points separated by the distance modulusy. The varianceσ2is then given byξ(y=0),
σ2=4π
Z dk k2
(2π)3P(k). (2.48)
By introducing a window function WR and its Fourier-transform ˆWR and using Eq. (2.46) we can consider specific scales only
σ2R(a)≡ 1
2π2 Z
dk k2D2
+(a) ˆWR2P(k). (2.49) Usually, a scale of 8 Mpch−1 is considered using a top-hat filter function, defining the cosmological
parameterσ8today.
The above discussion of the power spectrum is true for the matter-dominated era of the Universe in which density perturbations that enter the horizon either grow or decay. The picture changes if we take a closer look at perturbations small enough to enter the horizon in the radiation-dominated era. We inferred from Eq. (2.44) that perturbations in the density contrast grow proportional to a in the matter-dominated era, while they grow proportional toa2 in the radiation-dominated era. But
modes entering the horizon during the radiation-dominated era feel the radiation pressure and will be hindered from growing until the Universe is matter-dominated. Therefore, we can define a scale factor aeq, corresponding to the time when radiation density and matter density were nearly equal. This also
defines a specific length scaleλeq (or wavenumber keq) equal to the Hubble radius at that time and
further allows modes to grow normally withk < keq and hinders the growth of modes withk > keq
nearly entirely. Modes entering the horizon ataenter < aeqwill start growing again once the Universe
2.6. STRUCTURE FORMATION
2.6.3 Non-linear structure formation
Up to now we only considered first order density perturbations, requiring the density contrast to be rather small. However, structures in the Universe do exist, i.e. massive galaxy clusters with densities of 200×ρbg, heavily violating our previous assumption. Numerical simulations allow us to determine
the shape of the power spectrum for non-linear structure formation which differs from the shape of the linear power spectrum. The reason for this is the following: In non-linear structure formation the transfer of power from larger to smaller scales is possible and necessary to form small scale structures– mode couplingoccurs.
A glimpse into non-linear structure formation was developed byZel’dovich(1970), explaining the cosmic fluid with a kinematical approach and decomposing it into particles following specific trajec-toriesr,
r(t)=a(t)x+b(t) f(x), (2.50)
written as the sum of a universal expansion at position xand a peculiar motion described by the dis-placement field f(x) =∇φ(x), being the gradient of some scalar fieldφ. The functionb(t) describes the time evolution of the displacement field. The derivative of Eq. (2.50) can be written in terms of the deformation tensor∂2φ/(∂xi∂xj). With this ansatz one obtains a relation between the density contrast
δand the eigenvalues of the deformation tensor and the ratiob/a. Even though this Zel’dovich ap-proach is an approximation, it allows us to enrich our understanding of structure formation. Assuming a Gaussian random field for the perturbations of the gravitational field, one can infer the probability distribution for the eigenvalues of the deformation tensor. This results in the fact that the probability for any two eigenvalues to be equal is zero, ruling out isotropic collapse of structures. The anisotropic behaviour of gravitational collapse is observationally confirmed. Eventually, the Zel’dovich approx-imation fails once the trajectories of particles start to cross each other as their self-interaction was neglected.
2.6.4 Spherical collapse model
In the preceding section we motivated that isotropic collapse of structures is not possible. Neverthe-less, the so-calledspherical collapse modeltakes a closer look at collapsing spherical overdensities in a homogeneous background with densityρbg. This model is interesting, as one is capable to compute
an analytic solution for the evolution of the density contrast (e.g.Padmanabhan(1993) or the thesis of Puchwein(2007)).
Considering only small scales in an Einstein-de Sitter Universe, a test particle at a physical dis-tancerfrom the centre of the spherical overdense halo follows the Newtonian equation of motion,
¨
r =−GMr2 , (2.51)
with the total massM= 4
3πr3ρ. This equation could, if not focused on anEinstein-de Sitter Universe,
contain contributions from the cosmological constant Λ. The integral of the equation of motion is given by
E = 1
2˙r2− GM
r (2.52)
with the total energyEof the system. In the case ofE <0 the spherical halo first will expand together
with the Universe reaching a maximum radiusrtaand eventually start to collapse at a turn-around time
tta. A solution for the equation of motion in parametric form is given by
r= A(1−cosθ), (2.53)
CHAPTER 2. COSMOLOGY
which depends on the parameterθ. The constantsAandBare related by
A3= B2GM. (2.55)
Assumingr =0 att=0 and inserting the above equation, Eqs. (2.53) and (2.54) yield
r= r2ta(1−cosθ), (2.56)
t= (tta√/2)3/2
GM (θ−sinθ). (2.57)
As restricted to anEinstein-de Sitter Universe, we define the overdensity∆,
∆≡ ρρ bg = 9 2 (θ−sinθ)2 (1−cosθ)3. (2.58)
The density contrastδ≡ρ/ρbg−1, see Eq. (2.39), to lowest order intis then δ≈ 3 20 6t B !2/3 ∝a, (2.59)
giving the linear density contrastδc. The proportionality is due to the fact that during matter-domination
the scale factorais proportional tot2/3. Forθ = πthe overdensity is at its turn-around point and
en-tirely collapses att = 2tta (i.e. θ = 2π) due to symmetry. This implies an infinite density for this
model, but a realistic halo will rather settle in virial equilibrium, where the mean potential energy of the halo is twice the energy at the turn-around. Assuming energy conservation and considering that at turn-around the kinetic energy is zero, the halo will have a radius ofrvir = rta/2. At virialisation we
findθ=2πand thus the critical linear density contrast isδc≈1.69. Given the density contrast we can
calculate the mean densityρv ρv = rta
rvir
!3
[δ(tta)+1]ρbg(tta) ≈178ρbg(tvir). (2.60)
Following from Eq. (2.58) the overdensity is
∆v≈178. (2.61)
A virialised overdense halo thus has a mean overdensity of about 178 times the background density. The linear density contrast δc and the overdensity ∆v are used in cosmology to characterise dark
matter halos. For a more general cosmology than the one considered here, an analytic calculation is not possible and one has to rely on numerical solutions.
2.7 Mass function
In the preceding section we sketched how structures in the Universe form and that they must not collapse isotropically. This allows us to ask the following question: Given that we observe structures, how is the distribution of dark matter halos with mass?
This distribution of halos over mass at a given redshiftzis calledmass function n(M,z). Using the
spherical collapse model from Section2.6.4,Press & Schechter(1974) derived a formula for the mass function. It was reformulated byBond et al. (1991) assuming halo formation to be a random walk process.
We define a characteristic length scaleR(M) of a halo with given massM. A sphere filled with the average background densityρbg= Ωmρcrithas the mass
2.7. MASS FUNCTION which defines the length scale
R(M)= 4 3M πΩmρcrit
!1/3
. (2.63)
To obtain the variance of the density contrast according to Eq. (2.49), the Gaussian density field is smoothed on the scale R(M). This is achieved by convolving the density contrast with a window functionWR,
δR(x,z)≡
Z
d3yδ(y,z)WR(|x−y|). (2.64)
Once the linearly scaled density contrastδR is larger than a specific density contrastδc the overdense
regions should collapse. For this barrier we take the result obtained with the spherical collapse model from Section2.6.4. The probability to form such a halo with massMis
P(δR ≥δc)= Z ∞ δc(z) dδRp(δR)= √ 1 2πσR(z) Z ∞ δc(z) dδR exp − δ2R 2σ2R(z) = 1 2erfc " δc √ 2σR(z) # , (2.65)
with the complementary error function erfc(x) ≡ 1− erf(x). One main assumption of the Press-Schechter formalism is the following: The probability to find aδR above or equal to δc equals the
fraction of the cosmic volumeF with halos of massM; we can writeP(δR ≥ δc) = F(M). The halo
distribution in dependence of mass is then
∂F(M) ∂M dM= ∂P(δR≥δc) ∂σR ∂σR ∂R ∂R ∂MdM. (2.66)
The consideration byPress & Schechter(1974) as sketched above is missing a factor of two. The inte-gral of Eq. (2.66) over all masses is not equal to one but to one half. The solution to this normalisation problem was found byBond et al.(1991) by interpreting the halo formation as a random walk. It is then given by the cloud-in-cloud problem, i.e. the fact that haloes may contain smaller halos.
With the correct normalisation, which we insert here by hand without proof, we can divide the equation by the typical volumeVm = M/ρbgof a halo,
n(M,z)= ∂ 2N ∂M∂V = r 2 π ρbg M δc(z) D+(z)σR ∂lnσ2R ∂M exp " − δ2c(z) 2D2 +(z)σR # (2.67) with the total numberN of halos. This function is calledPress-Schechter mass function and gives a good insight into structure formation with redshift as the linear power spectrum of density fluctua-tions can be computed. The obtained mass function compares very well to those found by numerical simulations.
Even better results are found with a model that accounts for ellipsoidal collapse, which was devel-oped bySheth et al.(2001) and yields the following mass function:
n(M,z)=A r 2 π 1+ 1 ν2q !ρ bg M dν dMexp − ν2 2 ! , (2.68)
whereν= √α δc/[D+(z]σR). For the remaining parameters,Sheth et al.(2001) find by comparison to
numerical results: A=0.322,α= 0.707 andq= 0.3. The Press-Schechter mass function is obtained
forA = 1/2,α = 1 andq = 0. Further work byJenkins et al.(2001) suggests values of A = 0.353,
α=0.73 andq=0.175.
To measure the mass function provides a good way to infer the normalisation of the power spectrum as the mass function depends exponentially on the variance of the density contrast. It also allows us to study the evolution ofΩmas it enters in the mean background densityρbg.
3
Chapter 3Galaxy clusters
Galaxy clusters are the most massive gravitationally bound objects in the Universe. In the sce-nario of hierarchical structure formation (see Section2.6) they are the class of objects formed latest. As cold dark matter is expected to clump on all scales, massive objects such as galaxy clusters should have a broad spectrum of massive sublumps embedded (cf.Boylan-Kolchin et al., 2009; Dolag et al.,2009;Gao et al., 2004, 2011;Giocoli et al.,2010;Zentner et al., 2005). However, the distribution of cold dark matter in galaxy clusters should be least affected by baryonic physics, due to the long cooling time exceeding theHubble time, of the baryonic matter (e.g.Duffy et al.,2010). Galaxy clusters are the class of objects best suited for testing expectations raised by simulations.
On the other hand, galaxy clusters provide information on the cosmological parameters, by means of their population statistics. As pointed out by different authors (e.g. Press & Schechter 1974; Jenkins et al. 2001;Sheth & Tormen 2002;Schuecker et al. 2003;Warren et al. 2006) cluster mass functions constrain the growth of structure, thus testingΛCDM, see also Section2.7.
In the light of these opportunities, many new data sets of cluster observables are becoming or will become available. As an extraordinary example we want to point out a specificHST Multi-Cycle Treasury programme – CLASH (Cluster Lensing And Supernova survey with Hubble), in the course of which 25 X-ray luminous clusters have been observed in 16 bands with a wavelength coverage in the main survey from HST/WFC3/IR through HST/ACS optical to HST/WFC3/UVIS. All of these clusters will be analysed by the CLASH-Team (e.g. Coe et al.,2013;Postman et al.,2012;Umetsu et al.,2012;Zitrin et al.,2012,2013), amongst other techniques, applying strong- and weak-lensing reconstructions of the mass distributions.
This chapter is dedicated to the constituents and the structure of galaxy clusters, as well as the different wavebands which clusters may be observed in.
3.1 Cluster structure
In the following we briefly discuss the current understanding of the structure of galaxy clusters. Exam-ples for four massive galaxy clusters (Abell 383 (A), MACS 1149.6+2223 (B), Abell 2261 (C), MACS 1206.2-0847 (D)), are shown in Fig.3.1. We further give an overview of the different components of galaxy clusters and how their generalised radial density distribution is phrased.
3.1.1 Constituents
First galaxies were observed in our close neighbourhood, though later galaxies in large agglomerations were found by Frederick William Herschel – giving galaxy clusters their name. Galaxies are prominent in the optical band. A cluster may host up to 1000 galaxies, each containing billions of stars. The
CHAPTER 3. GALAXY CLUSTERS
Figure 3.1:Images of strong gravitationally lensing galaxy clusters which are part of the CLASH project. Abell 383 (A), MACS 1149.6+2223 (B), Abell 2261 (C), and MACS 1206.2-0847 (D; Postman et al. 2012).
visible mass of the galaxies is responsible for roughly 1-2% of the total cluster’s mass. Galaxies are used to infer their velocity dispersion (seeBinney & Tremaine,1988;Schneider,2006a) first measured by Zwicky(1933, 1937) and now widely used to recover mass estimates of clusters, via theVirial Theorem(e.g.Diaferio et al.,2005).
Concerning the mass fraction the more massive component is theintracluster medium(ICM) with a mass fraction of roughly 10-15%. Mostly consisting of hydrogen and helium, the ICM radiates thermal bremsstrahlung revealing clusters in the X-ray band. Another signal the ICM is responsible for is the thermal Sunyaev-Zel’dovich effect (SZ) (Sunyaev & Zeldovich, 1980) measurable in the microwave regime. For many clusters the assumption of hydrostatic equilibrium is applicable thus the ICM directly probes the cluster potential well.
The total baryonic mass of clusters is therefore around 15%, thus galaxy clusters are missing a large amount of visible matter. The last 85% are due todark matter, previously discussed in Section2.4.
It was Zwicky(1937), who observed the Coma cluster which provided the first evidence for the presence of dark matter in galaxy clusters. Estimating the total mass of theComa clustermuch higher than inferred from optical measurements was a clear hint for a discrepancy, so far only solvable by a dark matter component.
3.1.2 NFW profile
Many numerical simulations have shown that gravitationally bound structures dominated by dark mat-ter are following a universal density profile, first described byNavarro et al.(1996, 1997, hereafter
3.2. OBSERVING GALAXY CLUSTERS NFW). The NFW profile itself is flatter in the core, steepens around a scale radiusrsand then
asymp-totically approaches a double-logarithmic slope near -3 towards the virial radiusrvir (e.g.Jing & Suto
2000;Merritt et al. 2006;Navarro et al. 2004;Power et al. 2003;Moore et al. 1998,1999and Fig.3.2).
0.001 0.1 10 0.01 0.1 1 10 lo g ( ρ/ ρs ) log(x)
Figure 3.2:Double logarithmic plot of the NFW den-sity profile for x = r/rs. The asymptotic behaviour is illustrated by the dashed lines with slopes of -1 and -3.
The NFW profile is written as
ρ(r)= ρs
(r/rs)(1+r/rs)2, (3.1)
with the characteristic densityρsof the halo.
Slight deviations from this universal profile exist, such as steeper slopes in the cluster core as pointed out by serval authors (Moore et al., 1999, 1998). Furthermore, recent findings by Power et al.(2003) andNavarro et al.(2004) ar-gue for a slope probably depending on the halo mass. These efforts are combined in the gener-alised NFW profile (seeJing & Suto,2002).
However, the above profile is spherically sym-metric, clearly contradicting observed ellipsoidal cluster shapes, as a triaxial cluster shape fits bet-ter to real clusbet-ter observations (Allgood et al., 2006). This is also in agreement with the model of structure collapse according to the Zel’dovich approximation (see Section2.6.3).
The importance of possible triaxial cluster shapes is also revealed by the following: The fraction rvir/rs is called the concentration parameter c and is found in simulations to depend only weakly
on the mass M, decreasing with ∝ M−0.1 (see Navarro et al., 1996, 1997; Seljak, 2000; Bullock
et al., 2001;Eke et al.,2001;Dolag et al.,2004;Shaw et al.,2006;Neto et al.,2007;Macci`o et al., 2007;Duffy et al., 2008; Gao et al., 2008;Macci`o et al., 2008; Zhao et al., 2009, for examples). The concentration parameter is frequently observed to be substantially different than theoretically expected. Particularly in strong gravitationally lensing clusters concentration parameters significantly higher than those found in numerical simulations have been claimed (Broadhurst et al., 2008; Coe et al.,2012, Fig. 14). Some of this discrepancy may be overcome, as pointed out bySereno & Zitrin (2012), by taking cluster triaxiality into account, raising concerns on the universality of the spherical NFW profile. Other explanations to this problem of over-concentrated clusters exist. For instance, an introduced bias given by selection effects due to the used cluster sample (e.g.Meneghetti et al., 2010a).
3.2 Observing galaxy clusters
As mentioned before, clusters are observed in a multitude of different bands probing their different components. For a compilation of commonly used probes see Fig.3.3, where we show that different methods probe different scales in galaxy clusters.
In this section we first want to describe the effect of gravitational lensing in the framework of general relativity. Thereafter, we will focus on the physical principles of the thermal SZ effect and the X-ray emission due to thermal bremsstrahlung.
For a detailed review on gravitational lensing we refer the interested reader toBartelmann(2010), the thesis of Angrick(2011), notes of Meneghetti (2007) and the book bySchneider et al.(2006). Concerning the thermal SZ effect an excellent review is provided byBirkinshaw (1999), as well as for X-ray emission bySarazin(1986);Sarazin & Surdin(1988) and in the recent publication byEttori et al.(2013).
CHAPTER 3. GALAXY CLUSTERS
small ~10kpc small ~100kpc small ~1Mpc
strong lensing weak lensing X-ray emission thermal SZ effect galaxy kinematics flexion
Figure 3.3:Different methods probe different scales in galaxy clusters and thus also their mass distribution. The picture further shows a possible range for flexion measurements (credits: M. Bartelmann).
3.2.1 Gravitational lensing
A method where observations of galaxies are crucial is the effect ofgravitational lensing, even though not the cluster members but rather the background galaxies are the ones of interest here. Gravitational lensing effects give an insight into the surface-mass density or the effective lensing potential of the cluster.
According to general relativity a propagating ray of light is bent towards massive objects by the gravitational potential, nearly analogues to a convex glass lens. Such a propagating ray may be the light emitted by a background galaxy, which in the following will be calledsource. The source is located behind a massive object, e.g. a galaxy cluster, acting as thelens. This lensing effect leads to an apparent position change of the source in the plane of the sky, as well as to distortions depending on the alignment of the lens and source and the strength of the lens itself. Therefore, one can distinguish between two different regimes:
Strong lensingleads to strong image distortions, multiple images, giant arcs or so calledEinstein rings. These visually striking effects occur whenever the source is exactly behind the lens (Einstein rings) or near the centre (strong distortions, multiple images and giant arcs, see also Fig.3.1).
Weak lensingin comparison is only responsible for minor distortions of the source leading to small changes in the ellipticity of the background galaxies. This in turn implies a problem in measuring the effects of weak lensing as galaxies have intrinsic ellipticities. It only allows statistical statements on the weak-lensing signal as the intrinsic ellipticity is expected to vanish if one averages over a large sample of lensed galaxies.
Lens equation
In the following we want to present the framework of gravitational lensing in the so-called thin-lens-approximationas the distances are large in comparison to the size of the lens and the background source. The distance between the observer and the lens is calledDd, at this distance the mass of the
lens is projected onto a plane – the lens plane. It describes the plane in the sky where lensing is assumed to occur. The distance from the lens plane to thesource planeis calledDdsand the distance
from the observer to the source planeDs. As distances are angular diameter distances,Dsis generally
not the sum of Dds andDd (see also Section 2.5). The assumed geometry of the lensing system is
3.2. OBSERVING GALAXY CLUSTERS
lens plane source plane
observer source apparent position Ds Dd Dds lens β θ ξ η αˆ
Figure 3.4:Geometrical description in the thin-lens-approximation, defining the source plane, lens plane and the impact parameterξ, as well as the position angles ˆα,βandθ(see text).
lying at the distanceη=βDsin the source plane. From Fig.3.4we further define the impact parameter
asξ =θDd. As all the angles are expected to be small, simple geometric considerations lead to the so
calledlens equation
η=Ddsαˆ = Ds
Ddξ (3.2)
with the deflection angle ˆα. We can further introduce thereduced deflection angle α(θ)≡ Dds
Ds αˆ(θ). (3.3)
With it, in combination with the position anglesβandθ, the lens equation can be simplified to
β=θ−α(θ). (3.4)
Lensing Potential
From the linearised field equations Eq. (2.1) we can retrieve the deflection angle, which points towards the mass, as ˆ α= 4GM c2 ξ |ξ|2. (3.5)
This is twice the value expected from Newtonian physics where the time-time part of the metric is neglected.
Furthermore, an object acting as a gravitational lens can be described with the three-dimensional mass densityρ(r) with r = (ξ1, ξ2,r3), such that r3 points along the line-of-sight to the lens plane.
Giving this mass distribution as the sum of point masses allows us to replace the mass in Eq. (3.5) by an integration over the density,
ˆ α(ξ)= 4G c2 Z d3r0ρ(r0) ξ−ξ0 |ξ−ξ0|2 = 4G c2 Z d2ξ0Σ(ξ0) ξ−ξ 0 |ξ−ξ0|2. (3.6) The line-of-sight projection of this density is the so-calledsurface-mass density Σ(ξ). This further defines theconvergenceκas the dimensionless ratio of the surface-mass density and thecritical mass