Magnetic Resonance Spectroscopy as applied to epilepsy
Robert Simister, MRCP
Department of Clinical and Experimental Epilepsy, Institute of Neurology,
University College London (UCL), Queen Square,
London WC1N 3BG
Thesis submitted to University College London for the Degree of Doctor in Philosophy, 2010
Abstract p.003
Statement of involvement p.007
Acknowledgements p.008
List of Tables p.009
List of Figures p.010
Published articles and presentations p.012
Main Index p.015
List of Abbreviations p.020
Introduction and Background p.024
Methods p.125 Results p.143 3.1 p.144 3.2 p.168 3.3 p.188 3.4 p.205 3.5 p.224 3.6 p.234 3.7 p.252
Thesis Conclusions and Further Work p.267
Epilepsy is the most common serious disease of the brain. Magnetic Resonance Spectroscopy (MRS) is a novel imaging technique that offers the opportunity for co-localising biochemical information relating to metabolites specific to the study of epilepsy with high resolution MRI.
Aims:
The work included in this thesis was undertaken with two fundamental aims. The first was to apply a standardised MRS methodology in order to gain reproducible semi-quantitative information about the variation of relevant neuro-metabolites such as gamma amino butyric acid (GABA), glutamate (as glutamate plus glutamine [GLX]), N acetyl aspartate (NAA), myo-inositol (Ins) and creatine plus phosphocreatine (Cr) within epilepsy syndromes or pathological groups. The second main aim was to test a series of hypotheses relating to the regulation of the concentrations of these metabolites in the region of epileptic seizures, immediately following seizures and associated with particular medical and surgical treatment interventions.
Methods:
Seven experiments were performed in this thesis. In all seven studies the findings in the patient groups were compared against results from an acquired control group made up of healthy volunteers.
In the first experiment [3.1] twenty patients with temporal lobe epilepsy, with (10), and without hippocampal sclerosis were studied using multi voxel magnetic resonance spectroscopic imaging (MRSI) sequences in order to examine for differences in the obtained metabolites N acetyl aspartate (NAA), creatine plus phosphocreatine (Cr), choline containing compounds (Cho), GLX and myo-inositol (Ins) across the pathological groups and against a control population.
In experiments [3.2], [3.3], [3.4] and [3.6] an MRS protocol that incorporated a double quantum filter acquisition sequence was applied in order to allow measurement of GABA+ (a combined measure of GABA plus homocarnosine) in addition to measurement of the metabolites examined in [3.1]. Studies were
(n =10) or occipital lobe epilepsy (n = 10) [3.2], in the frontal lobes in patients with IGE (n = 21) and within regions of the MRI visible pathology in patients with large focal malformations of cortical development (MCD, n =10) [3.4]. In the last experiment using this technique patients with hippocampal sclerosis and temporal lobe epilepsy (n = 16) were studied in the ipsilateral and also in the contralateral temporal lobes and following temporal lobe surgery (n = 10) [3.6].
In experiment [3.5] ten patients were examined whilst taking and when not taking sodium valproate in order to further examine for an effect of this medication on the measured metabolite concentrations.
In experiment [3.7] ten patients were studied immediately after an epileptic seizure and then again during a subsequent inter-ictal period in order to examine for an influence of the recent seizure on the measured concentrations of the main metabolites.
Results:
MRSI in the temporal lobes in patients with temporal lobe epilepsy identified low NAA in the anterior hippocampus that was most severe in those patients with hippocampal sclerosis. GLX elevation was a feature in the patients without hippocampal sclerosis. Metabolic abnormality was most marked in the anterior compared to the posterior hippocampal regions.
GABA+ levels were elevated in patients with MCD and in the ipsilateral temporal lobe in temporal lobe epilepsy associated with hippocampal sclerosis but levels were not altered in patients with IGE or OLE. GLX was also elevated in MCD in the region of MRI visible abnormality and in IGE patients when measured in the frontal lobes. Low NAA was a feature of TLE and MCD. Patients with IGE showed normal NAA levels in the occipital lobes but reduced frontal lobe concentrations.
within 120 minutes. NAA was not altered and no significant change in lactate concentrations was observed.
Finally sodium valproate treatment was associated with a reduction in the levels of Ins and with unchanged NAA and GLX levels.
Main Conclusions:
MRS techniques demonstrate metabolite abnormalities in epileptic patients. NAA is the most sensitive metabolite marker of chronic pathology but levels are insensitive to recent seizure history. These findings repeat earlier observations of the usefulness of NAA measurement in the assessment of chronic epilepsy whilst illustrating ongoing uncertainty as to the correct patho-physiological interpretation of reduced NAA levels.
Measurable changes in the combined Cr signal are detectable whilst elevated lactate is not reliably observed following brief epileptic seizures at 1.5T. This finding indicates a potential role for MRS in functional activation studies.
Malformations of cortical development have abnormal levels of both GABA+ and GLX and MCD sub-types may well demonstrate different metabolite profiles. This finding suggests that MRS could be a useful tool in the MRI classification of MCD and in the pre-surgical assessment of patients with focal malformations.
Following successful temporal lobe surgery levels of NAA remain unchanged but NAA/Cr levels appear to normalise in the contralateral temporal lobe.
NAA and GLX/NAA levels were altered in the frontal lobes but not in the occipital lobes in Idiopathic Generalised Epilepsy. This finding provides imaging support for frontal lobe dysfunction as a cause or consequence of IGE.
Metabolite levels are affected by administered antiepileptic drugs. Sodium valproate reduces the levels of MRS visible Ins levels whilst topiramate and gabapentin appear
importance in the assessment of treatment effect or in the investigation of patients with possible drug resistance. The effect of valproate on Ins levels may become particularly interesting in the light of a growing understanding of the role of astrocyte dysfunction in a range of neurological conditions which include migraine, epilepsy, Alzheimer’s disease, motor neurone disease and in ischaemic lesions.
Experimental design was decided by myself for experiments [3.2] to [3.7]) and by Friedrich Woermann (experiment [3.1]) following discussion with the other members of the NSE MRS group (Mary McLean, John Duncan and Gareth Barker).
I was responsible for patient recruitment for experiments [3.2] to [3.7]. Experiment [3.1] was commenced by and all subjects were recruited by Friedrich Woermann. I was responsible for the data analysis and interpretation in all experiments
I would like to take the opportunity to particularly thank my supervisors Mary McLean and John Duncan for their support and guidance throughout the period of this research. They will remember how many drafts and revisions they have very patiently reviewed before the completion of the work presented in this thesis.
I would also like to thank:
Gareth Barker who has also played a major role in guiding and reviewing this work.
Friedrich Woermann who generously passed over to me the work that he had started on the first experiment in this thesis.
Tuuli Salmenpera who helped to identify, recruit and often transport patients to the scanner in the post-ictal series.
My contemporaries at the MRI Unit at The National Society for Epilepsy from February 2000 to March 2004 and particularly Sofia Eriksson, Maxime Guye, Rebecca Liu, Martin Merschenke, Tejal Mitchell, Robert Powell, Fergus Rugg-Gunn, Afraim Salek-Haddadi and Tuuli Salmenpera for their time (often as control subjects) and friendship.
The MRI Unit Radiography Department who regularly organised scans for me and usually at short notice on busy days.
Finally and most importantly I have benefited from the generosity of more than 150 patients with epilepsy who allowed me to recruit them into my studies.
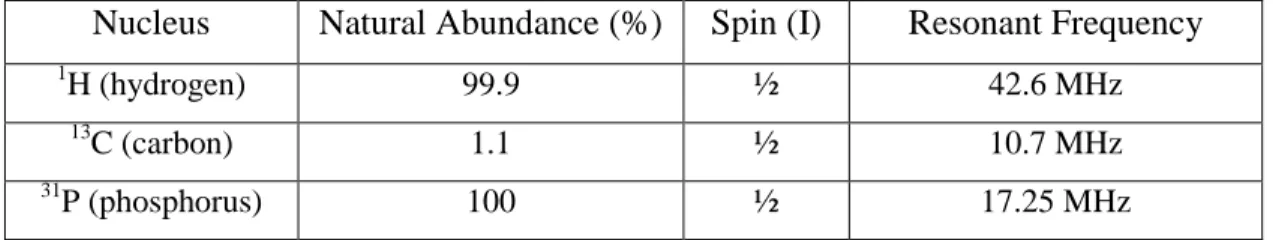
1.6.1 Natural abundance, nuclear spin and resonant frequency for several commonly studied nuclei
1.7.1 Chemical shifts and coupling constants for GABA
3.1.1 Demographics of subject groups in MRSI TLE study (MRSI in TLE) 3.1.2 Metabolite concentrations across temporal lobes (MRSI in TLE) 3.2.1 Demographics of subject groups (OLE/IGE study)
3.2.2 Metabolite concentrations across groups (OLE/IGE study) 3.2.3 Correlation coefficients between metabolites (OLE/IGE study) 3.3.1 Demographics of subject groups (frontal GABA+ in IGE study)
3.3.2 Metabolic concentrations across groups (frontal GABA+ in IGE study) 3.4.1 Demographics of subject groups (GABA+ in MCD study)
3.4.2 Metabolite concentrations across groups (GABA+ in MCD study) 3.4.3 Individual patient metabolite concentrations (GABA+ in MCD study) 3.5.1 Demographics of subject groups (Effect of VPA study)
3.6.1 Demographics of subject groups (GABA+ in TLE study)
3.6.2 Temporal lobe metabolite concentrations (GABA+ in TLE study) 3.6.3 Contralateral temporal lobe concentrations in surgical group (GABA+
in TLE study)
3.7.1 Demographics of subject groups (Post ictal study)
1.2.1 The GABAA receptor
1.7.1 Typical short TE 1H MRS spectrum 1.7.2 Chemical structure of GABA 1.7.3 The PRESS localisation sequence 1.7.4 Typical MRSI pulse sequence 1.7.5 1H MRS spectrum for GABA 1.7.5 1H MRS spectrum for myo-Inositol
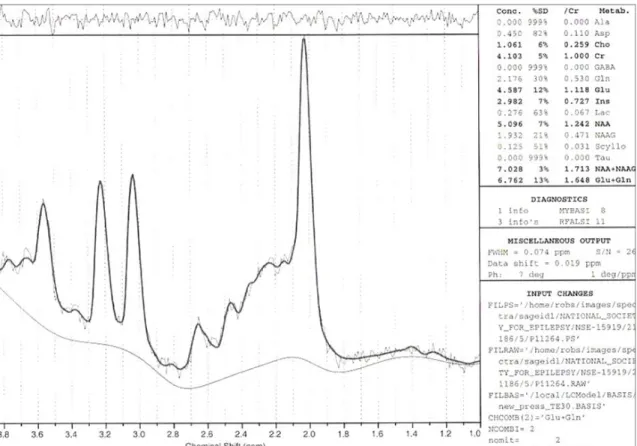
2.2.1 The PRESS localisation sequence 2.2.2 LCModel Output
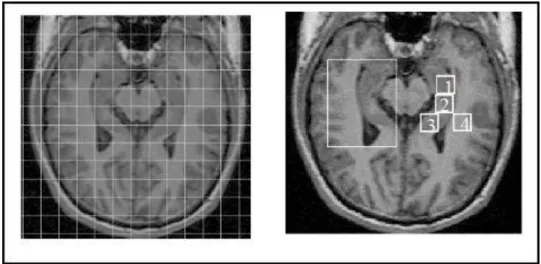
2.3.1 ROI placement using LCModel Interactive 2.3.2 Typical MRSI pulse sequence
2.4.1 DQF GABA+ pulse sequence 2.4.2 DQF GABA+ spectrum
3.1.1 VOI and sample spectra (MRSI in TLE)
3.1.2 95% error bars for metabolites and ratios across groups (MRSI in TLE) 3.2.1 VOI and sample spectra (OLE/IGE study)
3.2.2 Box plots for metabolites and ratios across groups (OLE/IGE group) 3.3.1 VOI and sample spectra (frontal GABA+ in IGE)
3.3.2 Error bar plots for metabolites and ratios across groups (frontal GABA+ in IGE study)
3.3.3 Plots of GLX and NAAt against seizure history (frontal GABA+ in IGE study)
3.4.1 VOI in patients and controls in GABA+ in MCD study 3.4.2 Representative spectra (GABA+ in MCD study)
3.4.3 Metabolite concentrations across groups (GABA+ in MCD study) 3.4.4 Effect of valproate and topiramate in patient group (GABA+ in MCD
study)
3.5.1 VOI and representative spectra (Effect of VPA study)
3.5.2 Error bar plots of inter-scan difference (effect of VPA study) 3.6.1 VOI and representative spectra (GABA+ in MCD study)
(GABA+ in TLE study)
3.6.3 Error bar plots of longitudinal change in metabolite concentrations post surgery (GABA+ in TLE study)
3.7.1 VOI and representative spectra (Post ictal study)
3.7.2 Inter scan change in metabolite concentrations (Post ictal study) 3.7.3 Time line plots for recovery of A) Cr144/Cr30 and B) NAAt144/Cr144 (Post
Original Papers:
Proton MR Spectroscopy of Metabolite Concentrations in Temporal Lobe Epilepsy and Effect of Temporal Lobe Resection. Epilepsy Res. 2009; 83: 168-76. Simister RJ, McLean MA, Barker GJ, Duncan JS.
The effect of epileptic seizures on proton MRS visible neurochemical concentrations. Epilepsy Res. 2007 74, 215—219. Simister RJ, McLean MA, Salmenpera TM, Barker GJ, Duncan JS.
The effect of sodium valproate on proton MRS visible neurochemical concentrations. Epilepsy Res. 2007;74:215-9. Simister RJ, McLean MA, Barker GJ, Duncan JS.
Proton magnetic resonance spectroscopy of malformations of cortical development causing epilepsy. Epilepsy Res. 2007;74(2-3):107-15. Simister RJ, McLean MA, Barker GJ, Duncan JS
Discrimination between neurochemicals and macromolecular signals in human frontal lobes using short echo time proton magnetic resonance spectroscopy.
Faraday Discuss 2004; 126:93-105 Mclean M, Simister R, Barker G, Duncan J. Proton Magnetic Resonance Spectroscopy Reveals Frontal Lobe Metabolite Abnormalities in Idiopathic Generalised Epilepsy. Neurology 2003;61:897-902 Simister R, McLean M, Barker G, Duncan J
A proton magnetic resonance spectroscopy study of metabolites in the occipital lobes in epilepsy Epilepsia 2003; 44: 550-558 Simister R, McLean M, Barker G, Duncan J In vivo GABA+ measurement at 1.5T using a PRESS-localized double quantum filter. Magn Reson Med 2002; 48: 233-241 McLean M, Busza A, Wald L, Simister R, Barker G, Williams S
A short-echo-time proton magnetic resonance spectroscopic imaging study of temporal lobe epilepsy. Epilepsia 2002; 43: 1021-1031 Simister R, Woermann F, McLean M, Bartlett P, Barker G, Duncan J
In vivo short echo time 1H-magnetic resonance spectroscopic imaging (MRSI) of the temporal lobes. Neuroimage 2001; 14: 501-509 McLean M, Woermann F, Simister R, Barker G, Duncan J
Abstracts:
Cerebral metabolite and neurotransmitter concentrations in idiopathic generalised epilepsy measured with short echo time proton MR spectroscopy. Proceedings of the ABN. JNNP 2002 73: 219. Simister R, Mclean M, Barker G, Duncan J
A comparison of metabolite concentrations in primary generalised epilepsy and partial epilepsy using short echo time proton spectroscopy and a double quantum GABA filter. Proc 10th ISMRM 2002; 420. Simister R, McLean M, Barker G, Duncan J Metabolite nulling improves reliability of LCModel analysis of short echo time spectroscopy Proc 10th ISMRM 2002; 529. McLean M, Simister R, Barker G, Duncan J
A short echo time proton magnetic resonance spectroscopic imaging study of metabolites in temporal lobe epilepsy Proc 9th ISMRM 2001; 387. Simister R, Woermann F, McLean M, Barker G, Duncan J
In vivo GABA measurement using a PRESS-localised double quantum filter in patients with malformations of cortical development and epilepsy Proc 9th ISMRM 2001; 420. McLean M, Simister R, Barker G, Duncan J
“A 1H magnetic resonance spectroscopy study of metabolites in idiopathic generalised epilepsy” Association of British Neurologists Meeting April 2002 Simister R, McLean M, Barker G, Duncan J
“A short echo time proton magnetic resonance spectroscopy imaging in temporal lobe epilepsy” 9th ISMRM (International Society for Magnetic Resonance Imaging in Medicine) Glasgow, 2001. Simister R, Woermann F, McLean M, Barker G, Duncan J “A short echo time MRS study of metabolites in the occipital lobes in epilepsy” 10th ISMRM, Hawaii, USA 2002 Simister R, McLean M, Barker G, Duncan J
Poster presentations:
“Idiopathic generalised epilepsy is associated with disturbance in frontal lobe neurochemical concentrations” American Epilepsy Society, Seattle, USA 2002 Simister R, McLean M, Barker G, Duncan J
“A short echo time MRS study of metabolites in the temporal lobe in temporal lobe epilepsy” 3rd International Magnetic Resonance Imaging in Epilepsy conference, Alabama, USA 2000. Simister R, Woermann F, McLean M, Barker G, Duncan J
1.1 Introduction and background p. 024 1.1.1The epilepsies
1.1.1.1 Classification of epileptic seizures and syndromes
1.2 Neurotransmission p. 028
1.2.1 Introduction
1.2.2 Energetics of neurotransmission 1.2.3 Glutamate metabolism
1.2.4 Glutamate receptor function 1.2.4.1 AMPA receptors 1.2.4.2 Kainate Receptors 1.2.4.3 NMDA Receptors 1.2.5 Glutamate and epilepsy 1.2.6 GABA metabolism 1.2.7 GABA receptors
1.2.7.1 GABAA receptors
1.2.7.2 GABAB receptors
1.2.8 GABA and Epilepsy
1.3 Idiopathic Generalised Epilepsies p. 045
1.3.1 Introduction
1.3.2 Pathophysiology of generalised spike wave discharges 1.3.3 Genetics of Idiopathic Generalised Epilepsy
1.3.4 Imaging of Idiopathic Generalised Epilepsy
1.3.5 Idiopathic Generalised Epilepsy Sub-syndrome description 1.3.5.1 Childhood Absence Epilepsy
1.3.5.2 Juvenile Absence Epilepsy 1.3.5.3 Juvenile Myoclonic Epilepsy
1.3.5.4 Idiopathic Generalised Epilepsy with Generalised Tonic Clonic Seizures only
1.4 Localisation Related Epilepsies p. 054 1.4.1 Introduction
1.4.2Temporal Lobe Epilepsy (TLE)
1.4.2.1 Pathology and pathophysiology in TLE 1.4.2.2Clinical features of mesial TLE
1.4.2.3 EEG features of mesial TLE 1.4.2.4 Imaging features of mesial TLE 1.4.2.5 Clinical features of neo-cortical TLE 1.4.2.6 EEG features of neo-cortical TLE 1.4.2.7 Imaging features of neocortical TLE 1.4.3 Occipital lobe epilepsy
1.5 Malformations of cortical development (MCD) p. 061 1.5.1 Introduction
1.5.2 Normal brain development
1.5.2.1 Normal microscopic development of the neocortex 1.5.2.2 Normal microscopic development of the archi-cortex 1.5.3 Abnormal cortical development resulting in MCD.
1.5.3.1 Proliferation and differentiation
1.5.3.1.1 Focal Cortical Dysplasia (FCD) 1.5.3.2 Neuronal migration
1.5.3.2.1 Lissencephaly
1.5.3.2.2 Subependymal nodular heterotopia (SEH) 1.5.3.2.3 Subcortical heterotopia (SCH)
1.5.3.2.3 Band Heterotopia (BH) 1.5.3.3 Post-migrational cortical organisation
1.5.3.3.1Polymicrogyria (PMG) 1.5.3.3.2 Schizencephaly (SHZ) 1.5.3.4 Other relevant MCD sub-types
1.6.1 Introduction 1.6.2 MR physics
1.6.2.1 T1 Relaxation
1.6.2.2 T2 relaxation / decay
1.6.2.3 Repetition Time (TR) 1.6.2.4 The Spin-Echo Sequence 1.6.2.5 The Gradient Echo Sequence 1.6.2.6 The Inversion Recovery Sequence 1.6.3 Clinical application of MRI
1.6.3.1 Structural Magnetic Resonance Imaging (MRI) 1.6.3.2 Quantitative MRI
1.6.3.3 Diffusion weighted MRI 1.6.3.4 Magnetisation transfer MRI
1.6.4 Other non-MRI imaging modalities (PET, SPECT)
1.7 1H Magnetic Resonance Spectroscopy p. 083
1.7.1 Introduction 1.7.2 MRS Physics
1.7.2.1 Chemical Shift 1.7.2.2 Free Induction Decay 1.7.2.3 Spin-spin coupling 1.7.2.4 T2 and visibility
1.7.3 Basic acquisition and processing techniques 1.7.3.1 Shimming
1.7.3.2 Water suppression
1.7.3.3 Choice of Echo Time (TE) 1.7.3.4 Localisation techniques 1.7.3.5 T1 and T2 correction
1.7.3.6 Referencing to a standard solution 1.7.3.7 Signal to noise ratio and signal averaging 1.7.4 Advanced acquisition and processing techniques
1.7.4.3 Higher Magnetic Field Strengths 1.7.4.4 Magnetisation Transfer Spectroscopy 1.7.5 Biological Significance of Metabolite Peaks
1.7.5.1 N-Acetyl Aspartate
1.7.5.2 Creatine plus phosphocreatine 1.7.5.3 Choline containing compounds 1.7.5.4 GABA, glutamate and glutamine 1.7.5.5 Myo-inositol
1.7.5.6 Lactate
1.7.6 MRS in Healthy Adults
1.8 Application of 1H MRS to the investigation of epilepsy p. 106 1.8.1 Introduction
1.8.2 Ex vivo MRS of epileptic tissue 1.8.3 Findings in temporal lobe epilepsy 1.8.4 Findings in extra-temporal lobe epilepsy
1.8.5 Findings in malformations of cortical development 1.8.6 Association of MRS findings with seizure history 1.8.7 Effect of antiepileptic drugs on MRS metabolites 1.8.8 31P and 13C MRS findings in epilepsy
1.8.9 Correlation ofMRSfindings with other imaging modalities
Chapter 2 Common Methodology
p. 125
2.1 Introduction p. 126
2.2 Common Methods p. 126
2.2.1 Subject recruitment
2.2.2 Volumetric data acquisition and analysis 2.2.3 MRS data acquisition
2.2.4 MRS data processing 2.2.4.1 LCModel 2.2.5 MRS data analysis
2.3 Magnetic Resonance Spectroscopic Imaging (MRSI) p. 132 2.4 Double Quantum Filter (DQF) measurement of GABA p. 134 2.5 Metabolite nulled measurement of glutamate and glutamine p. 139
2.6 Post-ictal MRS p. 141
Chapter 3: Results
p. 143
3.1 Multi-voxel MRSI in TLE p. 144
3.2 MRS in the Occipital lobes in IGE and OLE p. 168
3.3 MRS in the Frontal lobes in IGE p. 188
3.4 MRS in Malformations of Cortical Development p. 205 3.5 The effect of Sodium Valproate on MRS measured metabolites p. 224 3.6 MRS in TLE post Temporal Lobe Surgery p. 234 3.7 MRS in the immediate post ictal period p. 252
Chapter 4: Thesis Conclusions and Further Work
p. 267
AED(s) antiepileptic drug(s)
AMPA alpha-amino-3-hydroxy-5-methyl-4-isoxazole proprionate ANLSH astrocyte neuronal lactate shuttle hypothesis
ADP adenosine diphosphate ATP adenosine triphosphate BH band heterotopia
CAE childhood absence epilepsy CBF cerebral blood flow
Cho choline containing compounds
CK creatine kinase
Cl- chloride ion
CNS central nervous system
CO2 carbon dioxide
CA cornu ammonis
Cr creatine plus phosphocreatine CPS complex partial seizure(s) Creat creatine
CSF cerebrospinal fluid CSI chemical shift imaging
CT (X-ray) computed tomography DNA deoxyribonucleic acid
DNET dysembryoplastic neuro-epithelial tumour DQF double quantum filter
DTI Diffusion Tensor Imaging DWI Diffusion-Weighted Imaging ECF extracellular fluid
EEG electroencephalogram
EGTCA epilepsy with generalised tonic clonic seizures on awakening FC febrile convulsion(s)
FCD focal cortical dysplasia FDG [18F]-fluorodeoxyglucose
FLAIR fluid attenuation inversion recovery fMRI functional Magnetic Resonance Imaging FOV field of view
FWHM full width at half maximum GABA gamma-amino butyric acid
GABA+ combined GABA signal from GABA + homocarnosine GAD glutamic acid decarboxylase
GE General Electric
GFAP glial fibrillary acidic protein GLUT glucose transporter
GLX glutamate plus glutamine
GM grey matter
GSWD generalised spike wave discharge GTCS generalised tonic-clonic seizure(s) HS hippocampal sclerosis
Hz hertz
IGE idiopathic generalised epilepsy
ILAE International League Against Epilepsy
Ins myo-inositol
IQ intelligence quotient
IPS intermittent photic stimulation IR inversion recovery
ISIS image selective in-vivo spectroscopy JAE juvenile absence epilepsy
JME Juvenile Myoclonic Epilepsy
Ka kainate
LDH lactate dehydrogenase MAO-B monoamine oxidase type B
MCD malformation(s) of cortical development MQC multiple quantum coherence
MRI Magnetic Resonance Imaging mRNA messenger ribonucleic acid
MWP molecular water pump
mTLE mesial temporal lobe epilepsy NAA N acetyl aspartate
NAAG N acetyl aspartyl-glutamate
NAAt N acetyl aspartate + N acetyl aspartyl-glutamate N-CAM Neural Cell Adhesion Molecule
NEX number of excitations NMDA N-methyl-D-aspartate
NSE National Society for Epilepsy OLE occipital lobe epilepsy
p. page
PET Positron Emission Tomography PCreat phosphocreatine
Pi inorganic phosphate
PI phosphoinositol
PMG polymicrogyria
PNH periventricular nodular heterotopia PPR photo-paroxysmal response
PRESS point resolved spectroscopy
RF radiofrequency
ROI region of interest SCH sub-cortical heterotopia SD standard deviation
SEH sub-ependymal heterotopia
SMIT sodium myo-inositol co-transporter SHZ schizencephaly
SNR signal to noise ratio
SPECT Single Photon Emission Computed Tomography SPM statistical parametric mapping
SPS simple partial seizure(s) SWD spike wave discharge
TE echo time
TMS tetramethyl silane TR repetition time
UK United Kingdom
VBM voxel-based morphometry VOI volume of interest
WM white matter
xTLE extra-temporal lobe epilepsy AED abbreviations: CBZ carbamazepine CLB clobazam CLN clonazepam DZP diazepam ETH ethosuximide GBP gabapentin LEV levetiracetam LTG lamotrigine OXC oxcarbazepine PHT phenytoin PB phenobarbitone PRM primidone TIA tiagabine TPM topiramate VPA sodium valproate
1.1
Introduction and Background
1.1.1 Background
This thesis investigates the application of an MRI technology, Magnetic Resonance Spectroscopy (MRS), to the study of epilepsy. Prior to the period during which this work was undertaken several groups had reported MRS findings in patients with epilepsy. These studies, which had generally reported on only the major visible metabolites and which had used metabolite ratios rather than individual metabolite concentrations, had indicated that MRS may be a sensitive tool for the in vivo assessment of biochemical disturbance associated with epilepsy [for a summary of the available evidence prior to the period of this thesis see(Duncan, 1996;Kuzniecky, 1999)]. This thesis builds on that preliminary evidence and takes advantage of developments in scanner hardware and pulse sequences which allowed the semi-quantification of neuro-metabolites such as glutamate and γ-amino butyric acid (GABA) that are of fundamental importance to understanding epilepsy.
The work included in this thesis was undertaken based upon several hypotheses. Namely that:
I Cortical excitability in idiopathic generalised epilepsy (IGE) is associated with reduced concentrations of GABA and / or raised concentrations of glutamate and glutamine in the cerebral cortex.
II In patients with focal seizures, there will be a disturbance in GABA and / or glutamate levels in the region of the epileptic focus compared to healthy controls measured in the same anatomical region.
III There will be measurable metabolite abnormalities in epileptogenic malformations of cortical development as a consequence of the abnormal development of this tissue.
IV There will be a measurable disturbance of brain metabolites at the site of interictal epileptiform activity that will help to characterise the epileptic focus.
V Immediately following focal seizures there will be a transient disturbance in those measurable metabolites relevant to cell energetics and neurotransmission such as lactate, GABA, glutamate and glutamine and phosphocreatine.
In order to evaluate these hypotheses the work has necessarily covered a wide range of epilepsy syndromes and seizure types which are briefly introduced in this Introduction. Other sections of this chapter are intended to introduce the underlying principles and techniques of MRS relevant to my work and to present the published work from other experimenters in the field that sets the foundation on which this work has been based.
MRS is potentially a uniquely important imaging tool: an MRS experiment can provide simultaneous in vivo data relating to neuronal function and / or cell loss, glial function, and neurotransmitter cycling in regions of interest mapped directly upon structural MR volumetric images. MRS measured metabolite concentrations also appear to be sensitive to exogenous factors such as concomitant antiepileptic medications and endogenous factors such as recent seizure history. The Results and Discussion Chapters of this thesis consider these themes further while the key measured metabolites and some fundamental considerations relating to cell energetics and neurotransmitter cycling in the human brain are briefly introduced first in this Introduction.
Finally, this work is an investigation of epilepsy and epileptic syndromes and for this to be informative a clear understanding of the classification of epileptic seizures and syndromes is necessary from the outset.
1.1.2 Classification of epileptic seizures and syndromes
Epilepsy is a condition characterised by the occurrence of recurrent epileptic seizures of primary cerebral origin. Epileptic seizures consist of a paroxysmal dysfunction of cerebral neuro-physiological function and, in general, have a correlate on the electroencephalogram (EEG).
The International League Against Epilepsy (ILAE) first introduced a classification of the epilepsies in 1970(Merlis, 1970) with subsequent revisions occurring in 1985 and in 1989(The International League Against Epilepsy, 1989). Classification of
seizure type was revised in 1981. In 2001 the ILAE published a proposed new diagnostic scheme for people with epileptic seizures and epilepsy(Engel, Jr., 2001)which described an approach to classification based upon five components or axes: ictal phenomenology, seizure type, syndrome, aetiology and impairment. Seizure type was divided into self-limited seizures (incorporating generalised seizures and focal onset seizures); continuous seizure types incorporating focal and generalised status epilepticus; and precipitating stimuli for reflex seizures. In 2006 the ILAE decided to defer introduction of a new classification system but recognised that the 1989 classification system was imperfect(Engel, Jr., 2006). In this system an epilepsy syndrome is a complex of signs and symptoms that define a unique epilepsy condition and is more than just the seizure type (e.g. Idiopathic Generalised Epilepsy is an epilepsy syndrome characterised by a cluster of signs and symptoms occurring together). An epilepsy disease is a pathological condition with a single specific well defined aetiology (e.g. Unverricht-Lundborg)
In 2009 the ILAE organised for consultation on a revised terminology for the orgnisation of the epilepsies(ILAE Commission on Classification and Terminology, 2009). The revised terminology will make a number of changes to the above classification system. Amongst these changes is the recognition that generalised seizures may originate at some location but rapidly engage bilaterally distributed networks whilst focal seizures may be discretely localised or more widely distributed in networks limited to one hemisphere but will have onset that is consistent from one seizure to another. The use of the term “syndrome” will be restricted to a group of clinical entities that are reliably identified by a cluster of electro-clinical characteristics. Underlying aetiology will be grouped as Genetic, Structural / Metabolic and Unknown.
Seizure classification will also change with a new structure for the description of generalised seizures
GENERALIZED SEIZURES Tonic Clonic (in any combination) Absence:
Typical Atypical
Absence with special features Myoclonic absence Eyelid myoclonia Myoclonic Myoclonic Myoclonic atonic Myoclonic tonic Clonic Tonic Atonic
The description of focal seizures will also change so that the current concepts of “simple” and “complex” partial seizures and secondarily generalised seizures will be revised to reflect the often difficult distinction between strictly “simple” and “complex” seizures.
The old concept of an “epileptic disease” will be lost and syndromic classification as “electroclinical” syndromes will be tighter and will represent distinctive disorders identifiable on the basis of a typical age onset, specific EEG characteristics, seizure types, and often other features which, when taken together, permit a specific diagnosis. Other common entities which will represent electro-clinical syndromes but which do represent common clinical entities such as mesial temporal lobe epilepsy will be referred to as Constellations. Epilepsies secondary to specific structural or metabolic lesions or conditions and Epilepsies of Unknown Cause will represent the remaining two classification groups. The terminology “Idiopathic Generalised Epilepsy” for the cluster of epilepsy syndromes described in Section 1.3 will remain for the time being but with the recognition that the term “idiopathic” is now inaccurate and out-dated.
1.2 Neurotransmission
1.2.1 Introduction
1.2.2 Energetics of neurotransmission 1.2.3 Glutamate metabolism
1.2.4 Glutamate receptor function 1.2.4.1 AMPA receptors 1.2.4.2 Kainate Receptors 1.2.4.3 NMDA Receptors 1.2.5 Glutamate and epilepsy 1.2.6 GABA metabolism 1.2.7 GABA receptors
1.2.7.1 GABAA receptors
1.2.7.2 GABAB receptors
1.2.7.3 GABAc receptors 1.2.8 GABA and Epilepsy
1.2.1 Introduction
Several of the neuro-metabolites that are visible to MRS play an important role in the fundamental processes of brain cells, including energy balance and signalling. These metabolites include glutamate, glutamine, γ-amino butyric acid (GABA), lactate and creatine (Creat) plus phosphocreatine (PCreat). Glutamate and GABA are respectively the principal excitatory and inhibitory neurotransmitters in the brain and the study of both is fundamental to an understanding of epilepsy.
1.2.2 Energetics of neurotransmission
Brain metabolism accounts for 20% of the body’s resting metabolism(Leonard et al., 2007). MRS studies have shown that glucose utilisation is closely linked to the rate of brain glutamate – glutamine cycling between neuronal and glial compartments and indicate that up to 75% of total energy expenditure in grey matter is devoted to cell to cell signalling(Pellerin et al., 1998;Sibson et al., 1998a;Sibson et al., 1998b;Rothman et al., 1999;Attwell and Laughlin, 2001).
Under normal conditions the brain derives almost all of its energy from the oxidation of glucose(Simpson et al., 1978). For this it needs a continuous supply of glucose and oxygen delivered by the blood supply through a rich network of vessels. Maintenance of bio-energetic homeostasis requires that the metabolic rate varies rapidly in response to abrupt changes in cell energy demand. Glycolysis is the series of enzyme catalysed reactions in the cytosol responsible for the breakdown of glucose with the formation of two molecules of ATP and pyruvate. In the presence of oxygen the pyruvate so formed would normally enter the Krebs cycle (tricarboxylic acid cycle [TCA]) and undergo oxidative phosphorylation.
Glucose is transported into neurones and astrocytes by several members of the GLUT family of membrane spanning proteins. In the brain the important transporters are GLUT1 (present on astrocyte cell membranes) and GLUT3 (present on neuronal cell membranes)(Maher et al., 1994). They show maximum transport rates several orders of magnitude higher than seen with non-brain located glucose transporters so glucose transport is not usually a rate limiting step for glycolysis(Maher et al., 1994). Astrocytes are ideally positioned to sense increases in synaptic activity and increase glucose uptake. These cells cover the surface of the intra-parenchymal capillaries with specialised processes called astrocytic end feet
and GLUT1 are expressed on these feet(Morgello et al., 1995) suggesting that astrocytes may be a likely site of prevalent glucose uptake. Other astrocyte processes wrapped around synaptic contacts possess receptors and reuptake sites for neurotransmitters.
The conventional view that brain energy metabolism is almost exclusively aerobic was challenged by the observation of a decoupling of O2 consumption from glucose
utilisation in activated brain tissue(Fox and Raichle, 1986;Villringer and Dirnagl, 1995). Further support for these observations was obtained from MRS work in humans (Frahm et al., 1996; Prichard et al., 1991; Sappey-Marinier et al., 1992), and in animals (Fellows et al., 1993; Hu and Wilson, 1997b), showing an increase in tissue or extracellular lactate during cerebral activation and in turn this has led to a detailed discussion as to the potential role of lactate as a neuronal fuel in activated brain tissue. Most discussion has centred around a proposal by Pellerin and Magistretti and referred to as the astrocyte–neuron lactate shuttle (ANLS) hypothesis (Pellerin and Magistretti, 1994, 2003) which has sought to link export of astrocyte produced lactate via aerobic glycolysis (i.e. glycolysis derived lactate despite the presence of oxygen) to neurons with glutamate-glutmamine cycling between these two cell compartments.
This hypothesis was based in large part on work performed using 13C MRS by Sibson and others where rates of total glutamate to glutamine cycling were measured against neuronal glucose oxidation rates in anaesthetised rats and at different levels of electrical activity and which found a linear relationship above electrical baseline with a slope of 1 indicating a 1:1 relationship(Sibson et al., 1997;Sibson et al., 1998a;Sibson et al., 1998b;Rothman et al., 1999). This was combined with glial culture studies performed which described glial glutamate uptake(Flott and Seifert, 1991), co-transport with Na+ stimulated glial glycolysis(Kimelberg et al., 1989) and lactate production(Ercinska and Silver, 1987). In this theory the two ATP equivalents produced per glucose molecule were in principle sufficient to maintain active glutamate clearance from the extracellular space and recycling to the neurone (one used for pumping of Na+/K+ ions and one for glutamine synthesis).
Lactate normally represents a metabolic dead end unless it is converted back to pyruvate. This can only be accomplished with the enzyme lactate dehydrogenase
(LDH) which has several isoforms each representing a tetrameric combination of two different polypeptide chains. LDH5 is found in tissues producing lactate while tissues containing predominantly the LDH1 isoform are more oxidative and consume lactate by favouring conversion to pyruvate. These properties have significance for cell physiology. Increase in brain adenosine diphosphate (ADP) concentration stimulates glycolysis by activation of the regulatory enzyme phosphofructokinase. When maximally stimulated the rate of formation of pyruvate can rise to close to the maximum rate at which it can enter the tricarboxylic acid (TCA) cycle. The increase stimulates pyruvate conversion into lactate as well as its transport into the mitochondrial matrix and export into the circulation. The greater the equilibrium lactate/pyruvate ratio the more slowly this rise occurs. For cells with a greater proportion of LDH5 isoforms than LDH1 there is a much higher rate of increase of conversion into lactate. There is evidence that mRNA for LDH1 alone is expressed in neurones while astrocytes appear to express both LDH1 and LDH5 and their corresponding mRNA(van Hall G., 2000).
The ANLS hypothesis has been the subject of an intense debate during the last
decade [for example: (Magistretti et al., 1993;Magistretti and Pellerin, 1997;Pellerin
et al., 1998;Magistretti and Pellerin, 1999;Magistretti et al., 1999;Magistretti and Pellerin, 2000;Pellerin et al., 2001;Chih et al., 2001;Dienel and Hertz, 2001;Pellerin and Magistretti, 2003;Mangia et al., 2003a;Mangia et al., 2003b;Hertz, 2004;Pellerin et al., 2007;Simpson et al., 2007;Mangia et al., 2009). Several of these authors have disputed the validity of the ANLSH(Chih et al., 2001;Gruetter, 2002;Hertz and Hertz, 2003;Mangia et al., 2009) and in particular the requirement of the hypothesis that neurones preferentially utilise astrocyte derived lactate ahead of glucose in oxidative metabolism and the assumption that astrocytic oxidative phosphorylation does not play a part in these energy transactions. However there remains general agreement that there is a link between the rate of glutamate-glutamine cycling and the TCA flux of the neuron even if this relationship does not fit the 1:1 association necessary for the ANLSH.
The energy currency of cells, adenosine triphosphate (ATP), is the link between energy utilising and energy producing processes. Brain energy metabolism normally maintains constant concentration of ATP as the processes that restore this metabolite are sensitive to increased ATP utilisation. Observations in heart and brain suggest
that even a tenfold increase in cellular work output can be sustained with minimal ATP concentration fluctuation(Petroff et al., 1984;Young et al., 1985). Both short term and longer term regulatory mechanisms are used to maintain a constant concentration of ATP. One important short term mechanism for maintaining ATP concentration is by hydrolysis of PCreat(Fedosov, 1994;Friedman and Roberts, 1994;Wallimann et al., 1998;Brustovetsky et al., 2001;Neumann et al., 2003). More sustained increases in rates of ATP utilisation are balanced by increases in rates of glycolysis and oxidative phosphorylation.
The enzyme creatine kinase (CK) catalyses the inter-conversion of ADP and PCreat with ATP and Creat according to the reaction:
ADP + PCreat ATP + Creat
Only after PCreat is reduced by 70 - 80% is ATP concentration lowered, in parallel with the accumulation of ADP and, later on, AMP(Hilberman et al., 1984). The transfer of energy from the mitochondrial matrix to the cytoplasm is achieved via a creatine phosphate energy shuttle system(Bessman and Geiger, 1981). CK isoforms are present both within mitochondria and also within the cytosol. Intracellular compartmentation of these enzymes helps to establish a buffering system for cellular energy stores and a shuttle for high-energy phosphates from the mitochondria to the cytosol. At the outer surface of the inner mitochondrial membrane a mitochondrial isoform of CK (MtCK) is coupled both structurally and functionally to the adenine nucleotide translocator(Jacobus and Lehninger, 1973;Moreadith and Jacobus, 1982). As ATP derived from oxidative phosphorylation enters the inter membranous space of mitochondria MtCK preferentially transfers the gamma phosphoryl to creatine and ADP is recycled back to the matrix(Wallimann et al., 1998) whilst cytosol located CK isoforms (BCK) can both utilise PCreat to convert ADP to ATP and convert ATP to PCreat for energy storage(Fedosov, 1994). In most regions of the brain BCK is concentrated in synaptic regions indicating the importance of the shuttle in the metabolic support of synaptic transmission(Friedman and Roberts, 1994).
1.2.3Glutamate metabolism
The amino acid L-glutamate is the major mediator of excitatory signals in mammalian central nervous system. Glutamate and -amino butyric acid (GABA), its conjugate inhibitory neurotransmitter, constitute the principal transmitters in more than 90% of cortical neurons in the adult mammalian brain (Nicholls, 1989, 1993) and glutamate is probably involved in most aspects of normal brain function including cognition, memory and learning(Fonnum, 1984;Collingridge and Lester, 1989;Headley and Grillner, 1990). Most neurons, and some glial cells have glutamate receptors in their plasma membranes but receptor concentration differs greatly in these cell types; glutamatergic neurons possess ~80% , whereas GABAergic neurons contain between 2% to 10% and astrocytes ~10% of total tissue glutamate (Storm-Mathisen et al, 1983; Ottersen and Storm-Mathisen, 1984; Korf and Venema, 1983; Van den Berg and Garfinkel, 1971; Patel et al, 1974; Ottersen et al, 1992; Lebon et al, 2002).
The brain contains huge amounts of glutamate, about 5–15 mmol per kg wet weight(Schousboe, 1981), but only a tiny fraction of this glutamate is normally present in the extracellular compartment. The concentrations in the extracellular fluid, which represents 13–22% of brain tissue volume, and in the cerebrospinal fluid (CSF) are normally around 3–4 μM and around 10 μM, respectively(Lehmann et al., 1983;Hamberger and Nystrom, 1984). Consequently, the concentration gradient of glutamate across the plasma membranes is several thousand-fold. The highest concentrations are found inside nerve terminals(Ottersen et al., 1992;Storm-Mathisen et al., 1992).
The distribution of glutamate is in a dynamic equilibrium which is highly sensitive to changes in the energy supply. Glutamate is continuously being released from cells and removed from the extracellular fluid. Synaptically released glutamate is taken up mainly by astrocytes, driven by the co-transport with each glutamate of 3 Na+ and 1 H+ and the counter transport of 1 K+(Levy et al., 1998). Approximately one third of the glutamate so taken up by the neighbouring astrocytes is converted into glutamine (de Barry J. et al., 1983) in a process requiring 1 ATP per glutamate. One quarter of the glutamate remains as glutamate, 1/5 is converted to alpha-ketoglutarate by GAD and the other 1/5 may be transaminated by aspartate.
Glutamine may leave the astrocyte and enter neurons without consuming energy. In the neuron the glutamine may be converted into glutamate and repackaged in synaptic vesicles. This packaging is powered by vesicular H+–ATPase. At least one H+ is pumped to accumulate a glutamate anion. This requires hydrolysis of 1/3 ATP molecule. An extra 1.14 ATP/glutamate may be hydrolysed to counteract leakage from the vesicle. For the average 4.000 glutamate molecules per vesicle, 11, 000 ATP are required. Other energy requirements are due to activation of post synaptic receptors in the post-synaptic neuron, pre-synaptic Ca2+ fluxes and the vesicular release mechanism, the energy need to maintain action potentials and the energy expended on the resting potential. In total the energy expended per vesicle of glutamate released is 1.64 x 10⁵ ATP molecules(Attwell and Laughlin, 2001).
This trafficking of glutamate and glutamine between astrocytes and neurons has been proposed to be a major pathway by which transmitter glutamate is recycled. It is commonly referred to as the glutamine–glutamate cycle. The concept of a compartmentation of glutamate into two pools was introduced in the early seventies based on 14
C tracer studies (van den Berg and Garfinkel, 1971) and the notion of a predominantly glial synthesis of glutamine a little later when glutamine synthetase was shown immunocytochemically to be a glial enzyme(Martinez-Hernandez et al., 1977;Erecinska and Silver, 1990) (Westergaard et al., 1995). Glutamine is normally present in the extracellular fluid at around 200–500 μM (Gjessing et al., 1972;Hamberger and Nystrom, 1984). This does not compromise neurotransmission because glutamine does not activate glutamate receptors.
Following the release of glutamate from a pre-synaptic nerve terminal, glutamate will diffuse into the synaptic cleft and interact with glutamate binding proteins (transporters and receptors) present there, e.g. AMPA and NMDA receptors. The diffusion will continue out of the cleft and glutamate may interact with metabotropic glutamate receptors along the spine and nerve terminal membranes and come within reach of glial glutamate transporters.
Metabotropic glutamate receptors located pre-synaptically on glutamatergic and on some GABAergic nerve terminals modulate the release of the transmitter(Sanchez-Prieto et al., 1996;Scanziani et al., 1997;Vogt and Nicoll, 1999). This implies that glutamate transporters are indirectly involved in the control of transmitter release
because they control the amount of glutamate that reaches the pre-synaptic receptors. In line with this, inhibition of glutamate uptake has been reported to cause decreased synaptic release of glutamate and GABA(Maki et al., 1994;Semyanov and Kullmann, 2000) (Maki et al., 1994) due to increased activation of these receptors. The concentrations of glutamate transporter molecules in brain tissue are very high. It has been shown that 15, 000 and 21, 000 glial glutamate transporter molecules are present per μm3
tissue in the striatum radiatum of hippocampus CA1 and the molecular layer of cerebellum, respectively(Lehre and Danbolt, 1998).
The glutamate concentration profile within the synaptic cleft depends on the amount of glutamate released into the cleft, on the speed with which it is released and on how fast it is removed from the cleft. The removal depends on uptake and on diffusion which again depends on the water concentration, the tortuosity of the extracellular space and the interaction with glutamate binding sites. Regulation of this activity can be modulated at many levels, e.g. DNA transcription, mRNA splicing, protein synthesis, protein targeting, and actual amino acid transport and associated ion channel activities(Gegelashvili and Schousboe, 1998;Sims and Robinson, 1999).
Failure of regulation may lead to the ‘deleterious network hypothesis’(Ying, 1998) in which high extracellular glutamate can activate glutamate receptors causing further glutamate release. Glutamate receptor activation increases energy consumption and free radical production which may in turn impair energy production and glutamate uptake and possibly even reverse the transporter direction leading to an escalating positive feedback of glutamate release. The influx of ions may cause oedema(Kimelberg et al., 1995) and ischaemia and the formation of highly reactive compounds such as the superoxide anion radical (O2-), hydroxyl radicals, H2O2 and peroxynitrite (for review, see (Fridovich, 1997;Koppenol, 1998)
leading to neuronal injury or death(Gotz et al., 1994;Dawson and Dawson, 1996;Delanty and Dichter, 1998). Regulation failure secondary to down-regulation of glial glutamate transporters has been described in a variety of situations, e.g. after transient ischemia, in amyotrophic lateral sclerosis, and after traumatic brain injury.
1.2.4 Glutamate receptor function
Glutamate exerts its effects by action on glutamatergic receptors of which there are ionotropic and metabotropic receptor subtypes. Each of the two main families of glutamate receptors comprises three functionally defined groups of receptor. These are made up of numerous individual subunits, each encoded by a different gene. Ionotropic sub-types include three classes originally named after selective agonists: N-methyl-D-aspartate (NMDA), α-amino-3-hydroxy-5-methyl-4-isoxazole propionic acid (AMPA) and kainate (Ka). As many as ten distinct subfamilies of ionotropic glutamate receptor genes have been identified, based on evidence from molecular biology experiments.
1.2.4.1 AMPA receptors
AMPA receptors are the receptors responsible for most rapid excitatory transmission within the vertebrate CNS. The associated channels are rapidly activated and inactivated, and appear to be present on all neurons within the CNS. AMPA receptors can be activated following the binding of L-glutamate and other agonists, such as quisqualate and domoic acid, as well as AMPA. The affinity of AMPA receptors for L-glutamate, the endogenous amino acid that represents the most likely candidate in mediating neurotransmission at these receptors, is much lower than is the affinity at NMDA receptors.
Four glutamate receptors (GluR 1 to GluR 4) have been cloned and identified as subunits which have the electrophysiology and pharmacology of the AMPA receptor. AMPA receptors are widely present throughout the brain, although there are regional differences in the relative amounts of each receptor.
1.2.4.2 Kainate Receptors
The distinguishing hallmark of the electrophysiology of kainate receptors is that, in general, for vertebrate CNS neurons, there is no agonist-induced desensitization. However, like the AMPA receptor subfamily, the kainate receptors are coupled to ion channels that are permeable to monovalent cations and have reversal potentials near 0 mV. Often, these receptors are considered, along with AMPA receptors, to be simply non-NMDA receptors, as both types have overlapping pharmacologic and electrophysiological profiles.
In situ hybridization studies have led to the discovery of different distributions throughout the brain for mRNA encoding the glutamate receptors GluR 5, 6, and 7 respectively. In contrast to GluR5 and GluR6, GluR7 receptors are not present in high numbers in the hippocampus, although they have been found in the granule cells of the dentate gyrus. Messenger RNA for both GluR6 and GluR7 is present in high abundance in brain regions that have been found to be profoundly sensitive to destruction following kainic acid treatment. These areas include the hippocampus, cortex, cerebellum, and reticular thalamic regions. KA1 is expressed at high levels in only CA3 pyramidal cells and dentate granule cells, whereas KA2 is found in virtually all brain regions. There is evidence to support the hypothesis that the KA2 receptor is co-expressed in some areas with GluR6 and GluR5, and that KA1 may be co-expressed with GluR6 in the hippocampus.
1.2.4.3 NMDA Receptors
Agonists at the NMDA receptor include N-methyl-D-aspartate, glutamate, and a variety of other excitatory amino acids. As with the non-NMDA receptor, the NMDA receptor possesses two agonist-binding sites. The NMDA receptor is also distinguished by the fact that it has an absolute requirement for a co-agonist, glycine. If the glycine site on the receptor is blocked or unoccupied, binding of glutamate to the receptor will not result in the channel opening. In addition to its co-agonist requirement, the NMDA receptor has been shown to be modulated by Mg2+, H+, Zn2+, polyamines and steroids.
The behaviour of the activated NMDA receptor-channel complex differs dramatically from that of the non-NMDA receptor. Activation of the channel is much slower, with the time to the peak current being often tens of milliseconds. Desensitization at NMDA receptors during exogenous application of agonist takes several hundred milliseconds to develop, whereas desensitization at AMPA receptors occurs within 5–10 ms.
Another difference between non-NMDA and NMDA receptors is the voltage-sensitive block of Mg2+ at the NMDA receptor. In addition, single-channel experiments have revealed that once agonist has bound to the NMDA receptor, the
channel can open and close repeatedly for up to several hundred milliseconds, resulting in long-lasting currents.
1.2.4.4 Metabotropic receptors (MGluR)
These receptors, unlike their ionotropic counterparts, are not comprised of subunits that form an integral ion channel; instead, they are comprised of polypeptides that have a trans-membrane spanning domain with a large extracellular NH2 terminal
region. When an agonist binds to the mGluR, activation of a variety of G-proteins occurs. This G-protein coupled activation then results in a diverse biochemical cascade that can result in the modulation of a variety of cellular functions, such as current flow through voltage-gated ion channels. To date, within the three groups of receptors, eight subtypes of the mGluR have been cloned and correspond to a novel gene family of G-protein coupled receptors. Activation of this class of glutamate receptors has been implicated in a variety of CNS functions, including different forms of synaptic plasticity and excitotoxicity.
1.2.5 Glutamate and epilepsy
Elevated glutamate concentrations have been observed in most(Perry et al., 1975;Sherwin et al., 1988;Petroff et al., 1989) but not all(Peeling and Sutherland, 1993;van Gelder and Sherwin, 2003) ex-vivo studies of resected epileptic tissue. In patients with refractory complex partial seizures requiring depth electrode insertion for further electrographic investigation, During and Spencer were able to implant micro-dialysis probes bilaterally along the hippocampi. Their measurements of glutamate and GABA concentrations in relation to the electrographic onset of spontaneous seizures showed a significant increase in glutamate concentration directly before seizure onset on the epileptogenic side. The non-epileptogenic side showed a smaller increase in glutamate concentration beginning after seizure onset and an associated rise in GABA concentration.(During and Spencer, 1993). During and Spencer were also able to report the observation that the glutamate levels fell slower indicating impaired removal from the extra cellular space
Other groups have found similar. Wilson (Wilson et al 1996 add) found elevated glutamate, aspartate and GABA in the epileptogenic hippocampus whilst Thomas and Philips found similar with spontaneously vigorous hippocampal epileptiform
activity increased by more than 23 fold, 19 fold and 10 fold compared to cases with minimal hippocampal activity.
Glutamate acting on AMPA, NMDA and probably also mGluR1 receptors is thought to play an important role in cell death subsequent to status epilepticus. The primary mechanism involved is ionic disequilibrium related to the excessive entry into the cell of Na+ and Ca2+ through ligand gated voltage sensitive channels. Raised intracellular Ca2+ activates various enzymes (e.g. proteases, phospholipases, nitric oxide synthesis or endonucleases) that contribute to cell death(Meldrum, 2000). Agonists acting at GluR are pro-convulsant following intra-cerebral or systemic injection. Antibodies to GluR3, as found in sera of subjects with Rasmussen’s encephalitis, enhance neuronal excitability and are associated with seizures. Kainate and domoate, which are synthesised by marine plants, induce limbic seizures apparently by acting at high-affinity kainite receptors in the CA3 subfield of the hippocampus. Pre-synaptically they inhibit GABA release; post-synaptically they are depolarising. Seizures can also be induced by agonists acting on the NMDA receptors and type 1 metabotropic receptors whilst NMDA and AMPA receptor antagonists are powerful anticonvulsants in a range of animal models(Meldrum and Chapman, 1999).
For these reasons precise regulation of glutamate is crucial in healthy tissue and likely to be impaired in epileptogenic tissue. MRS allows the in vivo study of glutamate (in this thesis as the combined signal of glutamate plus glutamine [GLX]) and measurement of GLX in different epileptic disorders is an important part of this thesis.
1.2.6 GABA metabolism
The role of GABA as an inhibitory neurotransmitter in the mammalian brain was firmly established by the mid-1970s. It is estimated that between 17% and 50% of all synapses in the brain are GABAergic (Bloom and Iversen, 1971; Mody et al., 1994). GABA exerts its effect through GABAA, GABAB and GABAC receptors (see
below). The clinical importance of the GABAergic system is reflected in the wide range of drugs modifying GABAergic transmission (mainly GABAA receptors),
and anxiolytics. The paramount importance of GABAmetabolism is reflected in the multiple roles attributed to GABAergic transmission including the modulation of cortical excitability, anxiety levels, feeding and drinking behaviour, circadian rhythms, cognition, vigilance, memory and learning [reviewed by (Sieghart et al., 1999)]. In the developing brain, however, it is now established that GABA-mediated signalling can be excitatory and has been implicated in the regulation of several phases of brain development from cell proliferation to circuit refinement(Ben Ari, 2001;Ben Ari, 2002;Ben Ari et al., 2004). GABAergic transmission may also sometimes become excitatory in adults, for example in patients with mesial temporal lobe epilepsy (mTLE)(Fujiwara-Tsukamoto et al., 2003;Ben-Ari, 2006). In microdialysis experiments of epileptogenic hippocampi epileptic seizures were associated with large increases in glutamate but also with elevation of GABA indicating ictal activation of GABAergic pathways.
The evidence for the role of GABA as an important inhibitory neurotransmitter began to accumulate when GABA was localised to mammalian nerve terminals and antibodies raised to GABAergic enzymes were shown to localise to inhibitory nerve terminals [for recent review of GABA metabolism and mechanisms of action see (Schousboe and Waagepetersen, 2007)]. Glucose is the principal precursor for GABA production in vivo although pyruvate and other amino acids also can act as precursors. GABA is formed in vivo by a metabolic pathway referred to as the GABA shunt. The shunt is a closed loop process with the dual purpose of producing and conserving the supply of GABA. The first step in the synthesis of GABA from tricarboxylic acid intermediates is the transamination of alpha ketoglutarate to glutamic acid by GABA-Transaminase (GABA-T). Glutamic acid is then decarboxylated to form GABA by glutamic acid decarboxylase (GAD). GAD appears only to be expressed in GABAergic cells. Two forms of GAD have been identified – GAD65 and GAD67. GABA is metabolised by GABA-T to form succinic semialdehyde in a process that results in the transfer of an amino group from GABA to alpha ketoglutarate thereby reforming glutamic acid.
GABA formed in this process is concentrated within synaptic vesicles by action of a vesicular neurotransmitter transporter (VGAT) and vesicle release at the pre-synaptic terminal occurs by calcium-dependent exocytosis although non-vesicular GABA release has also been demonstrated. After release into the synaptic cleft,
extracellular GABA is removed (and the GABA signal terminated) by re-uptake into neurons and uptake into glia by plasma-membrane GABA transporters. These transport systems are both temperature and ion dependent processes. The transporters are capable of bidirectional neurotransmitter transport. They have an absolute requirement for extracellular Na+ and an additional dependence on Cl- ions. The ability of the reuptake system to transport GABA against a concentration gradient had been demonstrated using synaptosomes. The driving force for this reuptake process is supplied by the movement of Na+ down its concentration gradient. GABA taken back up into the neuron is available for re-release but GABA taken up by glial cells is metabolised to succinic semialdehyde and cannot be resynthesised in this compartment due to lack of GAD. GABA is returned to the neuronal pool following transfer of glial glutamine and conversion by glutaminase to glutamate and re-entry to the GABA shunt.
In the neocortex, most GABA-containing neurons are local interneurons which vary according to morphology, intrinsic membrane properties and synaptic connectivity. GABA synapses are present in all neocortical layers and are observed most frequently on cell somata, proximal dendrites and axon initial segments but also on distal dendrites and dendritic spines.
1.2.7 GABA receptors
The actions of GABA are mediated through GABAA, GABAB and GABAC
receptors.
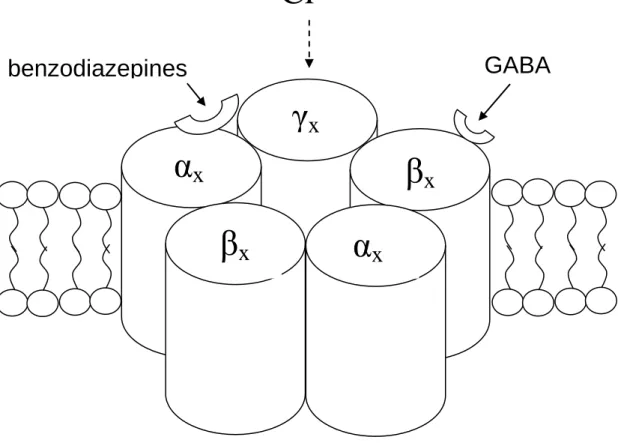
1.2.7.1 GABAA receptors
The GABAA receptor is a multi-subunit, heteromeric ion channel directly activated
by the transmitter, GABA. There are usually five subunits, although a minority may have four subunits only. The exact subunit composition determines the physiological and pharmacological properties of the receptor(Barnard et al., 1998). Ligand binding is followed by conformational change in the channel protein that allows a net inward or outward flow of ions through the membrane-spanning pore of the channel. The directionality of flow depends on the electrochemical gradient of the particular permanent ion. Most GABAA receptors carry primarily chloride ions and there is
to their response to GABA signalling consequent upon intracellular chloride concentrations. With maturation neuronal [Cl-] decreases and the GABAA reversal
potential becomes more negative allowing the effect of GABA to become progressively more inhibitory(Ben Ari, 2002). Consistent with this finding is the observation that cation-chloride co-transporters are expressed differentially in the cortex as development continues. In the embryonic brain a Na+-K+-Cl- co-transporter (NKCC1) is dominantly expressed and acts to increase intracellular Cl-, whilst with maturity an outwardly directed co-transporter (KCC2) plays an increased role. Consequently in immature brain tissue (and tissue demonstrating impaired neuronal development such as may be found in some types of malformations of cortical development) or within areas of epileptic tissue associated with structural reorganisation the response to GABA stimulation may not be inhibitory. This interaction between altered GABAergic signalling and the interneuron connectivity of GABA releasing neurons has been shown in hippocampal slices to support pathological synchronisation of aberrant discharges(Cohen et al., 2003).
Figure 1.2.1 Sub-unit stoichiometry, arrangement, membrane position and binding sites of the GABAA receptor
1.2.7.2 GABAB receptors
GABAB receptors are less numerous than GABAA receptors but are still widely
distributed in the brain. In contrast to GABAA receptors, they are metabotropic
(Sivilotti and Nistri, 1991) and are thought to have pre-synaptic locations where they impair release of both excitatory and inhibitory neurotransmitter from vesicles.
γ
x
β
x
β
x
α
x
α
x
Cl
-Extracellular, [Cl
-] 120 mmol/l
Intracellular, [Cl
-] 4 mmol/l
GABA
benzodiazepines
1.2.7.2 GABAC receptors
GABAC receptors are ionotropic and composed of ρ sub units (Cutting et al., 1991).
These subunits can form homo- or hetero-oligomeric channels with other ρ subunits but do not seem to combine with GABAA receptor subunits.
1.2.8 GABA and Epilepsy
It has long been known that enhancing central nervous system GABA levels with GABA transaminase inhibitors or succinic semi-aldehyde inhibitors has an anti-convulsant effect and also that lowering these levels produces seizures. In 1995 During and Spencer performed micro-dialysis experiments which demonstrated reduced GABA/glutamate ratios in the ictal temporal lobe(During and Spencer, 1993) and Petroff and co-workers have authored a number of MRS studies over several years that report low levels of GABA in patients with epilepsy(Petroff et al., 1996b;Petroff et al., 1999a;Petroff et al., 2000) and increasing GABA levels with improved seizure control or GABAergic antiepileptic medications such as topiramate or vigabatrin(Petroff et al., 1996a;Petroff et al., 1996b;Petroff et al., 1999c;Petroff et al., 2000).
Several antiepileptic drugs in widespread use have actions mediated by an alteration of the GABA receptor system. Post-synaptic GABAA receptor currents are enhanced
by barbiturates and benzodiazepines. Pre-synaptic GABA release is likely modified by the antiepileptic drug vigabatrin. The uptake of GABA has been shown to be modified by compounds such as tiagabine. Valproic acid has been suggested either to enhance the release of GABA or to enhance postsynaptic GABA responses whilst topiramate may increase GABA mediated Cl- influx.
This complex role of GABA in guiding brain development, regulating synchronous cell discharge and blocking excitatory pathways would indicate that simple reduction in GABA concentrations is probably an inadequate explanation for many epileptic disorders. However GABA metabolism is clearly extremely important to the regulation of cell signalling and the measurement of GABA levels in several epileptic disorders is one of the main aims of this thesis.
1.3 Idiopathic Generalised Epilepsies
1.3.1 Introduction
1.3.2 Pathophysiology of generalised spike wave discharges 1.3.3 Genetics of IGE
1.3.4 Pathology of IGE 1.3.5 Imaging of IGE
1.3.6 Idiopathic Generalised Epilepsy Sub-syndrome description 1.3.6.1 Childhood Absence Epilepsy
1.3.6.2 Juvenile Absence Epilepsy 1.3.6.3 Juvenile Myoclonic Epilepsy
1.3.6.4 Idiopathic Generalised Epilepsy with Generalised Tonic Clonic Seizures only
![Figure 1.7.5 1H MRS spectrum for GABA[from (Govindaraju et al., 2000)]](https://thumb-us.123doks.com/thumbv2/123dok_us/11094140.2996661/95.893.210.559.614.822/figure-h-mrs-spectrum-for-gaba-from-govindaraju.webp)
![Figure 1.7.6 1H MRS spectrum for myo-Inositol [from (Govindaraju et al., 2000)]](https://thumb-us.123doks.com/thumbv2/123dok_us/11094140.2996661/101.893.191.753.770.1035/figure-h-mrs-spectrum-myo-inositol-govindaraju-et.webp)