Heat Transfer in Horizontal Falling Film Evaporators
Authors: Paul Schausberger, Johannes Nowak, Otto Medek
Presenter: Paul Schausberger
Process Engineer – VA TECH WABAG – Austria
Abstract
Sound prediction of the thermal performance is essential for the optimum design of multi-effect evaporators. A wide range of empirical and theoretical correlations for the underlying heat transfer coefficients is available from literature. The correlation results scatter widely which makes it difficult to select a specific recipe. In this paper we review the latest findings at describing the heat transfer in horizontal tube falling film evaporators. The recipes available are analyzed with respect to (a) its validity and its response to operating conditions, (b) the influence of non-condensable gases and scaling layers and (c) its applicability for predictive tools. Furthermore the common neglect of spatial variations is discussed and an outlook is given to future research for better predictions.
Multi-effect seawater distillation (MED) is a technology successfully applied to quench the worlds increasing thirst for water. In 2007 approx. 20 % (1.34x10⁶ m³/day) of the globally contracted capacity has been allotted to this technology [1]. Although the quickly improving technology of Reverse Osmosis desalination (RO) is continuously increasing its market share, MED will remain the appropriate solution in many cases. Research, development and bundling of know-how is of vital importance to maintain and consolidate this position.
The horizontal falling film evaporator stage is the key element of any MED system. The most common technology is to disperse and partly evaporate seawater on a horizontal tube bundle. The heat necessary is supplied by steam condensing inside the tubes. The design of the heat exchange area, i.e. the tube bundle, is decisive for the plant efficiency and its capital and maintenance costs. The overall heat balance for the tube bundle is:
kW Ah tQ
Here we address the key variable in this equation, the overall heat transfer coefficient or its reciprocal respectively, the overall thermal resistance:
fouling o i t o t t o t i i t o t fouling o t i R d d d d d R R R R h kW K m R 1 ln 2 1 , , , , , 2
Many authors have been dealing with this topic as horizontal falling film evaporation is also applied in refrigeration systems. El-Dessouky & Ettouney [2] reviewed correlations available for the overall heat transfer coefficient in seawater evaporators. They found the predicted values to vary between 2 and 4 kW/m²/K. These overall correlations obviously are strong simplifications and most authors choose to investigate the part mechanisms. Uche et al. [3] and Trostmann [4] published reviews of selected recipes and compared its results.
In this paper we join this discussion. The approaches available to access the different resistance contributions are reviewed for its applicability and range of validity. A conclusion is given on better prediction and improved insight in the future.
II. HEAT TRANSFER TUBE INSIDE
Steam enters the tubes and condenses releasing its heat of vaporization. The pattern of the resulting two-phase flow as shown in Figure 1 depends on the operating conditions, the tube geometry and the
steam/condensate physical properties. This pattern is of great importance to heat transfer considerations as the condensate layer yields the main thermal resistance.
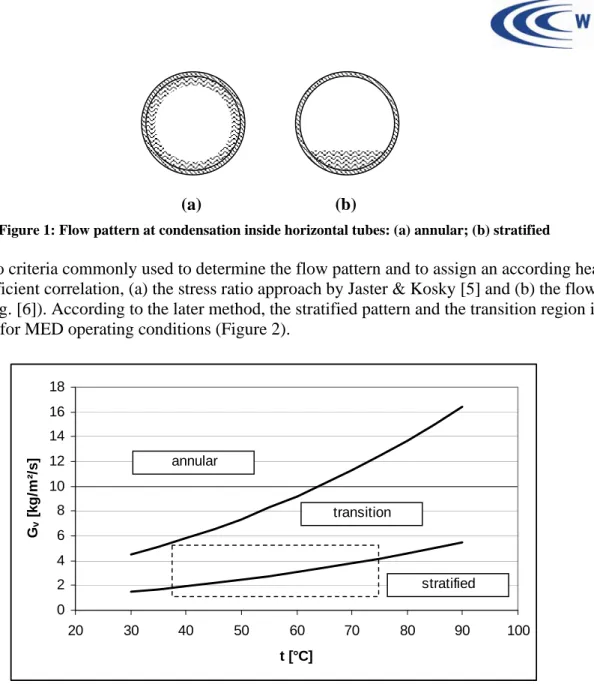
(a) (b)
Figure 1: Flow pattern at condensation inside horizontal tubes: (a) annular; (b) stratified
There are two criteria commonly used to determine the flow pattern and to assign an according heat transfer coefficient correlation, (a) the stress ratio approach by Jaster & Kosky [5] and (b) the flow map by Breber (e.g. [6]). According to the later method, the stratified pattern and the transition region is predominant for MED operating conditions (Figure 2).
0 2 4 6 8 10 12 14 16 18 20 30 40 50 60 70 80 90 100 t [°C] Gv [k g /m ²/ s ] annular stratified transition
Figure 2: Flow pattern at condensation dependant on operating conditions (dt = 0.03m), dashed box … typical MED
conditions
There is broad agreement in literature on the description of the heat transfer coefficient for the stratified pattern (e.g. [5-7]). Here the heat is assumed to be transferred only through the perimeter not covered by condensate.
0.25 , 3 3 725 . 0 t d h g kgK W i t l v v l l l i Differing recipes and guidelines can be found for the transition region. Jaster & Kosky [5] propose a linear combination of the stratified and an annular model. Kovac & Liu [6] state that annular models should be used in any case as the stratified models tend to underpredict the heat transfer. Bourouni et al.
[8] and El-Dessouky & Ettouney [2] seem to adopt the same strategy. However we find that heat transfer coefficients from annular models can be substantially lower than those from stratified models as the increasing condensate annulus poses increasing resistance to the heat flux.
III. HEAT TRANSFER TUBE OUTSIDE
Seawater is dispersed onto the tube bundle by liquid feeders (spray nozzles, perforated plates…). The liquid is then falling from one tube to the next lower one. The flow pattern of this falling film as shown in Figure 3 mainly depends on the flow rate, the tube spacing, and the physical properties of the liquid [9]. No defined criterion for the transition of the film hydrodynamic flow regime exists.
Figure 3: The idealized inter-tube falling-film modes: (a) the droplet mode; (b) the jet mode; (c) the sheet mode
Table 1 shows approximate ranges for the film Reynolds number with respect to the flow pattern, the hydrodynamic regime.
Scenarios Re Flow pattern (a) (b) [9] 150-200
Flow pattern (b) (c) [9] 315-600 Flow regime laminar turbulent [9] 1000-2000
Typical MED conditions 500-2000
Table 1: Reynolds number ranges for falling films
Another criterion for the description of heat transfer is the prevailing heat transfer mechanism, nucleate boiling in the film or surface (film) evaporation. The favored type in desalination is the latter one as nucleate boiling can lead to dry or superheated spots on the tube - conditions known to trigger scaling. No criterion could be found for the transition of the two mechanisms; generally spoken high heat flux and high temperature difference favors nucleate boiling.
Ribatski & Jacobi [10] published a ‘critical review’ on falling film evaporation on horizontal tubes where they listed the empirical correlations (based on dimensionless numbers) and more comprehensive models available for calculation of the heat transfer. They concluded that all recipes available were strongly dependent on specific operating conditions under which they had been developed, and great care had to be exercised in trying to generalize such relations.
Owens [11] proposed correlations for the evaporation heat transfer coefficients for laminar and turbulent films at boiling and non-boiling conditions. Although the study was based on ammonia evaporation, the correlations have been widely used to for seawater evaporator modeling ([4],[8],[12]).
IV. FOULING RESISTANCE
Fouling is the deposition of unwanted material on equipment surface. In MED evaporators this phenomenon mainly affects the tube outside. As the seawater temperature and salinity increase on its way through the tube bundle the solubility limit of some minerals are exceeded and a scale layer is formed on the tube surface. At normal operation, i.e. standard seawater containing low amounts of particles and organic material, only the CaCO3 solubility product is exceeded and the corresponding precipitation occurs. This phenomenon can be controlled by antiscale measures. At certain unfavorable conditions - bubbling due to nucleate boiling or biomass present – CaSO4 may coprecipitate which leads to very tenacious mixed layers [13].
The detailed prediction of these phenomena is impossible at current stage. Whereas the solubility limit of the single mineral can be calculated it is still impossible to predict this point for mixed scales in the present multi-component system [14]. Likewise there are no practical recipes available to calculate the precipitation kinetics and the fouling resistance of the scale layer.
Höfling et al. [15] published experimental data on the scaling behavior and the thermal resistance of CaCO3, CaSO4 and mixed scale layers at different pH values. Most authors simply choose to estimate a constant value for the fouling resistance (e.g. 0.08 .. 0.15 m²K/kW in [2]).
V. IMPACT OF NON-CONDENSABLE GASES (NCG)
Non-condensable gases present in the evaporator system are widely believed to impede the evaporator heat transfer. The main concern is that a gas film accumulating at the inside tube surface (a) decreases heat transfer due to additional resistance, (b) reduces the temperature at which steam condenses at the given pressure due to the reduced partial pressure of vapor [2].
These gases origin from two sources: (a) degassing of the seawater and (b) air leakage. The latter is hardly accessible as it obviously depends on the manufacturing quality and estimates have to be used. Differently the release of gases from the seawater - O2, N2 and mainly CO2 - has been addressed in literature and models exist to describe this phenomenon (e.g. [16]).
Semiat & Galperin [17] studied the influence of NCG on heat transfer in a tower MED seawater desalination plant. They showed that 1 w% NCG can decrease the heat transfer coefficient by 10 %. Differently, Wu & Vierow [18] concluded in their study that an air fraction up to 20 w% in air/steam mixtures did impede the overall heat transfer rate of a condenser tube only in a minor way. Admittedly their experiments were performed at elevated Reynolds numbers which probably diminished the accumulation of NCG at the tube interface by turbulence.
The following estimation shall help to discuss the still debated influence of NCG on heat transfer. Based on figures published by Al-Rawajfeh et al. [19] we estimate the fraction of CO2 in the flash vapour to be 50 wppm. Dependant on the evacuation scheme NCG are accumulating downstream the evaporator. This may lead to NCG fractions higher than 1 w% in the second or third pass of downstream effects in large systems.
For proper inclusion of this phenomenon in the heat transfer calculation the mass transfer inside the tubes needs to be accounted for (e.g. [20]). To avoid this complex procedure Trostmann [4] proposed the introduction of a correction factor.
VI. SPATIAL RESOLUTION AND DESIGN TOOLS
Most of the computational tools used for the design of thermal desalination processes (e.g. [4],[21-22]) use lumped models for the single evaporator stage, i.e. the spatial variations of the system variables are either neglected or approximated by mean values. Spatial discretisation seems not to be conformable with a practicable and robust design tool at the moment.
The main uncertainties associated with this simplification are as follows: firstly, the Reynolds number of the seawater film decreases downstream the tube bundle (33% at CF = 1.5). This can lead to a changing flow regime around the tubes and an according change in the local heat transfer. Secondly, the temperature difference tube inside/outside can vary up to 1°C due to the pressure loss inside the tube and the boiling point elevation on the outside. The higher the number of effects, the greater the according impact on the estimated heat transfer area.
VII. SUMMARY AND CONCLUSION
The heat and mass transfer at horizontal falling film evaporation of seawater is shown to comprise highly complex physical and chemical phenomena. Accordingly its prediction for design purposes is a challenge and many questions still need to be answered.
At condensation inside the tube the condensate forms an annulus or a stratified layer. Whereas the hydrodynamic transition seems to be predictable the methods for calculation of the corresponding heat transfer coefficient remain disputed. The values predicted for the length averaged heat transfer coefficient i lie in the range from 8 to 25 kW/m²/K.
0.0 0.1 0.2 0.3 0.4 0.5 0.6 0.7
tube inside tube outside tube* fouling total
R [m ²K /k W ] min max
Figure 4: Min/max range for the thermal resistances (*25x0.5 mm tubes)
On the tube outside the seawater forms a falling film between and around the tubes. The hydrodynamics of this film, i.e. the flow pattern and the flow regime around, are not yet clearly accessible. Calculation recipes on base of dimensionless numbers seem not to be applicable for differing fluids. The values predicted for the bundle mean heat transfer coefficient o lie in the range from 3 to 8 kW/m²/K.
Figure 4 shows the collected thermal resistances to be accounted for. Obviously the phenomena occurring at tube outside produce the main resistance to heat transfer. The impact of the tube itself is negligible. The maximum fouling resistance constitutes 20% of the overall resistance, more than the tube inside. An overall heat transfer coefficient h of up to 6 kW/m²/K could be possible for clean tubes. What can be concluded from this analysis:
The falling film and its part in heat transfer is clearly the system bottleneck. Efforts have to be made to better understand and design this flow form; the spray density (mass flow per tube length) seems to be the key variable.
Progress in tube material thermal conductivity will not increase the thermal performance of the system. In contrast new materials could reduce scale adhesion leading to lower fouling resistances.
The fouling resistance is the safety margin in evaporator design. Bringing down this margin from the present levels used in the industry could decrease the evaporator heat transfer areas by 10-20 %. One solution is proper raw water quality control by intelligent intake design or pretreatment – combined with antiscale dosage of course. This way a practically non-scaling operation could be feasible.
Care must be taken when using lumped models for prediction of the heat transfer. Imprecise description of the characteristic conditions (temperatures, mass flows…) can cause severe misestimations.
The assessment of heat transfer coefficients achievable and the corresponding design of multi-effect evaporators is strongly dependant on company know-how and experience. This situation will not change in the near future. The main tools to gain better insight to the physics of this system will be well designed empiric tests and data correlation and comparison. The quickly improving techniques of computational fluid dynamics (CFD) could bring additional light to the complex flow forms occurring and hence support the quest for optimum heat transfer.
SYMBOLS A Area m² CF Concentration Factor - d Diameter m g Gravitational acceleration m/s² G Mass velocity kg/m²/s
h Overall heat transfer coefficient kW/m²K
h Heat of vaporisation
Q Heat flow kW
R Thermal resistance m²K/kW
Re Reynolds number
t Temperature K, °C
Heat transfer coefficient kW/m²K
Void fraction m³/m³
Thermal conductivity kW/mK
Dynamic viscosity Pas
Mass density kg/m³ Indices i inside l liquid o outside t tube v vapor
REFERENCES
1. IDA Desalination Yearbook 2008-2009
2. El-Dessouky, H. & Ettouney, H. M.: Fundamentals of Salt Water Desalination, Elsevier, 2002 3. Uche, J.; Artal, J. & Serra, L.: Comparison of heat transfer coefficient correlations for thermal
desalination units, Desalination, 2003, 152, 195-200
4. Trostmann, A.: Improved Approach to Steady State Simulation of Multi-Effect Distillation Plants, Proceedings of the 5th EuroMed Conference, Dead Sea, Jordan, 2008
5. Jaster, H. & Kosky, P. G.: Condensation heat transfer in a mixed flow regime, International Journal of Heat and Mass Transfer, 1976, 19, 95-99
6. Kakaç, S. & Liu, H. (ed.): Heat Exchangers, CRC Press, 1998
7. Arzt, B.: Meerwasserentsalzung durch Mehrfach-Effekt-Stack Horizontalrohrverdampfung, RWTH Aachen, 1984
8. Bourouni, K.; Martin, R.; Tadrist, L. & Tadrist, H.: Modelling of heat and mass transfer in a horizontal-tube falling-film evaporator for water desalination, Desalination, 1998, 116, 165-183 9. Kocamustafaogullari, G. & Chen, I. Y.: Falling film heat transfer analysis on a bank of horizontal
tube evaporator, AIChE Journal, 1988, 34, 1539-1549
10.Ribatski, G. & Jacobi, A.: M. Falling-film evaporation on horizontal tubes--a critical review, International Journal of Refrigeration, 2005, 28, 635-653
11.Owens, W.: Correlation of Thin Film Evaporation Heat Transfer Coefficients for Horizontal Tubes, Proceedings of the 5th Ocean Thermal Energy Conversion Conference, 1978, 6, 71-89
12.Al-Hawaj, O. L.: A study and comparison of plate and tubular evaporators, Desalination, 1999, 125, 233-242
13.Bramson, D.; Hasson, D. & Semiat, R.: The roles of gas bubbling, wall crystallization and particulate deposition in CaSO4 scale formation, Desalination, 1995, 100, 105-113
14.Schausberger, P.; Mustafa, G. M.; Leslie, G. & Friedl, A.: Scaling prediction based on
thermodynamic equilibrium calculation - scopes and limitations, Desalination, 2009, 244. 31-47 15.Höfling, V.; Augustin, W. & Bohnet, M.: Crystallization Fouling of the Aqueous Two-Component
System CaSO4/CaCO3, Heat Exchanger Fouling and Cleaning: Fundamentals and Applications, 2004, 7
16.Glade, H. & Al-Rawajfeh, A. E.: Modeling of CO2 release and the carbonate system in multiple-effect distillers, Desalination, 2008, 222, 605-625
17.Semiat, R. & Galperin, Y.: Effect of non-condensable gases on heat transfer in the tower MED seawater desalination plant, Desalination, 2001, 140, 27-46
18.Wu, T. & Vierow, K.: Local heat transfer measurements of steam/air mixtures in horizontal condenser tubes, International Journal of Heat and Mass Transfer, 2006, 49, 2491-2501
19.Al-Rawajfeh, A. E.; Glade, H.; Qiblawey, H. M. & Ulrich, J.: Simulation of CO2 release in multiple-effect distillers, Desalination, 2004, 166, 41-52
20.VDI Wärmeatlas, 10th Ed., Springer, 2006
21.Schausberger, P.; Rheina-Wolbeck, G.; Friedl, A.; Harasek, M. & Perz, E.: Enhancement of an object-oriented power plant simulator by seawater desalination topics, Desalination, 2003, 156, 355-360
22.Ettouney, H.: Visual basic computer package for thermal and membrane desalination processes, Desalination, 2004, 165, 393-408