Investigating the Performance of Selected Weka Classifiers for
Knowledge Discovery in Mining Educational Data
Ayinde A.Q1 Adetunji A.B 2
1. Computer Science Department, Osun State College of Technology, Esa-Oke, 234035/South West, Nigeria 2. Computer Science and Engineering Department, Ladoke Akintola University of Technology,
Ogbomoso,/South West, Nigeria Abstract
In the analyzed students’ educational data several parameters such as True Postive Rate, False Positive Rate and Classification Error were used as a yard stick in measuring the performance of both Kstar and BayeNet algorithms in mining the educational data. The performance investigation of the applied classifiers revealed hidden knowledge in the data set which was helpful in the re-calibration of the model to yield a higher precision of each of the classifier with minimal classification error.
Keywords: Data Mining, Educational Data Mining, Knowledge Discovery, Student, Classifiers, Performance, Investigation.
1.0 INTRODUCTION
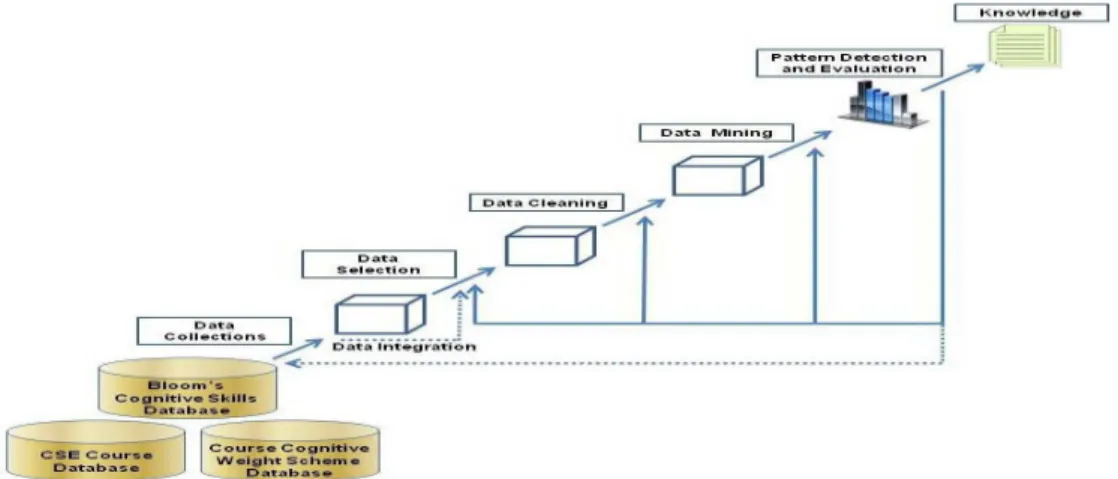
The data mining has attracted a great deal of attention in the information technology industry, due to availability of large volume of data which is stored in various formats like files, texts, records, images, sounds, videos, scientific data and many new data formats. There is imminent need for turning such huge data into meaningful information and knowledge. The data collected from various applications require a proper data mining technique to extract the knowledge from large repositories for decision making. Data mining, also called Knowledge Discovery in Databases (KDD), is the field of discovering novel and potentially useful information from large volume of data[1].Data mining and knowledge discovery in databases are treated as synonyms, but data mining is actually a step in the process of knowledge discovery. The sequences of steps indentified in extracting knowledge from data are shown in Figure 1.The main functionality of data mining techniques is applying various methods and algorithms in order to discover and extract patterns of stored data. These interesting patterns are presented to the user and may be stored as new knowledge in knowledge base. Data mining and knowledge discovery applications have got a rich focus due to its significance in decision making. Data mining has been used in areas such as database systems, data warehousing, statistics, machine learning, data visualization, and information retrieval. Data mining techniques have been introduced to new areas including neural networks, patterns recognition, spatial data analysis, image databases and many application fields such as business, economics and bioinformatics. The main objective of this paper is to investigate the performance of KStar and BayesNet algorithms in analyzing students’ educational data in Department of Computer Science, Osun State College of Technology (OSCOTECH), Esa Oke, Osun State, Nigeria.
2.0 REVIEW OF RELATED WORK
The educational data mining community [2] defines educational data mining as, “Educational Data Mining (EDM) is an emerging discipline, concerned with developing methods for exploring the unique types of data that come from educational settings, and using those methods to better understand students, and the setting which they learn in”. There are increasing research interests in using data mining techniques in educational filed. This new emerging field, EDM, concerns with developing methods that discover knowledge from data
originating from educational environments. Educational data mining techniques often differ from traditional data mining techniques, in explicitly exploiting the multiple levels of meaningful hierarchy in educational data. EDM focuses on collection, archiving, and analysis of data related to students’ learning and assessment. The analysis performed in EDM research is often related to techniques drawn from variety of literatures [3], including psychometrics, machine learning, data mining, educational statistics, information visualization and computational modelling. Reviews pertaining to not only the diverse factors like personal, socio-economic, psychological and other environmental variables that influence the performance of students but also the models that have been used for the performance prediction are available in the literature and a few specific studies are listed below for reference. Walters and Soyibo [4] conducted a study to determine Jamaican high school students' (population n=305) level of performance on five integrated science process skills with performance linked to gender, grade level, school location, school type, student type, and socio-economic background (SEB). The results revealed that there was a positive significant relationship between academic performance of the student and the nature of the school. Khan [5] conducted a performance study on 400 students comprising 200 boys and 200 girls selected from the senior secondary school of Aligarh Muslim University, Aligarh, India with a main objective to establish the prognostic value of different measures of
cognition, personality and demographic variables for success at higher secondary level in science stream. The selection was based on cluster sampling technique in which the entire population of interest was divided into groups, or clusters, and a random sample of these clusters was selected for further analyses. It was found that girls with high socio-economic status had relatively higher academic achievement in science stream and boys with low socio-economic status had relatively higher academic achievement in general. Hijazi and Naqvi [6] conducted as study on the student performance by selecting a sample of 300 students (225 males, 75 females) from a group of colleges affiliated to Punjab university of Pakistan. The hypothesis that was stated as "Student's attitude towards attendance in class, hours spent in study on daily basis after college, students' family income, students' mother's age and mother's education are significantly related with student performance" was framed. By means of simple linear regression analysis, it was found that the factors like Bayesian Nets, Instance-Based Learning and Rule-learning to predict the performance of computer science students from distance learning stream of Hellenic Open University, Greece. A total of 365 student records comprising several demographic variables like sex, age and marital status were used. In addition, the performance attribute namely mark in a given assignment was used as input to a binary (pass/fail) classifier. Filter based variable selection technique was used to select highly influencing variables and all the above five classification models were constructed. It was noticed that the Naïve-Bayes algorithm yielded high predictive accuracy (74%) for two-class (pass/fail) dataset. Al-Radaideh, et al. [13] applied a decision tree model to predict the final grade of students who studied the C++ course in Yarmouk University, Jordan in the year 2005. They used 12 predictive variables and a 4-class response variable for the model construction. Three different classification methods namely ID3, C4.5, and the Naïve Bayes were used. The outcome of their results indicated that Decision Tree model had better prediction than other models with the predictive accuracy of 38.33% for four class response variable. Cortez and Silva [9] attempted to predict failure in the two core classes (Mathematics and Portuguese) of two secondary school students from the Alentejo region of Portugal by utilizing 29 predictive variables. Four data mining algorithms such as Decision Tree (DT), Random Forest (RF), Neural Network (NN) and Support Vector Machine (SVM) were applied on a data set of 788 students, who appeared in 2006 examination. It was reported that DT and NN algorithms had the predictive accuracy of 93% and 91% for two-class dataset (pass/fail) respectively. It was also reported that both DT and NN algorithms had the predictive accuracy of 72% for a four class dataset. From these specific studies, we observed that the student performance could depend on diversified factors such as demographic, academic, psychological, socio-economic and other environmental factors. Mother’s education and student’s family income were highly correlated with the student academic performance. Kristjansson, Sigfusdottir and Allegrante [10] made a study to estimate the relationship between health behaviors, body mass index (BMI), self-esteem and the academic achievement of adolescents. The authors analyzed survey data related to 6,346 adolescents in Iceland and it was found that the factors like lower BMI, physical activity, and good dietary habits were well associated with higher academic achievement. Moriana et al. [11] studied the possible influence of extracurricular activities like study-related (tutoring or private classes, computers) and/or sports-related (indoor and outdoor games) on the academic performance of the secondary school students in Spain. A total number of 222 students from 12 different schools were the samples and they were categorized into two groups as a function of student activities (both sports and academic) outside the school day. Analysis of variance (ANOVA) was used to verify the effect of extracurricular activities on the academic performance and it was observed that group involved in activities outside the school yielded better academic performance. Bray [12], in his study on private tutoring and its implications, observed that the percentage of students receiving private tutoring in India was relatively higher than in Malaysia, Singapore, Japan, China and Srilanka. It was also observed that there was an enhancement of academic performance with the intensity of private tutoring and this variation of intensity of private tutoring depends on the collective factor namely socio-economic conditions. Modelling of student performance at various levels is discussed in [10], [11], and [12]. Ma, Liu, Wong, Yu, and Lee [4] applied a data mining technique based on association rules to find weak tertiary school students (n= 264) of Singapore for remedial classes. Three scoring measures namely Scoring Based on Associations (SBA score), C4.5-score and NB-score for evaluating the prediction in connection with the selection of the students for remedial classes were used with the input variables like sex, region and school performance over the past years. It was found that the predictive accuracy of SBA-score methodology was 20% higher than that of C4.5 score, NB score methods and traditional method. Kotsiantis, et al. [8] applied five classification algorithms namely Decision Trees, Perception-based Learning, Bayesian Nets, Instance-Based Learning and Rule-learning to predict the performance of computer science students from distance learning stream of Hellenic Open University, Greece. A total of 365 student records comprising several demographic variables like sex, age and marital status were used. In addition, the performance attribute namely mark in a given assignment was used as input to a binary (pass/fail) classifier. Filter based variable selection technique was used to select highly influencing variables and all the above five classification models were constructed. It was noticed that the Naïve-Bayes
students who studied the C++ course in Yarmouk University, Jordan in the year 2005. They used 12 predictive variables and a 4-class response variable for the model construction. Three different classification methods namely ID3, C4.5, and the Naïve Bayes were used. The outcome of their results indicated that Decision Tree model had better prediction than other models with the predictive accuracy of 38.33% for four class response variable. Cortez and Silva [9] attempted to predict failure in the two core classes (Mathematics and Portuguese) of two secondary school students from the Alentejo region of Portugal by utilizing 29 predictive variables. Four data mining algorithms such as Decision Tree (DT), Random Forest (RF), Neural Network (NN) and Support Vector Machine (SVM) were applied on a data set of 788 students, who appeared in 2006 examination. It was reported that DT and NN algorithms had the predictive accuracy of 93% and 91% for two-class dataset (pass/fail) respectively. It was also reported that both DT and NN algorithms had the predictive accuracy of 72% for a four class dataset. From these specific studies, we observed that the student performance could depend on diversified factors such as demographic, academic, psychological, socio-economic and other environmental factors.
3.0 METHODOLOGY
The data mining research was based on the modified CRISP-DM (Cross-Industry Standard Process for Data Mining) research approach. The open source software tool WEKA (Knowledge Flow Interface) was used for the research implementation. During the Business
Understanding Phase the specific college management needs are identified. In the Data Understanding Phase the students ‘educational results from ND I to HND II with their corresponding bio data were collected for observation. A verification driven was conducted on the raw data collected to identify some hidden pattern in the data set. During the DataPreprocessing Phase, student data collected from the Department of Computer Science at Osun State College of Technology, Esa- Oke, Osun State, Nigeria, were organized in a new data mart. The research sample includes data about 1350students, described by 10 parameters (gender, age, mode of admission (MOA), religion, pre- degree score, student matriculation number, state of origin, ND II CGPA, HND II CGPA and student grade. The provided data is subjected to many transformations –removing parameters that are considered useless (e.g. fields with one value only), replacing fields containing free text with nominal variable (with a number of distinct values), transforming numeric to nominal variables, etc. The data is also being studied for missing values (very few and not important), and obvious mistakes (corrected).The data mining task is to perform an investigation on the performance of the applied classifiers in mining the students’ educational data collected for seven years (2001 – 2004). The target variable was the “student class”, it was constructed as a categorical variable, based on the numeric values of the “student total college score’’ attribute which has five distinct values - “Distinction” (4.00-5.00), “ Upper Credit Division” (3.00-3.99), “ Lower Credit Division” (2.5-2.99), and “Pass Division”(1.50- 2.48.). The dataset contains 1350 instances (15 classified as Distinction, 502 classified as Upper Division, 782 classified as Lower Credit Division and 351 classified as Pass), each described with 10attributes (1 output and 9 input variables), nominal ,numeric and categorical. This dataset classification was based on self verification driven for the students’ data set collected for four years. During the Modeling Phase, two different classification algorithms are selected and applied. Popular WEKA classifiers (with their default settings unless specified otherwise) are used, including a common Kstar and BayesNet. The model was calibrated to yield the optimal result for the applied classifiers.
4.0 FIGURE and TABLES
Table1: Performance evaluation of the classifiers for 2001 students’ educational result Distinction KStar BayesNet Upper Credit KStar BayesNet Lower Credit Kstar BayesNet Pass KStar BayesNet TP Rate 0.856 0.976 0.845 0.812 0.981 0.874 0.875 0.912 FP Rate 0.476 0.765 0.674 0.832 0.762 0.432 0.645 0.874 CE 0.132 0.213 0.312 0.173 0.123 0.145 0.321 0.143 TP Rate: True Positive Rate FP Rate: False Positive Rate CE: Classification Error
Table 2: Performance evaluation of the classifiers for 2002 students’ educational result Distinction KStar BayesNet Upper Credit KStar BayesNet Lower Credit Kstar BayesNet Pass KStar BayesNet TP Rate 0.956 0.876 0.882 0.799 0.801 0.964 0.975 0.876 FP Rate 0.686 0.965 0.874 0.932 0.662 0.232 0.453 0.763 CE 0.234 0.116 0.217 0.273 0.223 0.245 0.118 0.101 TP Rate: True Positive Rate FP Rate: False Positive Rate CE: Classification Error
Table 3: Performance evaluation of the classifiers for 2003 students’ educational result Distinction KStar BayesNet Upper Credit KStar BayesNet Lower Credit Kstar BayesNet Pass KStar BayesNet TP Rate 0.912 0.815 0.815 0.799 0.808 0.869 0.817 0.992 FP Rate 0.489 0.867 0.774 0.835 0.767 0.638 0.855 0.763 CE 0.234 0.116 0.117 0.273 0.113 0.115 0.318 0.108 TP Rate: True Positive Rate FP Rate: False Positive Rate CE: Classification Error
Table 4: Performance evaluation of the classifiers for 2004 students’ educational result Distinction KStar BayesNet Upper Credit KStar BayesNet Lower Credit Kstar BayesNet Pass KStar BayesNet TP Rate 0.988 0.987 0.905 0.809 0.909 0.871 0.987 0.882 FP Rate 0.887 0.677 0.774 0.535 0.666 0.538 0.855 0.763 CE 0.134 0.116 0.117 0.173 0.113 0.321 0.113 0.213 TP Rate: True Positive Rate FP Rate: False Positive Rate CE: Classification Error
4. RESULTS AND DISCUSSIONS
The WEKA Knowledge flow application was used at this stage. Each classifier was applied for two testing options – cross validation (using 10 folds) and percentage split (2/3 of the dataset used for training and 1/3 – for testing). The results for the overall accuracy of the applied classifiers, including True Positive Rate and Classification Error (the average values for the 10-fold cross validation and split options) are presented in Table I to Table 4. The results for the classifiers’ performance on the four classes are presented on Table 1 to Table 4.The achieved results revealed that KStar performs best because it was able to predict for all the grades with higher precision of 92 percent on the average with lower classification error of 15 percent on the average for the period of four years that the data was collected. BayesNet was able to predict for all the classes of grade with a precision 88percent on the average with classification error of 21percent on the average. Kstar out performs BayesNet simply because it supports incremental learning which make it easier for the model to be calibrated to support batch training and incremental training. BayesNet can only train 300data set at once compared to KStar that can train more than 700data set at once according to the calibration of the predictive model used in this research work.
5. CONCLUSION
Despite the inability of BayesNet to support incremental learning we were able to achieved lower classification error by proper transformation of the data set, data pre-processing and proper calibration of the FoldMaker. Further research efforts will be directed at achieving lower classification error by comparing two or more incremental learning classifiers in mining the students’ educational data. More pre-defined verification driven must be considered in data transformation and data pre-processing to achieve higher precision of the applied classifiers and lower classification error.
Discovery in Databases”, American Association for Artificial Intelligence, pp. 37-54, 1997.
[2] Baker R.S.J.D., “Data Mining For Education. In International Encyclopedia of Education (3rd edition)”, B.MCGAW, PETERSON, P., BAKER Ed. Elsevier, Oxford, UK, 2009.Forman, G. 2003. An extensive empiricalstudy of feature selection metrics for text classification. J. Mach. Learn. Res. 3, pp. 1289-1305, 2003. [3] www.educationaldatamining.org.
[4] Y. B. Walters, and K. Soyibo, “An Analysis of High School Students' Performance on Five Integrated Science Process Skills”, Research in Science & Technical Education, Vol. 19, No. 2, 2001, pp.133 – 145. [5] Z. N. Khan, “Scholastic Achievement of Higher Secondary Students in Science Stream”, Journal of Social Sciences, Vol. 1, No. 2, 2005, pp. 84-87.
[6] S. T. Hijazi, and R. S. M. M. Naqvi, “Factors Affecting Student’s Performance: A Case of Private Colleges”, Bangladesh e-Journal of Sociology, Vol. 3, No. 1, 2006.
[7] Y. Ma, B. Liu, C.K. Wong, P.S. Yu, and S.M. Lee, “Targeting the Right Students Using Data Mining”,Proceedings of KDD, International Conference on Knowledge discovery and Data Mining, Boston, USA, 2000, pp. 457-464.
[8] S. Kotsiantis, C. Pierrakeas, and P. Pintelas, “Prediction of Student’s Performance in Distance Learning Using Machine Learning Techniques”, Applied Artificial Intelligence, Vol. 18, No. 5, 2004, pp. 411-426. [9] P. Cortez, and A. Silva, “Using Data Mining To Predict Secondary School Student Performance”, In EUROSIS, A. Brito and J. Teixeira (Eds.), 2008, pp.5-12.
[10] A. L. Kristjansson, I. G. Sigfusdottir, and J. P. Allegrante, “Health Behavior and Academic Achievement Among Adolescents: The Relative Contribution of Dietary Habits, Physical Activity, Body Mass Index, and Self-Esteem”, Health Education & Behavior, (In Press).
[11] J. A. Moriana, F. Alos, R. Alcala, M. J. Pino, J. Herruzo, and R. Ruiz, “Extra Curricular Activities and Academic Performance in Secondary Students”, Electronic Journal of Research in Educational Psychology,Vol. 4, No. 1, 2006, pp. 35-46.
[12] M. Bray, The Shadow Education System: Private Tutoring And Its Implications For Planners, (2nd ed.), UNESCO, PARIS, France, 2007.
[13] Q. A. AI-Radaideh, E. M. AI-Shawakfa, and M. I. AI-Najjar, “Mining Student Data using Decision Trees”, International Arab Conference on Information Technology (ACIT'2006), Yarmouk University, Jordan, 2006