Investigating N-glycosylation sites in
follicular lymphoma surface
immunoglobulin and their role in
lymphoma initiation
Mariette Odabashian
Submitted in partial fulfilment of the requirements of the
Degree of Doctor of Philosophy
March 2019
Centre for Haemato-Oncology
Barts Cancer Institute, London, UK
2
Abstract
Follicular lymphoma (FL) is an incurable indolent non-Hodgkin’s lymphoma that is both biologically and clinically heterogeneous. Despite the loss of one immunoglobulin allele through the t14;18 translocation and ongoing somatic hypermutation (SHM) of the immunoglobulin heavy chain variable region genes (IGHV), all detectable tumour subclones retain functional expression of the surface immunoglobulin throughout disease, resulting in thousands of tumour subclones displaying distinct but clonally related IGHV sequences. This retention suggests a tumour dependence on signalling through the B cell receptor (BCR). >90% of FL cases contain N-glycosylation (N-gly) motifs in their IGHV which are acquired through SHM. Motifs are rarely found in normal somatically mutated B cells, indicative of a pathogenic function. Mannoses attach to motifs and activate BCR signalling pathways following engagement with lectins DC-SIGN and MR, expressed by microenvironmental immune cells. This novel interaction could represent a critical mechanism by which tumour cells survive in the hostile microenvironment.
Utilising a next-generation sequencing approach, we determined using temporal tumour samples from a diverse group of patients the behaviour of N-gly motifs during tumour evolution and progression to elucidate their importance in lymphomagenesis. Remarkably, we observed conservation of N-gly motif sites in >97% of subclone populations within and across disease events of all patients, inferring motifs are an early and stable event of pathogenesis. Rare motif negative subclones were presumably lost or negligible from successive events in contrast to motif positive subclones that were able to migrate between anatomical sites. This positive selection suggests an ongoing reliance of N-gly sites during disease progression, despite the changing genomic landscape of tumour clones.
Interrogation of the microenvironmental landscape through novel, multiplex phenotyping analysis provided new insight into DC-SIGN and MR expression on immune cells of healthy and FL derived lymph nodes. A greater population of follicular dendritic cells, macrophages and M2 macrophages within tumour lymph nodes expressed a MR+ and DCSIGN+MR+ phenotype, indicating a remodelling of the microenvironment in disease that could be contributed by the lectin interaction. Targeting motifs or the inferred mannose-lectin interaction may lead to therapeutic benefit.
3
Statement of originality
I, Mariette Odabashian, confirm that the research included within this thesis is my own work or that where it has been carried out in collaboration with, or supported by others, that this is duly acknowledged below and my contribution indicated. Previously published material is also acknowledged below.
I attest that I have exercised reasonable care to ensure that the work is original, and does not to the best of my knowledge break any UK law, infringe any third party’s copyright or other Intellectual Property Right, or contain any confidential material.
I accept that the College has the right to use plagiarism detection software to check the electronic version of the thesis.
I confirm that this thesis has not been previously submitted for the award of a degree by this or any other university.
The copyright of this thesis rests with the author and no quotation from it or information derived from it may be published without the prior written consent of the author.
Signature:
Date: 06/03/2019
4
Contents
Abstract ... 2 Statement of originality ... 3 Acknowledgements ... 8 Dedication... 9 Publications ... 10 List of Figures ... 11 List of Tables ... 14 Chapter 1: INTRODUCTION ... 17 1.1 Disease overview ... 171.2 Clinical presentation and diagnosis ... 18
1.3 Staging and prognostic indicators ... 19
1.4 Management strategies ... 21
1.4.1 Initial treatment of early stage FL ... 22
1.4.2 Initial treatment of advanced stage FL ... 22
1.4.3 Treatment of relapsed FL ... 24
1.4.4 Novel therapeutics ... 25
1.5 FL variants ... 26
1.6 Transformation ... 28
1.7 B cell development ... 30
1.7.1 Immunoglobulin structure and formation ... 30
1.7.2 Immunoglobulin diversification ... 34
1.7.3 B cell receptor signalling ... 36
1.8 Immune cells of the germinal centre ... 38
1.9 Early events in FL pathogenesis ... 38
1.9.1 t14;18 translocation ... 39
1.9.2 t14;18 translocation insufficient for lymphomagenesis ... 39
1.9.3 Disease evolution- common progenitor cell compartment ... 40
1.9.4 Intermediate steps in FL development ... 45
1.10 Immunoglobulin in FL ... 49
1.11 B cell receptor signalling in FL ... 52
1.12 Genetics of FL ... 54
1.12.1 Chromosomal alterations: 1p36 and 6q deletions ... 56
5
1.12.3 Genetics of transformed FL ... 59
1.12.4 Genetic heterogeneity in FL ... 60
1.13 Microenvironment ... 61
1.13.1 N-linked glycosylation of follicular lymphoma surface immunoglobulin ... 63
1.13.2 Interaction between oligomannosylated Ig and C-type lectins ... 65
1.14 Current challenges in FL ... 69
1.15 Aims of this thesis ... 70
Chapter 2: MATERIALS AND METHODS ... 72
2.1 Patient samples and ethics ... 72
2.2 Cell lines ... 72
2.3 DNA extraction from cell lines ... 73
2.4 IGHV amplification ... 74
2.5 Heteroduplex analysis ... 76
2.6 Gel extraction ... 77
2.7 Agarose gel electrophoresis ... 77
2.8 PCR product clean-up ... 78
2.9 Nucleic acid assessment: Nanodrop ... 78
2.10 Nucleic acid assessment: Qubit ... 79
2.11 Sanger sequencing... 80
2.12 Analysis of sequencing results: IMGT/V-QUEST ... 80
2.13 Identification of acquired N-glycosylation sites ... 81
2.14 Analysis of selection pressures ... 81
2.15 BCL2-IGH breakpoint analysis ... 83
2.16 Cloning ... 84
2.17 Targeted amplicon sequencing ... 89
2.17.1 Preparation of libraries ... 89
2.17.2 Cluster generation and sequencing by synthesis ... 91
2.17.3 Phasing... 92
2.17.4 PhiX Spike-in ... 94
2.18 NGS data processing... 94
2.19 NGS processing: IMGT/HIGHV-Quest ... 95
2.22 NGS processing: Editing ... 96
2.20 IGHV NGS data for serial FL samples ... 96
2.21 IGHV sequences for composite HL and NHL lymphomas ... 96
2.23 Statistical Analysis ... 97
6
2.25 Immunohistochemistry ... 99
2.26 Principles of multiplex IHC ... 101
2.27 Sequential multiplex IHC: stripping and re-probing ... 103
2.28 Digital image analysis ... 104
Chapter 3: ACQUIRED N-GLYCOSYLATION MOTIFS AND THEIR ROLE IN FL EVOLUTION... 109
3.1 Introduction ... 109
3.2 Objectives ... 111
3.3 Methods ... 111
3.3.1 Patient samples ... 111
3.3.2 BCL2-IGH breakpoint analysis ... 112
3.3.3 IGHV amplification ... 112
3.3.4 Heteroduplex analysis ... 112
3.3.5 Cloning ... 112
3.3.6 Sanger sequencing ... 113
3.3.7 VDJ assignment and SHM analysis ... 113
3.3.8 N-gly motif identification ... 113
3.3.9 Amplicon sequencing ... 113
3.3.10 Lineage tree ... 114
3.4 Results ... 114
3.4.1 N-gly detection in a diagnostic FL cohort ... 114
3.4.2 Paired FL- tFL samples ... 117
3.4.3 SHM in paired FL-tFL ... 120
3.4.4 N-glycosylation motifs during disease progression ... 122
3.4.5 SHM variation within N-gly motif sequence ... 126
3.4.6 Fate of germline encoded motifs compared to acquired motifs ... 127
3.4.7 N-gly motifs in intraclonal variants ... 128
3.4.8 Patients undergoing NGS of IGHV ... 129
3.4.9 N-gly motifs in the major clones of temporal biopsies ... 132
3.4.10 Distribution of SHM within the subclonal repertoire ... 135
3.4.11 N-gly motif site conservation in subclone population ... 138
3.4.12 Diversity within the N-gly motif site ... 140
3.4.13 Analysis of subclones with highest and lowest degree of SHM ... 142
3.4.14 Discordant SHM in distinct anatomical sites ... 144
3.4.15 Fate of motif negative subclones during progression ... 145
3.4.16 Lineage trees reveal origin and fate of N-gly negative subclones ... 146
7
3.5 Discussion ... 153
Chapter 4: DC-SIGN AND MR EXPRESSION IN FL MICROENVIRONMENT ... 161
4.1 Introduction ... 161 4.2 Objectives ... 164 4.3 Method ... 164 4.3.1 Patient samples ... 164 4.3.2 DNA extraction ... 164 4.3.3 IGHV amplification ... 165 4.3.4 IHC ... 165 4.3.5 Visiopharm ... 165 4.3.6 Statistics ... 166 4.4 Results ... 166
4.4.1 N-gly motifs status of different groups ... 166
4.4.2 Distribution of immune cells in FL lymph node ... 169
4.4.3 Mean intensity of DC-SIGN and MR ... 172
4.4.4 DC-SIGN and MR markers in GC-located cell populations ... 174
4.4.5 DC-SIGN and MR markers in interfollicular-located cell populations ... 177
4.5 Discussion ... 179
Chapter 5: DISCUSSION ... 184
Supplementary Tables ... 189
Supplementary Figures ... 194
8
Acknowledgements
My time at Barts Cancer Institute has been an extremely enjoyable experience, regarding both the work within this thesis and the wonderful people I have met along the way.
My immense gratitude goes to my supervisor Sergey Krysov for patiently and enthusiastically guiding me throughout the PhD, whose door was always open for discussion and support. It has been a pleasure working together and I am thankful to have had such a great mentor. My appreciation goes to my primary supervisor, Mariarita Calaminici, for her expert advice and continual encouragement, and for giving me the opportunity to pursue a doctorate.
Work in this thesis would not have been possible without the contribution from several people. Firstly, I would like to thank Jessica Okosun for access to patient samples. To Emanuela Carlotti, for the bioinformatics assistance and always offering help when I ran into issues with the sequencing data. To Andrew Clear, for patiently preparing numerous tissue sections and going through the patient databank to retrieve clinical information. To Joseph Taylor, for teaching me how to use the new immunohistochemistry digital analysis software and offering solutions to the numerous technical issues I ran into. My PhD would not have been half as enjoyable without the friends I have made along the way. To Tahrima, Hemalvi, Faith and Emma, I look back fondly on our time in the office and the amount of laughter we have shared over the years. I am lucky to have made such lifelong friends. To Filomena Spada, it was a joy to work with such a positive person, thanks for all the helpful advice and discussions. To my family, who encouraged me to pursue a PhD and supported me through both the peaks and troughs of academia. To my partner Michael, for his understanding and faith in my abilities, and for offering words of encouragement when they were needed most.
Finally, I thank The Pathological Society of Great Britain and Ireland for generously supporting my PhD and for the patients that so openly support and contribute to our research endeavours.
9
Dedication
This thesis is dedicated to Mum & Dad who have always encouraged me to learn and take full advantage of the opportunities that were not available to them. Thank you for always supporting me in every decision I have made and having belief that I would eventually find my path. You are my biggest inspiration and motivation and I love you both very much.
10
Publications
Odabashian M, Carlotti E, Araf S, Okosun J, Forconi F, Stevenson FK, Gribben J,
Calaminici M, Krysov S. Immunoglobulin Variable Region Gene Sequences Reveal N-Glycosylation Motifs As an Early and Stable Event in Follicular Lymphoma Pathology. https://ash.confex.com/ash/2018/webprogram/Paper112397.html
Araf S, Wang J, Ashton-Key M, Korfi K, Di Bella D, Rio-Machin A, Odabashian M, Foria V, Du MQ, Cucco F, Barrans S, Johnson P, Laird SR, Fisher AM, Cullis J, Graham TA, Okosun J, Fitzgibbon J, Chiecchio L. Transmission of diffuse large B cell lymphoma by an allogeneic stem-cell transplant. Haematologica. 2018.196907.
11
List of Figures
Figure 1.1: Production and structure of antibody from heavy and light chain germline
DNA locus. ... 32
Figure 1.2: Models of FL evolution as suggested through genomic analysis of sequential FL biopsies and paired FL-tFL samples. ... 42
Figure 1.3: Phylogenetic trees based on non-synonymous mutations of paired FL-tFL biopsies ... 45
Figure 1.4: Model of FL pathogenesis based on presumed t14;18 positive precursor cells. ... 49
Figure 1.5: CSR processes in translocated and functional IGH allele. ... 51
Figure 1.6: Model of BCR stimulation in FL ... 54
Figure 1.7: N-glycosylation trimming and maturation in the Golgi. ... 63
Figure 1.8: Mannosylation of sIg derived from two FL patients with known N-gly sites. ... 65
Figure 1.9: Model highlighting the inferred interaction between FL cells and the microenvironment via the mannose-lectin interaction. ... 69
Figure 2.1: Molecular organisation of an IGH VH-JH rearranged sequence in genomic DNA. ... 75
Figure 2.2: Schematic diagram of the heteroduplex analysis technique. ... 76
Figure 2.3: Graphical output from BASELINe. ... 82
Figure 2.4: pCR™2.1 TOPO® TA vector. ... 87
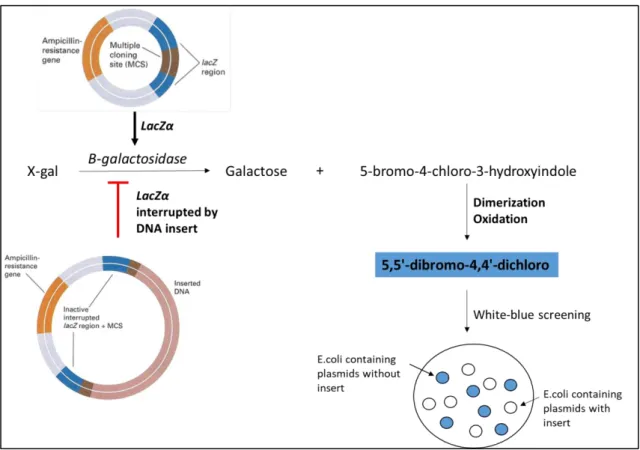
Figure 2.5: Visualisation of successful incorporation of the DNA in the plasmid vector. ... 88
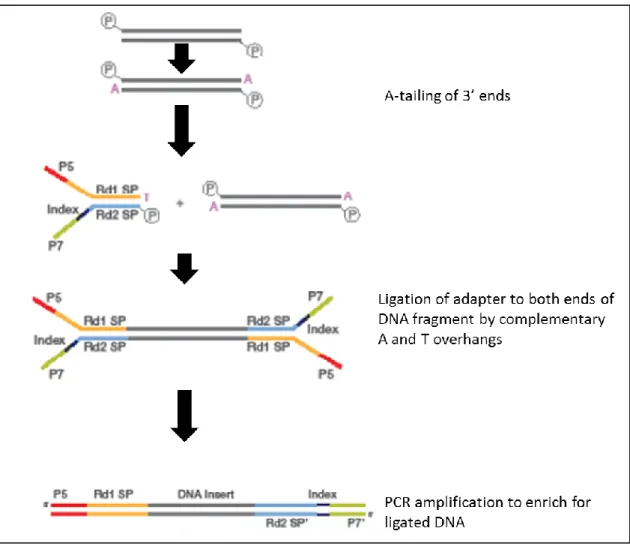
Figure 2.6: DNA library preparation. ... 90
Figure 2.7: Multiplexed paired-end sequencing process. ... 92
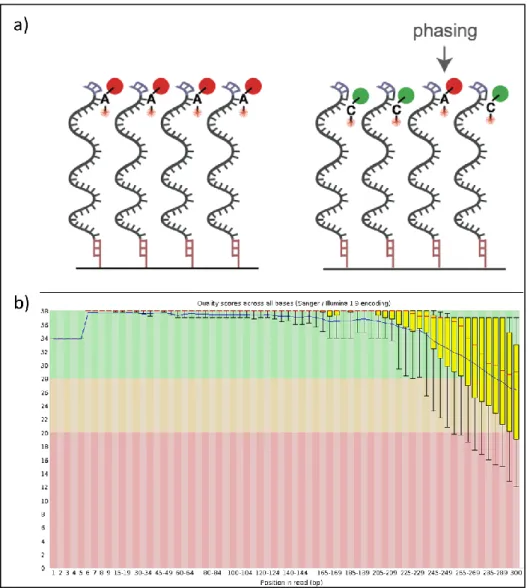
Figure 2.8: Reduced base quality during ongoing cycling using Illumina technology ... 93
Figure 2.9: Paired-end read length in relation to target DNA fragment length ... 94
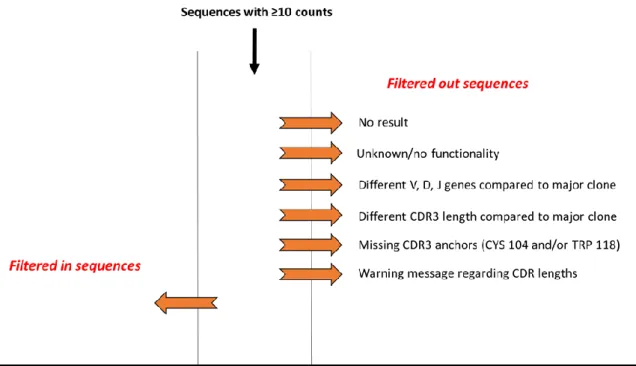
Figure 2.10: Parameters used in selection and filtering of unique sequences. ... 95
Figure 2.11: Example of a lineage tree created using IgTree and Graphviz ... 98
Figure 2.12: Indirect IHC. ... 101
Figure 2.13: Antibody test to determine the stripping efficacy ... 104
Figure 2.14: Normal histology of lymph node. ... 105
Figure 2.15: Examples of Visiopharm APP identifying distinct regions following training based on CD10 staining ... 106
Figure 2.16: Identification of CD68 and CD21 positive cells through staining intensity. ... 107
Figure 2.17: Identification of MR and DC-SIGN positivity in CD163+ and CD68+ cells. 108 Figure 3.1: IGHV bands visualised on agarose gel following amplification of homoduplexes. ... 114
Figure 3.2: Acquired N-gly motif of patient 1. ... 116
Figure 3.3: Analysis of IGHV gene in 30 diagnostic FL samples ... 117
Figure 3.4: Shared BCL2-IGH breakpoints for 3 selected FL-tFL paired cases. ... 120
12
Figure 3.6: Comparison of the V gene amino acid sequence for three FL-tFL paired
cases ... 121
Figure 3.7: N-gly motif sites in two paired FL-tFL patient samples. ... 125 Figure 3.8: Nucleotide sequences encoding for N-gly motifs in the CDR3 region of
paired FL-tFL samples ... 125
Figure 3.9: Paired FL-tFL samples that have distinct SHM in the nucleotide sequences
encoding for N-gly motifs ... 126
Figure 3.10: Analysis of germline and acquired N-gly motifs for patient 11’s temporal
samples ... 127
Figure 3.11: IGHV bands derived from cloning. ... 128 Figure 3.12: Alignment of the major clone CDR3 region of Patient 25 disease events 133 Figure 3.13: BCL2 breakpoint of 3rd relapse and transformation events of patient 25.
... 134
Figure 3.14: Distribution of V gene nucleotide substitutions found in subclones across
disease events for patients 23-25. ... 136
Figure 3.15: Representative BASELINe graphical output of subclones from temporal
samples of three patients. ... 138
Figure 3.16: Comparison between % of tumour subclones with presence and absence
of N-gly motif site in the heavy chain variable region across disease events ... 139
Figure 3.17: Diversity in the nucleotide sequence of the first and last amino acid of
motif positive subclones. ... 141
Figure 3.18: Discordance in the SHM pattern of subclones identified in temporal
samples from patient 27 across the variable region. ... 144
Figure 3.19: Venn diagrams showing the number of shared and distinct subclones
across disease events. ... 146
Figure 3.20: Lineage tree for the two disease events of Patient 26 ... 147 Figure 3.21: Lineage tree for the two disease events of Patient 27 ... 148 Figure 3.22: Hierarchy of motif negative clones in relation to their direct ancestral
clone for Patient 23 and 25 ... 150
Figure 3.23: Patients used in composite HL and FL IGHV analysis. ... 151 Figure 3.24: Clonal relationship between composite HL and FL based on IGHV
sequences. ... 152
Figure 3.25: Evolution model of composite FL and HL cases based on IGHV sequences
... 153
Figure 3.26: Simplified model of FL evolution and progression based on N-gly motifs.
... 160
Figure 4.1: Representative agarose gels highlighting DNA integrity from two extreme
FFPE samples. ... 168
Figure 4.2: Meshwork pattern of follicular dendritic cells identified by CD21 marker in
patient 32. ... 170
Figure 4.3: Distribution of cell types in GC and interfollicular regions across all three
groups ... 171
Figure 4.4: Specific DC-SIGN and MR staining in patient 38 ... 172 Figure 4.5: Mean intensity of DC-SIGN and MR across cell types and disease groups 173
13
Figure 4.6: Distribution of immune cells with DC-SIGN and MR positive and negative
phenotypes within individual cases ... 175
Figure 4.7: % of GC located cell types expressing DC-SIGN and MR positive and
negative phenotypes across disease groups... 176
Figure 4.8: % of interfollicular located cell types expressing DC-SIGN and MR positive
14
List of Tables
Table 1.1: WHO classification of FL histological grades. ... 19
Table 1.2: FLIPI and FLIPI-2 prognostic indexes ... 21
Table 1.3: Chemotherapy agents used in combination with Rituximab ... 24
Table 1.4: Novel agents undergoing evaluation in relapsed FL patients with outcome data provided ... 26
Table 1.5: Recurrent mutations in FL with frequencies of 10% and above. ... 55
Table 2.1: Primers used to amplify the BCL2-IGH gene rearrangements in temporal FL samples. ... 83
Table 2.2: BCL2-IGH breakpoint analyses PCR master mix ... 84
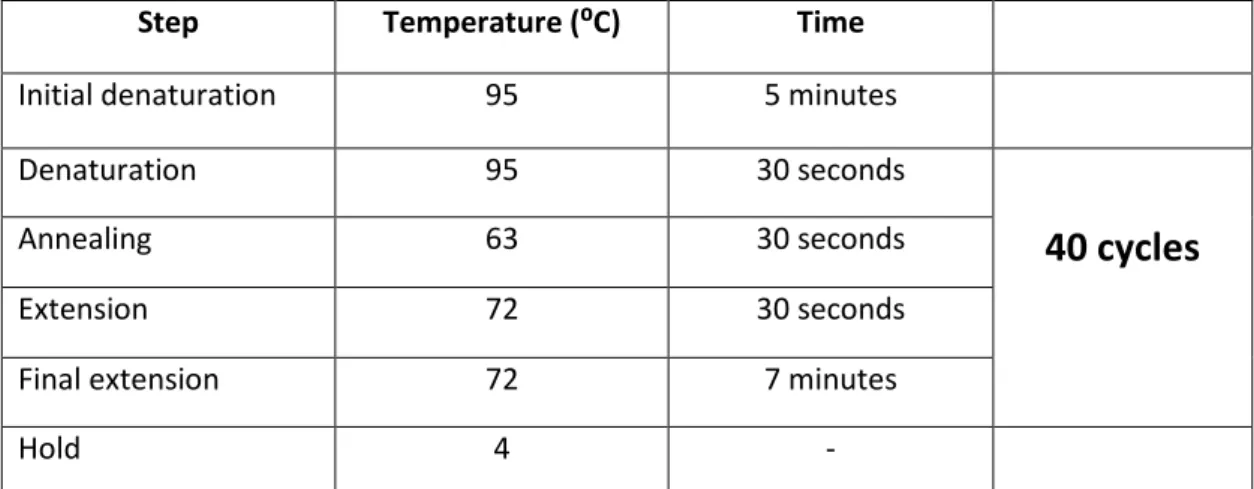
Table 2.3: PCR cycling conditions used to amplify the BCL2-IGH gene rearrangements ... 84
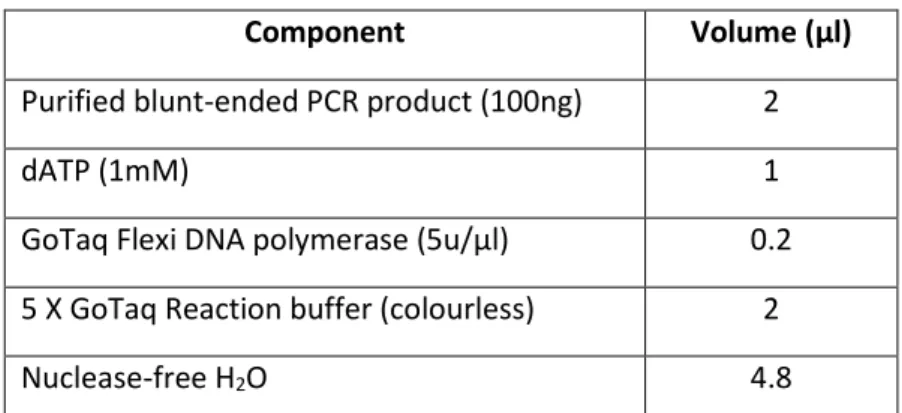
Table 2.4: Reaction mixture for adding 3’ adenine overhangs to blunt-ended PCR product. ... 85
Table 2.5: Primary antibodies and dilution factors. ... 100
Table 2.6: Chromogens used in multiplex IHC (brightfield). ... 102
Table 2.7: Cell types defined by Visiopharm APP analysed for DC-SIGN and MR positivity. ... 106
Table 3.1: Incidence of novel N-glycosylation sites in diagnostic FL samples ... 115
Table 3.2: Location of N-gly motifs in relation to known SHM hotspots. ... 116
Table 3.3: Clinical characteristics of patients included in paired sample analysis. ... 119
Table 3.4: N-glycosylation sites acquired through SHM in the VH gene of paired FL/t-FL cases ... 123
Table 3.5: Analysis of somatic mutations giving rise to N-gly sites. ... 124
Table 3.6: Conservation of N-gly motifs in distinct tumour related subclones. ... 129
Table 3.7. Additional clinical information regarding 6 patients who underwent IGHV targeted sequencing. ... 131
Table 3.8. N-gly motifs identified in the major clone of six FL patients taken at different time points of disease. ... 132
Table 3.9: Analysis of somatic mutations giving rise to N-gly sites. ... 135
Table 3.10. Analysis of subclones not sharing the identical codon sequence of the N-gly motif found in the major clone ... 140
Table 3.11: N-gly motif status in most and least diverse subclone based on degree of SHM compared to V gene germline sequence. ... 143
Table 4.1: Clinical information regarding extreme survival patients. ... 167
Table 4.2: N-gly status in the IGHV of samples undergoing multiplex immunohistochemistry. ... 169
15
List of abbreviations
AID: Activation induced cytidine deaminase
AKT: Protein kinase B
BAFF: B cell activating factor
BCR: B cell receptor
BCL2: B cell lymphoma-2
CCL17: Chemokine (C-C motif) ligand 17 CDRs: Complementarity determining regions
CLL: Chronic lymphocytic leukaemia
CPC: Common progenitor clone
CREBBP: CREB binding protein
CSR: Class switch recombination
C-type: Calcium dependent
CNV: Copy number variation
CXCL12/SDF-1: C-X-C motif chemokine 12/stromal cell-derived factor 1 CXCL13: Chemokine (C-X-C motif) ligand 13
DC: Dendritic cell
DC-SIGN: Dendritic Cell-Specific Intercellular adhesion molecule-3-Grabbing Non-integrin
DLBCL: Diffuse large B cell lymphoma
DLI: Donor leukocyte infusion
DNA: Deoxyribonucleic acid
ER: Endoplasmic reticulum
ERK: Extracellular signal–regulated kinases
EZH2: Enhancer of zeste homolog 2
FDC: Follicular dendritic cell
FFPE: Fresh frozen paraffin-embedded
FFS: Five year failure free survival
FL: Follicular lymphoma
FLLC: Follicular lymphoma-like cells
GC: Germinal centre
HH: Heteroduplex analysis
HIER: Heat induced epitope retrieval
HRP: Horseradish peroxidase
IGH: Immunoglobulin heavy chain gene
IGHV: Immunoglobulin heavy chain variable gene
IL-4: Interleukin 4
IL-6: Interleukin 6
IL-10: Interleukin 10
ISFN: In situ follicular neoplasia
LN: Lymph node
M2: Alternatively activated macrophage
MBL: Mannose binding lectin
16 MHC: Major histocompatibility complex
MR: Mannose receptor
MSC: Mesenchymal stromal cells
N-gly: N-linked glycosylation
NHL: Non-Hodgkin’s Lymphoma
OS: Overall survival
PFL: Partial involvement by FL
PFS: Progression free survival
PRR: Pattern recognition receptors
PTFL: Paediatric-type follicular lymphoma
POD: Progression of disease
RAG: Recombination activating gene
R-CHOP: Rituximab plus cyclophosphamide, doxorubicin, vincristine, and prednisone
SHM: Somatic hypermutation
sIg: Surface immunoglobulin
SNP: Single nucleotide polymorphism
SNV: Single nucleotide variant
STAT6 Signal transducer and activator of transcription 6
TAM: Tumour associated macrophage
TFH: Follicular helper T cells
tFL: Transformed follicular lymphoma
TNFRSF14: Tumour necrosis factor receptor superfamily, member 14 TRegs: T regulatory cells
V: Variable region gene
WES: Whole exome sequencing
WGS: Whole genome sequencing
W/W: Watch and wait
17
Chapter 1: INTRODUCTION
1.1
Disease overview
Follicular lymphoma (FL) is the second most common non-Hodgkin’s lymphoma (NHL) in Western Europe and the United States following diffuse large B cell lymphoma (DLBCL). The disease represents 70% of all indolent lymphomas with an increasing incidence in Western countries over the last two decades, rising from 2 in 100,000 people in the 1950s to 5 in 100,000 people in 2016 (Campo et al., 2011, Mounier et al., 2015). The majority of patients are diagnosed at an advanced stage due to lack of symptoms, with lymphadenopathy being the first reason for seeking medical assistance. Although there is no preponderance regarding sex, there are variations in incidence rates between ethnic groups and geographical location, the reason for this remaining unknown. The median age at diagnosis is 65 years (Junlen et al., 2015), highlighting FL as a disease strongly linked to age. Although rare, FL can manifest in young adults and children which is now recognised as a separate disease entity called paediatric-type FL (PTFL) due to being both histologically and clinically distinct (Pinto et al., 1990, Winberg et al., 1981, Lorsbach et al., 2002, Araf and Fitzgibbon, 2016).
The clinical course of FL is heterogeneous, with the majority of patients having a high response rate to first-line therapy followed by several cycles of relapse and remission with each disease free episode becoming progressively shorter. These patients usually follow an indolent course, surviving up to twenty years following diagnosis. However, a subset of patients (20-25%) follow an aggressive disease course in which progression occurs within two years of treatment or the disease transforms to a high-grade lymphoma (Casulo et al., 2015, Casulo, 2016). For these patients, the prognostic outlook is relatively very poor despite an availability of several immunotherapeutic strategies. Predicting which patients would fall into this high-risk group remains an ongoing area of research (Huet et al., 2018b) in order to deliver a tailored therapeutic strategy and enrol patients most likely to benefit from a clinical trial (Weigert and Weinstock, 2017).
18 Although we are beginning to unravel the biological processes underpinning the disease and targeting them with novel immunomodulatory therapeutic approaches, the disease effectively remains incurable.
1.2 Clinical presentation and diagnosis
The majority of patients present with lymphadenopathy in the cervical, axillary, inguinal and/or femoral regions. Rarely are tumours localised to one site and therefore widespread dissemination of disease is a common finding. Adenopathy waxes and wanes spontaneously. Apart from this enlargement, the majority of patients are asymptomatic. Less than 20% of patients display ‘B symptoms’ including night sweats, fever and/or weight loss. Despite the large tumour burden, increased serum lactate dehydrogenase are observed in less than 25% of patients. Extra-nodal involvement is common with liver and bone marrow involvement seen in 50% and 80% of cases, respectively.
A biopsy taken from the affected lymph node is preferably used in FL diagnosis, with core needle biopsy reserved for cases with difficult to access nodes (e.g. retroperitoneal nodes). Histologic analysis typically reveals a nodular growth pattern with abolished nodal architecture, including an ill-defined or absent mantle zone. FL is composed of follicular centre cells, named centrocytes and centroblasts. Grading, according to WHO classification, is based on the number of centroblasts counted per high-powered field (hpf), with an higher count indicative of a more aggressive clinical course (Table 1.1). Grade 3 is subdivided into group A and B (absence of centrocytes) with 3B resembling de novo DLBCL, both histologically and molecularly (Horn et al., 2011, Bosga-Bouwer et al., 2003). Because of this marked distinction, grade 3B is likely to be treated similarly to DLBCL.
Immunophenotyping of tissue sections is used to identify the disease. Typically, tumour cells express pan-B cell markers (IgM, CD19, CD20, CD22 AND CD79a) and germinal centre markers, including BCL-6 and CD10. They are negative for CD5 expression which is useful in differential diagnosis of low-grade B cell lymphomas (Cossman et al., 1984,
19 Harris et al., 1984, de Leon et al., 1998, Lydyard et al., 1999). Bcl-2 is overexpressed in the germinal centres of >90% of patients which is the result of the translocation t(14;18)(q32;q21) involving the BCL2 gene and the immunoglobulin heavy chain enhancer, discussed in more detail below (Aster and Longtine, 2002). The surface immunoglobulin is monoclonal, with malignant cells sharing identical V, D and J genes in the variable region of both their heavy and light chains which are readily detected through the polymerase chain reaction (PCR). In accordance with their germinal centre residence, on-going somatic hypermutation is observed in the variable regions of malignant cells, giving rise to a heterogeneous clonal population (Cleary et al., 1986b, Bahler et al., 1991). Grade Definition 1 0-5 centroblasts/hpf 2 6-15 centroblasts/hpf 3A >15 centroblasts/hpf Presence of centrocytes
3B >15 centroblasts /hpf, sheets of centroblasts Absence of centrocytes
Table 1.1: WHO classification of FL histological grades. The system is based on the absolute number of centroblasts per 40x high powered field (hpf).
1.3 Staging and prognostic indicators
Anatomical staging is based on the Ann Arbour classification and describes the number of lymph nodes involved, their location and presence of extranodal organ involvement. Each stage is subdivided to indicate the absence or presence of B symptoms.
The clinical outcome for FL patients remains highly variable, with a subset of patients having a very poor clinical outcome, associated with histological transformation or progression of disease within 2 years of initial therapy (Casulo et al., 2015, Conconi et al., 2012). Identifying patients who are in this high-risk group can lead to tailoring of therapy and an improved clinical outcome, and therefore developing prognostic tools
20 that stratify patients based on disease-specific features is highly desirable. Follicular Lymphoma International Prognostic Index (FLIPI) predicts the outcome of patients through five independent adverse prognostic risk factors (9) (Table 1.2). Patients are placed into three risk groups, based on the number of risk factors they present. Because FLIPI was based on retrospective analysis before the introduction of widespread chemotherapy, FLIPI2 (10) was introduced which revised the adverse prognostic risk factors (Table 1.2) and is based on a progression-free survival (PFS) endpoint. However, the utility of the FLIPI-2 model in a clinical setting remains undetermined, with FLIPI continuing to be a useful prognostic model in the Rituximab era.
M7FLIPI is the first prognostic score in lymphoma to incorporate both genetic and clinical factors to identify high risk patients treated with standard therapy. It consists of the FLIPI risk factors, Eastern Cooperative Oncology Group performance status, and mutations in seven genes involved in epigenetic regulation (EZH2, EP300, and CREBBP), transcription (FOXO1, MEF2B), nucleosome remodelling (ARID1A), and BCR signalling (CARD11). The risk stratification is more closely associated with outcome compared to the clinical or genetic predictors alone.
21
Independent Risk factors Risk group No. of factors Outcome, % 5-y OS 10-y OS FLIPI
Low 0-1 91 71
Age ≥60 y
Ann Arbor Stage III/IV
Intermediate 2 78 51 Haemoglobin <12 g/dL LDH elevated High 3-5 53 36 >4 nodal sites 3-y PFS 5-y PFS FLIPI-2 Low 0 91 80 Age ≥60 y B2M elevated Intermediate 1-2 69 51 Haemoglobin < 2 g/dL BM involvement High 3-5 51 19
Lymph node diameter >6 cm
Table 1.2: FLIPI and FLIPI-2 prognostic indexes. FLIPI-2 was created in the rituximab therapy era and prognosis is based on progression-free survival rather than overall survival. FLIPI-2 also modified the risk factors of FLIPI, including beta 2 microglobulin (B2M) level, bone marrow (BM) involvement and lymph node diameter of >6cm.
1.4 Management strategies
Therapeutic choices are influenced by a range of factors including stage of disease, tumour burden, comorbidities, performance status, age and toxicity concerns. The Groupe d'Etude des Lymphomes Folliculaires (GELF) Criteria (Brice et al., 1997) can help identify patients who are at higher risk for rapid disease progression and therefore require immediate therapy.
22
1.4.1 Initial treatment of early stage FL
Less than 10% of patients are diagnosed with Stage I/II disease and due to this low number, no randomised studies regarding optimal management exist. However, targeted radiotherapy to the disease site has high curative potential and is generally the treatment of choice. 10 year overall survival rates based on this treatment modality alone is ~ 80% with a median survival of ~19 years (Guadagnolo et al., 2006). The recommended dose is currently 24 Gy with higher doses offering no benefit with regards to progression-free survival (PFS) or overall survival (OS) (Lowry et al., 2011).
1.4.2 Initial treatment of advanced stage FL
The majority of FL patients have advanced disease at diagnosis with either a low or high tumour burden, as assessed through the GELF criteria. For this group, the disease cannot be cured by conventional therapies, with the emphasis of treatment being to control symptoms and extend remission lengths and OS. Patients can be symptomatic or asymptomatic, which influences treatment decisions.
Patients with asymptomatic, low tumour burden generally undergo a watch and wait (W/W) approach. The patient is observed for signs of vital organ compromise and infiltration, development of cytopenias, B symptoms or rapid disease progression. Randomised phase III studies revealed that patients undergoing Rituximab induction followed by 2 years of rituximab maintenance had a significantly longer PFS when compared to the W/W group. However, there was no difference in OS between the two groups, maintaining W/W as a reasonable approach, which shields patients from the toxic effects of chemotherapy. However, Rituximab may be beneficial to a subset of patients who have coping issues and prefers a longer remission duration with an understanding of the efficacy/toxicity trade-off.
Patients with symptomatic, low tumour burden are first examined for alternative explanations for their symptoms. If no other cause is ascertained, single agent Rituximab
23 is used, particularly in older patients and those with co-morbidities. Rituximab based chemotherapy would likely benefit younger and fitter patients.
Patients with symptomatic, high tumour burden usually require immediate therapy. The inclusion of Rituximab to a variety of combination chemotherapy has been a considerable therapeutic advance in FL treatment as evidenced by improved response rates (RR), PFS, and OS (Hiddemann et al., 2005, Marcus et al., 2008, Herold et al., 2003). Rituximab is a chimeric anti-CD20 monoclonal antibody with proposed mechanisms of action including elicitation of antibody-dependent cellular cytotoxicity (ADCC) and complement mediated cytotoxicity following binding to CD20 on the B cell surface (Smith, 2003). Chemotherapy has a less targeted mechanism of action, with the focus being on interrupting DNA synthesis and cell division processes (Table 1.3). To evaluate which chemotherapy was optimal for first line treatment of advanced stage FL, R-CHOP (rituximab, cyclophosphamide, doxorubicin, vincristine, prednisolone) treatment was compared to R-CVP (rituximab, cyclophosphamide, vincristine, prednisolone) and R-FM (rituximab, fludarabine and mitoxantrone) (Federico et al., 2013).R-CHOP and R-FM had a better time to treatment failure (TTF) and PFS than R-CVP. However, R-FM was associated with a higher toxicity risk profile compared to R-CHOP and R-CVP. Yet, the three year OS rate for all categories was 95%, resulting in a lack of consensus on the choice of standard chemotherapy. In a German study group, R-CHOP was compared to bendamustine plus rituximab (BR) in a phase III trial in 513 advanced stage FL patients. BR had superior toxicity profiles and PFS at 45 months (Rummel et al., 2013). In the Bright study, BR was found to be non-inferior to R-CHOP or R-CVP in treatment naïve patients, measured by complete response rate (CRR) and overall response rate (ORR) (Flinn et al., 2014), establishing BR as a standard frontline therapy for indolent NHLs in North America and parts of Europe (Morschhauser et al., 2011, Rummel et al., 2013). The use of maintenance rituximab is individualised as although it improves the 2 year PFS, there are no benefits regarding OS (Salles et al., 2011).
24
Chemotherapy agent Mechanism of action
Cyclophosphamide Alkylating agent. Attachment of alkyl groups to DNA bases,
preventing DNA synthesis
Doxorubicin Anthracycline. Inhibits topoisomerase II activity
Vincristine Vinca alkaloid. Binds to microtubular proteins of the mitotic
spindle causing mitotic arrest at metaphase
Prednisolone Glucocorticoid. Mediate pro-apoptotic pathways through
transcriptional activation of the Bim protein
Fludarabine Inhibits DNA synthesis by inhibiting DNA polymerase alpha, ribonucleotide reductase and DNA primase
Mitoxantrone DNA intercalating agent causing strand breaks. Inhibitor of toposiomerase II
Bendamustine Alkylating agent. Causes intra- and inter-strand crosslinks
between DNA bases resulting in cell death
Table 1.3: Chemotherapy agents used in combination with Rituximab.
1.4.3 Treatment of relapsed FL
Despite the long remission and high response rates to first line treatment, the majority of patients inevitably relapse. To determine the extent of disease reoccurrence, a repeat biopsy is taken to determine the staging and exclusion of histological transformation. Considerations regarding therapy include previous treatments, duration of response, health and fitness of the patient and their current symptoms. There are a number of options for relapsed FL including radiotherapy for localised disease and for selected patients, allogeneic or autologous stem cell transplant. Rituximab with chemotherapy was shown to have an enhanced efficacy of treatment of relapsed FL not previously treated with rituximab or anthracycline. Patients were randomised to either CHOP or R-CHOP and those showing response either underwent rituximab maintenance or observation (van Oers et al., 2006). The R-CHOP group had an increased overall response rate and CR rate compared to CHOP alone with both groups benefiting with an improved PFS following rituximab maintenance compared to overall survival. Rituximab added to other chemotherapy such as fludarabine, cyclophosphamide, mitoxantrone (R-FCM) also showed a clinical benefit in a relapsed setting with superior PFS and OS compared
25 to FCM treatment alone (Forstpointner et al., 2004). Bendamustine as a single agent or in combination with rituximab also showed benefit to patients with relapsed FL (Friedberg et al., 2008, Robinson et al., 2008, Rummel et al., 2005).
Autologous stem cell transplant (ASCT) has been explored as part of consolidation therapy with high dose chemotherapy in high risk and advanced stage FL patients at first remission (Benedetti et al., 2013, Gyan et al., 2009, Ladetto et al., 2008, Lenz et al., 2004, Sebban et al., 2008) with an improved PFS. However, the lack of advantage regarding OS has not merited the use of HSCT as a first line therapy. In a relapsed setting however, high dose therapy with ASCT was shown to increase PFS and OS when compared to conventional chemotherapy (Schouten et al., 2003) in the pre-rituximab era. Prospective studies have indicated the promise of ASCT with rituximab as a treatment in the first relapse setting, as indicated by a 90% survival after relapse (SAR) at 5 years (Le Gouill et al., 2011, Sebban et al., 2008). Total body irradiation (TBI) as a conditioning regimen is not typically used due to a higher incidence of treatment related myelodysplastic syndrome/acute myeloid leukaemia compared to chemotherapy based conditioning (Montoto et al., 2007a, Darrington et al., 1994), outweighing the benefit of lowered relapsed risk.
1.4.4 Novel therapeutics
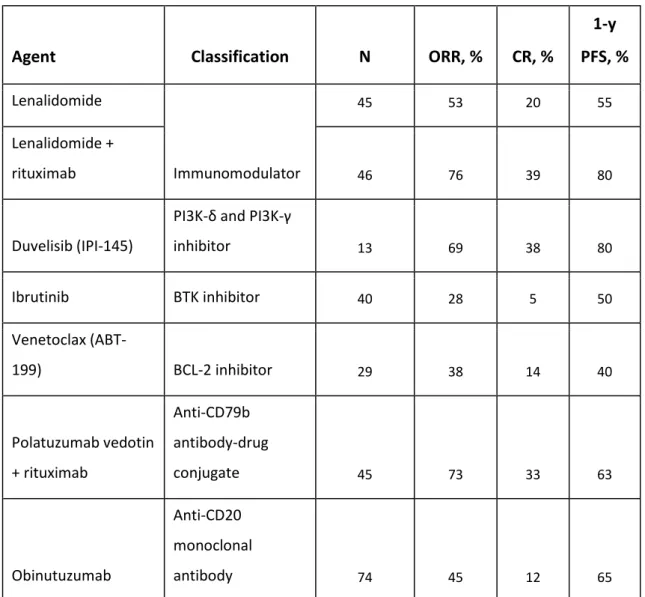
Targeted therapy exploiting the key mechanisms used by tumour cells has become a popular area of research and as a result, a wide range of novel agents are currently in development or in a clinical trial. Where available, relapsed/refractory patients requiring treatment should be entered into clinical trials evaluating novel therapies. A non-exhaustive summary of novel agents is provided in Table 1.4.
26
Agent Classification N ORR, % CR, %
1-y PFS, % Lenalidomide Immunomodulator 45 53 20 55 Lenalidomide + rituximab 46 76 39 80 Duvelisib (IPI-145)
PI3K-δ and PI3K-γ
inhibitor 13 69 38 80 Ibrutinib BTK inhibitor 40 28 5 50 Venetoclax (ABT-199) BCL-2 inhibitor 29 38 14 40 Polatuzumab vedotin + rituximab Anti-CD79b antibody-drug conjugate 45 73 33 63 Obinutuzumab Anti-CD20 monoclonal antibody 74 45 12 65
Table 1.4: Novel agents undergoing evaluation in relapsed FL patients with outcome data provided. N (number of patients), ORR (overall response rate), CR (complete remission). Table information taken from Kahl & Yang, 2016 (Kahl and Yang, 2016).
1.5 FL variants
Whilst the majority of FL patients display a ‘classical’ nodal FL, less common variants occur which are both clinically and pathologically distinct. Below are examples of two FL variants.
Paediatric-type FL (PTFL): Typically presents in adolescents and young adults (18-30
years old), with an occasional presentation in older adults. There is a predominance in males (10:1) and the majority of patients present with localised stage one
27 lymphadenopathy. Prognosis is favourable following local excision or minimal chemotherapy. The disease has a follicular architecture composed of blastoid cells which are larger than centrocytes and centroblasts (Liu et al., 2013). Although having a high-grade histological appearance and high proliferation index, the behaviour is usually benign.
The genetic landscape of PTFL is also distinct from classical FL. Recurrent mutations in epigenetic modifiers including CREBBP and KMT2D are absent (Louissaint et al., 2016, Schmidt et al., 2016) in addition to a lack of BCL2, BCL6 and IRF4 rearrangements which are typical of classical FL (Louissaint et al., 2012). While the genomic complexity is relatively low, mutations in the MEK/ERK pathway and TNFRSF14 were the most commonly found with a prevalence of 43% and 29% (Louissaint et al., 2016), respectively. Interestingly, TNFRSF14 mutations were associated with deletion or copy number–neutral loss of heterozygosity of chromosome 1p, which are lesions typically found in TNFRSF14 of classical FL, evidence of at least a degree of genetic semblance between the two entities. The lack of epigenetic ‘addiction’ in PTFL along with a low genetic complexity and absence of recurrent mutations found in classical FL has supported PTFL as being considered a biologically and clinically distinct indolent lymphoma.
Duodenal type FL: These are low-grade lesions (grade one or two) localised in the second
portion of the duodenum without metastasis (Schmatz et al., 2011). Patients have an excellent prognosis with a ‘watch and wait’ approach frequently employed. Gene expression reveals similarity to extranodal marginal zone lymphoma of mucosa-associated lymphoid tissue (MALT) lymphoma (Takata et al., 2014). Restricted V gene segment usage of immunoglobulins was seen, specifically VH4 and VH5, suggesting an antigen-dependent mechanism in lymphomagenesis (Takata et al., 2009), as in the case of MALT lymphoma, which develops from chronic inflammation. Genetic changes similar to classical FL include the t14;18 translocation and BCL2 and BCL6 expression (Takata et al., 2014). Another similarity to FL is that clones have ongoing somatic hypermutation (SHM) in their V genes. However, this is in spite of a lack of AID expression (Takata et al., 2009), suggesting a distinct pathway to facilitating ongoing SHM.
28
1.6 Transformation
A significant disease event that can occur at relapse or progression is the transformation of FL into an aggressive lymphoma (t-FL) which is considered one of the most unfavourable events in the natural course of FL. t-FL was first described in 1942, in which serial biopsies revealed a ‘less differentiated’ appearance compared to the preceding FL biopsy (Gall and Mallory, 1942), sharing a more similar histologic appearance to a different lymphoma group. However, the clonal relationship between disease events can be seen through identical IGH-BCL2 rearrangements (Lossos et al., 2002), distinguishing bona fide transformation events from de novo secondary malignancies. Unlike FL, t-FL has a high proliferative index which can be visualised through Ki-67 staining (Natkunam et al., 2004). The follicular architecture is effaced by the infiltration of diffuse large cells within the follicles (Lossos and Gascoyne, 2011). The majority of transformations resemble de novo diffuse large B cell lymphoma (DLBCL), with a smaller group (7%) resembling Burkitt-like lymphoma (Al-Tourah et al., 2008). The majority of patients with a DLBCL-type transformation have a genetic signature that resembles de
novo germinal centre B cell type DLBCL (GCB-DLBCL), including BCL2 rearrangements
and mutations in EZH2 and TNFRSF14 (Pasqualucci et al., 2014). Intriguingly, 16% of cases are of the activated B –cell subtype (ABC) which are associated with t14;18 negative FLs (Kridel et al., 2015a).
Biopsy and immunophenotyping remain the gold standard for t-FL diagnosis although a combination of clinical features can offer a reliable diagnosis if biopsy sampling is not an option. This includes the sudden onset of B symptoms (fever, night sweats, and weight loss), elevated serum LDH, hypercalcaemia, development of extranodal disease and rapid tumour growth.
The rate of transformation is 2-3% per year (Ban-Hoefen et al., 2013, Wagner-Johnston et al., 2015, Al-Tourah et al., 2008) with a broad incidence rate ranging from 11-70% (Hubbard et al., 1982, Montoto et al., 2007b, Al-Tourah et al., 2008, Garvin et al., 1983, Risdall et al., 1979). This variability is likely due to a lack of uniform across studies, including the cohort size, method of diagnosis by the clinician (histologic versus clinical parameters), variable inclusion of autopsy samples and variable duration of patient
29 follow up and surveillance. Furthermore, lack of clonality determination using a pre-transformation sample in earlier studies cannot distinguish true pre-transformations from de novo secondary malignancies, impacting the frequency of transformation reported. Identifying patients who are more at risk of transformation remains an attractive line of enquiry for tailored and pre-emptive therapy strategies. Advanced stage disease and a high FLIPI score at diagnosis are predictive of patients at a higher risk of transformation (Montoto et al., 2007b). Furthermore, transformation rates at 5 years following diagnosis were shown to be highest in patients who were observed compared to those who underwent rituximab monotherapy (P = 0.21) (Link et al., 2013), suggesting that initial management strategies during FL may influence transformation risk. However, two different studies contradicted these observations by finding a W&W approach had either a lower or similar transformation risk compared to rituximab therapy (Conconi et al., 2012, Ardeshna et al., 2014). Several studies have looked into whether transformation risk increases over time, with contradicting findings. Montoto et al (Montoto et al., 2007b) and Bastion et al (Bastion et al., 1997) found that the risk of transformation plateaus after 15 years and 6 years follow up, respectively, suggesting a subset of patients who will never undergo a transformation. However, other studies found that the risk of transformation continues to increase over time, suggesting transformation as an inherent evolution of FL, regardless of treatment versus non-treatment of FL (Horning and Rosenberg, 1984, Al-Tourah et al., 2008). However, both these studies did not include rituximab therapy and therefore the risk of transformation in the rituximab era warrants further examination.
The prognosis of transformed patients was extremely dismal with a median OS of 1-2 years following diagnosis. However, the introduction of rituximab as part of post transformation therapy has seen a considerable improvement with median survival reaching up to 5 years post diagnosis (Alonso-Alvarez et al., 2017, Ban-Hoefen et al., 2013, Link et al., 2013). R-CHOP therapy is used as a treatment option, especially in anthracycline naïve patients, with OS of t-FL patients matching that of de novo DLBCL patients on the same regimen (Link et al., 2013, Gleeson et al., 2017). Autologous stem cell transplant (ASCT) in the rituximab era has also shown benefit to patients. For ASCT patients ≤60 years, the 2 year OS was 74% compared to 59% in the non-ASCT patients
30 ≤60 years of which 56% were on R-CHOP therapy (Ban-Hoefen et al., 2013). Despite this improvement, prognostic parameters are still associated with a poorer outcome. For example, patients with a higher FLIPI score, and those who transform less than 18 months following FL diagnosis are indicated to have a poorer survival (Federico et al., 2009, Link et al., 2013). Additionally, patients who are chemotherapy naïve prior to transformation had a superior 2 year OS following ASCT and non-ASCT compared to those exposed to chemotherapy prior to transformation (Ban-Hoefen et al., 2013).
1.7 B cell development
As neoplastic counterparts of normal GC B cells, FL cells are derived from the deviation of the normal B cell development pathway. Therefore, we must understand the processes governing B cell development, as they are implicit to the manifestation of the disease.
B cells are a critical component of the adaptive immune system as they produce antigen-specific immunoglobulins that eliminate pathogens. B cell development begins in the bone marrow where they originate from lymphoid progenitors, which in turn arise from the pluripotent haematopoietic stem cells. The stages of B cell development in the bone marrow are marked by the rearrangement and expression of immunoglobulin genes which occur in a fixed and regulated sequence, as described below.
1.7.1 Immunoglobulin structure and formation
One feature of normal B cells maintained by all FL cells throughout disease is the expression of surface immunoglobulin (sIg). This is in spite of several challenges, including the loss of one functional Ig allele as a result of the t(14:18) translocation and ongoing SHM of the variable regions that increase the probability of stop codon introduction and loss of structural integrity. This selective retention suggests the sIg has an important role in FL pathogenesis.
31 There are three immunoglobulin gene loci; the heavy chain (IgH) located on chromosome 14q32.3, and two light chains, termed κ and λ, located on chromosome 2p and chromosome 22q, respectively. The protein products of these genes form the mature Ig molecule initially expressed on the pre B cell surface, which in combination with CD79a/b, form the B cell receptor (BCR). The immunoglobulin is made of four polypeptide chains comprising of two identical heavy chains (IgH) and two identical light chains (either Igκ or Igλ) which are held together by disulphide bonds between cysteine residues (Figure 1.1). Heavy and light chains are composed of variable and constant regions. The variable region of the heavy chain is encoded by three gene segments; variable (VH), diversity (DH) and joining (JH). The variable light chain region is encoded by
two gene segments; variable (Vκ/λ) and joining (Jκ/λ). The variable region of the heavy
chains and both regions of the light chains encompass the Fab fragment of the immunoglobulin which determines the antigenic specificity. Antigen binds to 3 complementarity determining regions (CDRs) within this region which are flanked by conserved sequences known as framework regions that act as structural support. The constant region of the heavy chain makes up the Fc portion which is responsible for the effector function of the immunoglobulin dependent on its isotype.
32
Figure 1.1: Production and structure of antibody from heavy and light chain germline DNA locus. Un-rearranged immunoglobulin heavy chain locus (top of figure) contains multiple functional V, D and J segments (of which only a few are depicted) whereas un-rearranged kappa or lambda light chain locus (left of figure) contains multiple V and J segments (of which only a few are depicted). The heavy chain locus rearranges first, with the joining of one V gene segment, one D gene segment and one J gene segment to generate the DNA encoding the heavy chain variable region. This combination is random, contributing to antibody diversity. The light chain V and J segment then combine to generate the light chain variable region. Grey bars represent addition of non-templated bases. The positions of the heavy and light chain variable regions are depicted on the polypeptide, represented by VH and VL, respectively. Complementary determining regions (CDR1-3) are shown, with CDR3 being encoded by all gene segments of the respective light and heavy chains. The constant regions of the heavy and light chains (CH and CL) are encoded by exons (not shown here) that are joined to the rearranged V(D)J gene by mRNA splicing. Disulphide bonds (depicted by black bars) join the heavy and light chains to generate the full antibody structure. Image is taken from Boyd and Joshi (Boyd and Joshi, 2014).
33 Immunoglobulin production begins during somatic recombination in which gene segments of the variable region are joined together in the bone marrow. The heavy chain (IgH) locus undergoes rearrangement first, with the D and JH gene segments
joining first, followed by the VH segment joining to DJH. This gives rise to μ chains that,
in complex with surrogate light chains made of VpreB and delta5, form the pre B receptor that is transiently expressed on the cell surface of large cycling B cell precursors, known as pre-B cells. These cells differentiate into non-dividing small pre B cells in which the light chain genes undergo rearrangement to produce immature B cells that express IgM and low levels of IgD on the cell surface. If the B cell passes IgM autoreactivity testing, it leaves the bone marrow and migrates to secondary lymphoid organs. Chemokines produced by follicular dendritic cells attract the naïve B cells into follicles that are bordered by T cells (T cell zone) and at this stage, B cells are classified as naïve. The B cell receptor binds to a cognate exogenous antigen that enters the follicle and then migrates to the T cell zone where it displays the antigen to a T helper cell as peptides bound to MHC Class II molecules. This enables full activation of the B cell, with some of the B cells differentiating into plasmablasts that produce low affinity antibodies. Other B cells migrate back into the follicle and undergo rapid proliferation to form a germinal centre (GC). Resting B cells are pushed to the periphery of the follicle and form the mantle zone. The germinal centre size continues to increase during proliferation with the establishment of a polarised microenvironment referred to as the dark and light zone. The dark zone refers to the histological appearance of rapidly proliferating B cells being densely packed in contrast to the sparsely populated light zone which also includes a number of other cell types, including follicular dendritic cells, macrophages and T helper cells. The majority of dark zone B cells are termed centroblasts and light zone B cells are termed centrocytes. A majority of B cells undergo apoptosis in the GC with a few being selected to undergo differentiation to either memory or plasma B cells that exit the germinal centre and provide the individual with effective and long lasting protection during chronic or recurring infection. They achieve this by utilising their high affinity BCRs, which are produced in the GC reaction through two mechanisms; somatic hypermutation (SHM) and class switching (CSR) which are discussed in detail below.
34
1.7.2 Immunoglobulin diversification
To recognise a multitude of antigens and mount an effective immune response requires a diverse antibody repertoire which is generated by four main processes. The first process of immunoglobulin diversity is achieved in the bone marrow. The variable region of each of the immunoglobulin loci contains multiple gene segments. For example, the variable region of the human heavy chain germline DNA contains approximately 40 functional VH gene segments, 25 functional DH gene segments and 6 functional JH gene
segments. During formation of the heavy and light chains in the B cell progenitor, only one gene segment from V, D (only in IGH) and J are selected for combination. As selection of gene segments is random, a vast number of gene segment combinations can be achieved in different rearrangement events, known as combinatorial diversity. A recombination signal sequence (RSS) adjacent to the coding region of V, D and J gene segments guides recombination. RSSs are composed of three elements; a conserved heptamer contiguous with the coding sequence, followed by a non-conserved spacer region composed of either 12 or 23 base pairs, and a conserved nonamer. The RSS of V and J gene segments contains 23bp spacers and D gene segments have a 12bp spacer. These spacer lengths correspond to approximately one turn (12bp) or two turns (23bp) of the DNA helix. A gene flanked by an RSS containing a 12bp spacer can only join to a gene with an RSS containing a 23bp spacer, known as the 12/23 rule. This ensures that D genes are able to join to V and J genes but V and J genes aren’t able to directly join. Recombinases RAG1 and RAG2 bind to the RSS flanking the coding sequences to be joined and through their endonuclease activity, cleaves the RSSs and create a hairpin on the coding end. DNA –dependent protein kinase (DNA-PK) and Artemis catalyse a single-stranded cleavage at a random site near the hairpin, creating a single-single-stranded tail formed of a few nucleotides from the coding sequence plus a few of their complementary nucleotides derived from the other DNA strand. This generates palindromic or P-nucleotides at the junctions between the V, D and J segments, stretches of nucleotides derived from the complementary strand. Terminal deoxynucleotidyl transferase (TdT) adds non-template encoded nucleotides, or N-nucleotides, to the ends of single-stranded DNA, followed by the pairing of strands, exonuclease trimming of unpaired nucleotides and DNA repair and ligation processes.
35 This leads to the addition of P- and N-nucleotides at the junctions between gene segments and is a significant contributor to the diversity of the CDR3. As P and N nucleotide addition is a random and unique process to each B cell clone, the composition of the CDR3 region is often employed in clonal analysis studies, including monoclonal B cell malignancies. Once rearrangement is accomplished, the promoter located upstream of the leader sequence in heavy and light chains is brought closer to an enhancer (~ 2kb distance). This close proximity enables the enhancer to activate transcription from the promoter, which is not possible in germline DNA in which the promoters and enhancers are 250-300 kb apart. This ensures that only rearranged immunoglobulins are transcribed to mRNA followed by production of the nascent polypeptide.
A second major source of diversity is achieved through SHM, a process that introduces single point mutations in a step-wise manner throughout the rearranged V region at rates that are 106 –fold higher than background mutation rates experienced by other
genes. SHM occurs during B cell proliferation in the germinal centre with the overall goal to produce B cells with high-affinity antibodies following antigen activation. SHM occurs during transcription due to the action of the enzyme activation-induced cytidine deaminase (AID) which only acts on single-stranded DNA, in which both strands can be affected. AID is exclusively expressed upon activation of B cells. It deaminates a cytidine to a uridine that has two potential outcomes. Firstly, the uridine can be recognised as a thymidine by DNA polymerases leading to transition mutations (c>t or g>a for the opposite strand). Secondly, the base-excision repair enzyme uracil-DNA glycosylase (UNG) can remove the uridine, generating an abasic site that leads to transition or transversion mutations (c>a or g, g>t or c) through repair by error-prone DNA polymerases. Transition mutations are more frequent than transversions. SHM hotspots exist in the V regions consisting of patterns (a/t)a and g(c/t)(a/t), although SHM can occur anywhere within the region. Mutations can lead to amino acid changes that are silent or replacement. CDRs, which are critical antigen binding sites, tend to accumulate replacement mutations whereas framework regions accumulate silent mutations in order to preserve the overall antibody structure. However, it is important to note that SHM does not discriminate between favourable and non-favourable mutations, leading to several B cell outcomes including 1) antibodies with higher affinity, 2) antibodies with
36 lower affinity, 3) antibodies with unchanged affinity and 4) antibodies with lost functionality due to premature stop codon introduction. The selection process which occurs in the light zone selects B cells displaying immunoglobulin with higher antigen affinity to undergo more rounds of division and SHM leading to affinity maturation. B cells displaying low affinity or non-functional immunoglobulins undergo apoptosis due to lack of BCR crosslinking and presentation of a peptide to T helper cells. This Darwinian evolution ensures the selection of only B cells displaying high antigen affinity immunoglobulin to undergo differentiation into either plasma or memory B cells. The third mechanism for antibody diversity is through class switch recombination (CSR). This results in a switched isotype of the heavy chain constant region of an immunoglobulin, leading to a change in effector function without disrupting antigen affinity. Naïve B cells expressing IgM and IgD can change to IgA, IgG, or IgE isotypes, diversifying the antibodies response to a shared pathogen. AID mediates CSR and deaminates a cytosine to uracil within the switch (S) regions upstream of the constant regions (except for IgD). Resulting single-stranded breaks convert into double-stranded breaks within the donor S μ/δ and the acceptor S γ/α/ε. The two S regions are recombined through non-homologous end-joining (NHEJ) with the subsequent deletion of the intervening DNA by loop excision. This results in the replacement of the S μ/δ by the new S γ/α/ε with conservation of the VDJ rearrangement upstream.
1.7.3 B cell receptor signalling
The B cell receptor (BCR) is critical to the development and maturation of B cells and ongoing expression is critical to the survival of mature B cells. Several B cell malignancies, including FL, remain dependent on the expression of the BCR (Kuppers, 2005), suggesting a role in lymphomagenesis.
The surface immunoglobulin forms the extracellular antigen-binding domain of the BCR which is non-covalently bonded to a heterodimer composed of CD79a and CD79b which form the cytoplasmic tail of the BCR. CD79a and CD79b contain conserved peptide motifs called Immunoreceptor Tyrosine-based Activation Motifs (ITAMs) which are
37 essential for intracellular signalling. Following antigen recognition and engagement with the variable region of the sIg, kinases such as Src family kinases Lyn and spleen tyrosine kinase (Syk) are activated which phosphorylate tyrosine residues in the ITAMs (Yamamoto et al., 1993, Rolli et al., 2002). This, in turn, results in the recruitment of the initial signalling complex composed of Syk, Lyn, Bruton tyrosine kinase (Btk), and adaptor proteins Grb2 and B cell linker (BLNK). Lyn provides continued signal amplification as well as forming a complex with CD19 and other costimulatory molecules that reduce the threshold of B-cell activation and cause BCR aggregation (Fearon and Carroll, 2000). Generation of the signalosome results in the production of second messengers, including diacylglycerol (DAG) and inositol-1,4,5-triphosphate (IP3) (Dal Porto et al., 2004). DAG activates protein kinase C (PKC) whereas IP3 leads to calcium influx from both extracellular compartments and the endoplasmic reticulum (Roos et al., 2005). This, in turn, leads to transcription of NFkB genes which have a broad role in B lymphocyte proliferation, class switching (Ruland and Mak, 2003) and survival (Stadanlick et al., 2008). PKC also activates the MAPK pathway (Hashimoto et al., 1998) which regulates a number of transcription factors which can lead to B cell survival, apoptosis or proliferation. To control BCR activation, negative regulators inhibit activation. These include phosphatases (Pani et al., 1995) and kinases such as Lyn which have both activatory and inhibitory properties (Nishizumi et al., 1998).
BCR signalling underpins the fate of B cells as activation can lead to various functional outcomes including survival, differentiation, proliferation, anergy or apoptosis. This is influenced by signal strength and its modulation by negative and positive co-receptors, in addition to the stage of B cell development and interaction with the microenvironment through secondary signals from non-B cells such as BAFF, CD40, TLRs and IL-4 (Niiro and Clark, 2002). Furthermore, signalling strength can regulate which mature B cell subsets can develop. Peritoneal B cells require the strongest BCR signal, follicular B cells require an intermediate signal and marginal zone B cells require a weaker signal (Loder et al., 1999, Martin and Kearney, 2000, Cariappa et al., 2001). This flexibility and fine-tuning by the BCR ensures the correct cell fate is determined to maintain appropriate populations of different B cell subsets and loss of B cells that are functionally obsolete.
38
1.8 Immune cells of the germinal centre
The GC is a critical site for B cell antibody affinity maturation during an immune response. This process is dependent on other immune cells in the GC, including follicular dendritic cells (FDCs). FDCs develop from perivascular precursors of stromal cell origin. Their maturation requires stimulation by lymphotoxin and tumour necrosis factor signalling through B cells (Alimzhanov et al., 1997, Pasparakis et al., 1996). FDCs produce CXC-chemokine ligand 13 (CXCL13) that guides B cells that have entered the lymph node towards follicles by signalling through its receptor, CXCR5 (Allen and Cyster, 2008). Therefore, FDCs contribute to maintaining an organised follicular structure. They also promote B cell survival in the GC through production of B cell-activating factor (BAFF) and interleukin 6 (IL-6) (Wu et al., 2009). FDCs display antigen in immune complexes on their surface and are responsible for causing antigen-driven selection of B cells in the light zone, with survival of B cells displaying high affinity antibodies that are able to exit the GC as a memory B cell or plasma cell.
B cell clones which have low affinity antibodies and a lack of sufficient survival signalling undergo apoptosis. Phagocytic cells such as macrophages and dendritic cells clear these apoptotic cells in the GC. Tingible body macrophages are predominantly found in the GC and contain many phagocytized, apoptotic cells in various states of degradation (Smith et al., 1998). While these macrophages are bone marrow derived, it is unclear whether they arise from circulating monocytes or originate during embryonic development as indicated from studies looking into the origin of tissue resident macrophages (Jakubzick et al., 2013, Epelman et al., 2014).
1.9 Early events in FL pathogenesis
FL pathogenesis is a multi-step process, with the likely earliest event occurring in the bone marrow in which an error in VDJ recombination results in the hallmark t(14;18)(q32;q21) translocation. Evidence of pre-malignant cells and lesions suggests a protracted disease course with the accumulation of several genetic hits required for overt disease manifestation.